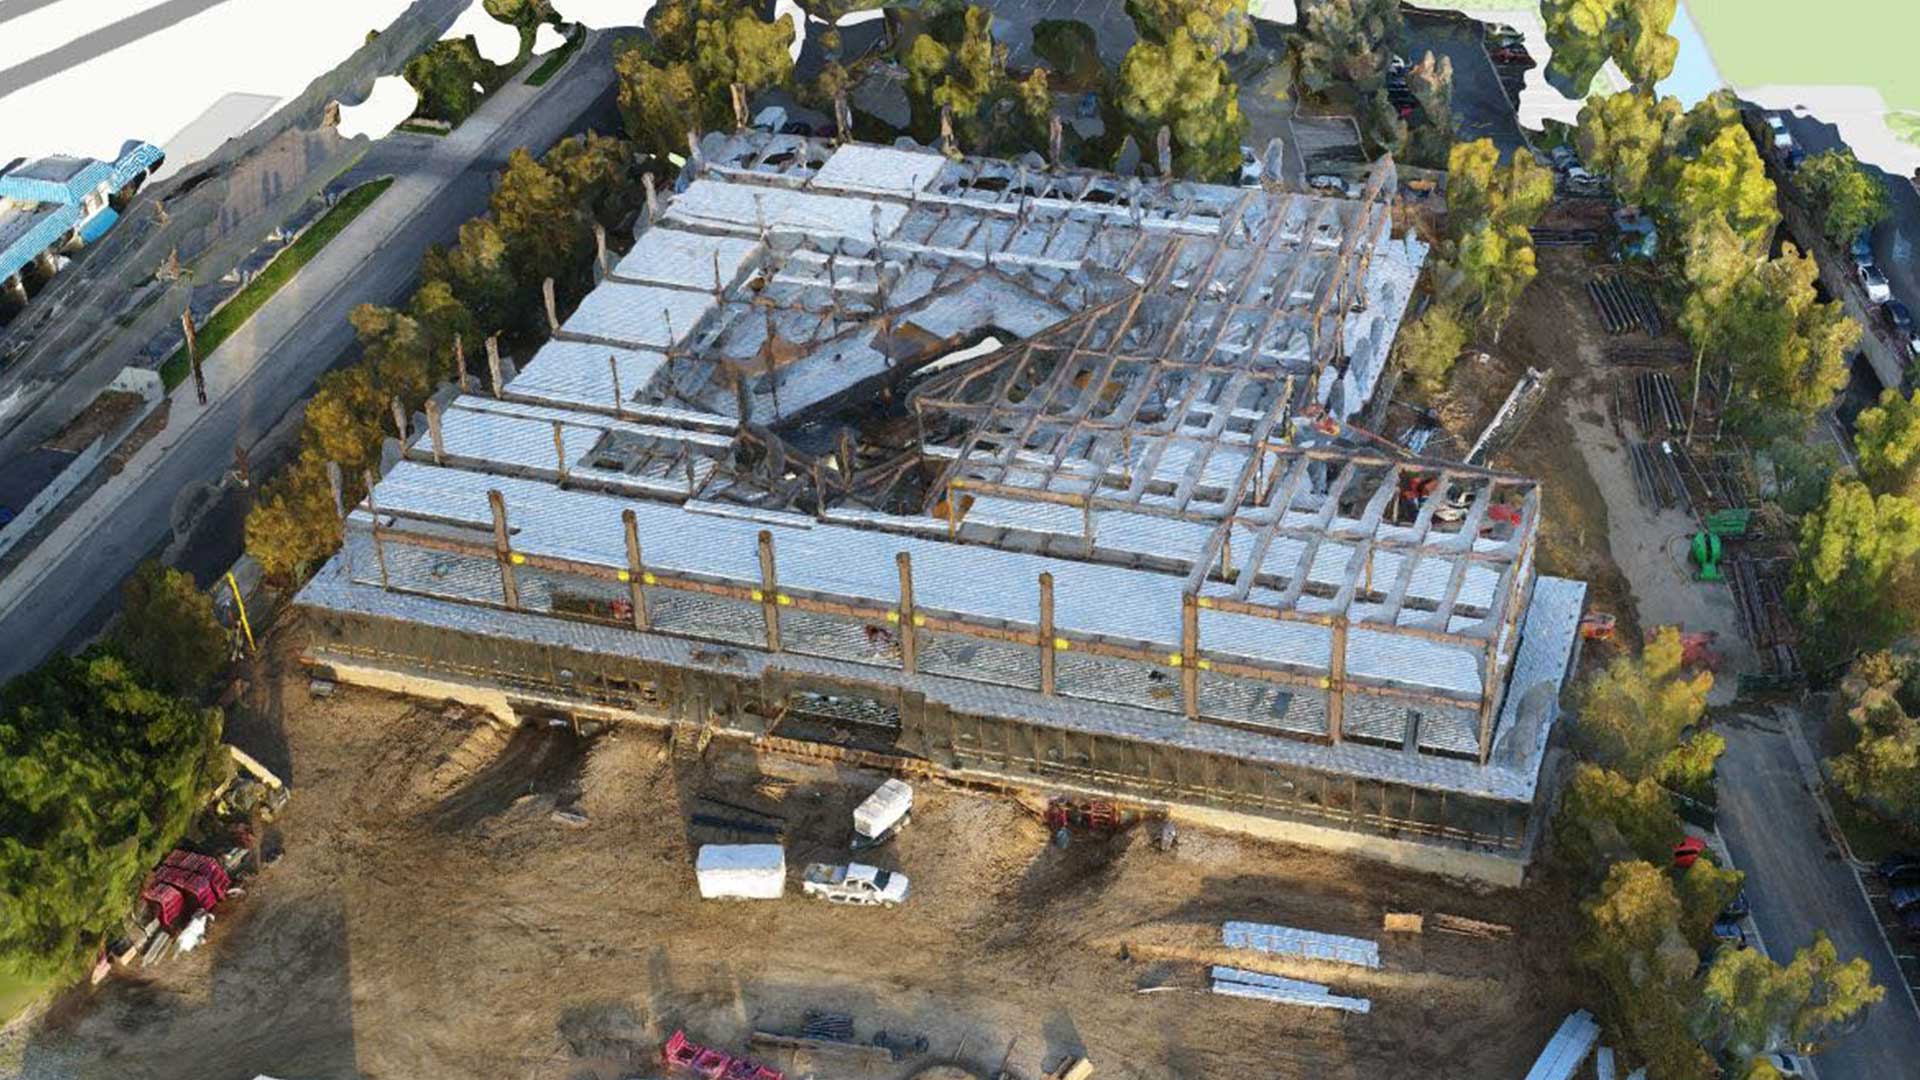
When the Long Island Rail Road (LIRR) began the latest phase of renovations on Jamaica Station—the fourth-busiest rail station in North America—designers knew they needed to take a digital twin approach to project management.
A virtual 3D model of the rail line would help the interdisciplinary project team visualize the complex choreography of construction stages unfolding in a dense urban environment. The latest phase of the $1 billion Jamaica Capacity Improvements (JCI) project would involve large-scale repairs including replacing critical power and signal systems, extending station platforms, and building two new tracks, all aimed at increasing capacity and expanding ridership through the bustling Long Island transit hub.
The infrastructure firm HNTB Corporation won the LIRR design contract in part because it put forth an innovative solution that went beyond a three-dimensional digital twin. Using geographic information system (GIS) technology, HNTB pioneered a 5D project management strategy that integrated interactive 3D models with the additional dimensions of time and cost.
This 5D approach empowers project leaders to track and predict how design changes might affect scheduling or construction costs, and adjust their decisions accordingly. It’s a strategy that illustrates the direction many firms across industries are beginning to take, in fields from supply chain management to ski resorts. Pairing the insights of GIS—known as location intelligence—with digital twin models, business leaders can combine easy-to-understand visuals with a powerful geospatial engine for data analysis.

For an interdisciplinary project involving design and construction teams, budget experts, and project planners, HNTB needed an interdisciplinary technology to govern it all, and GIS served as the cornerstone.
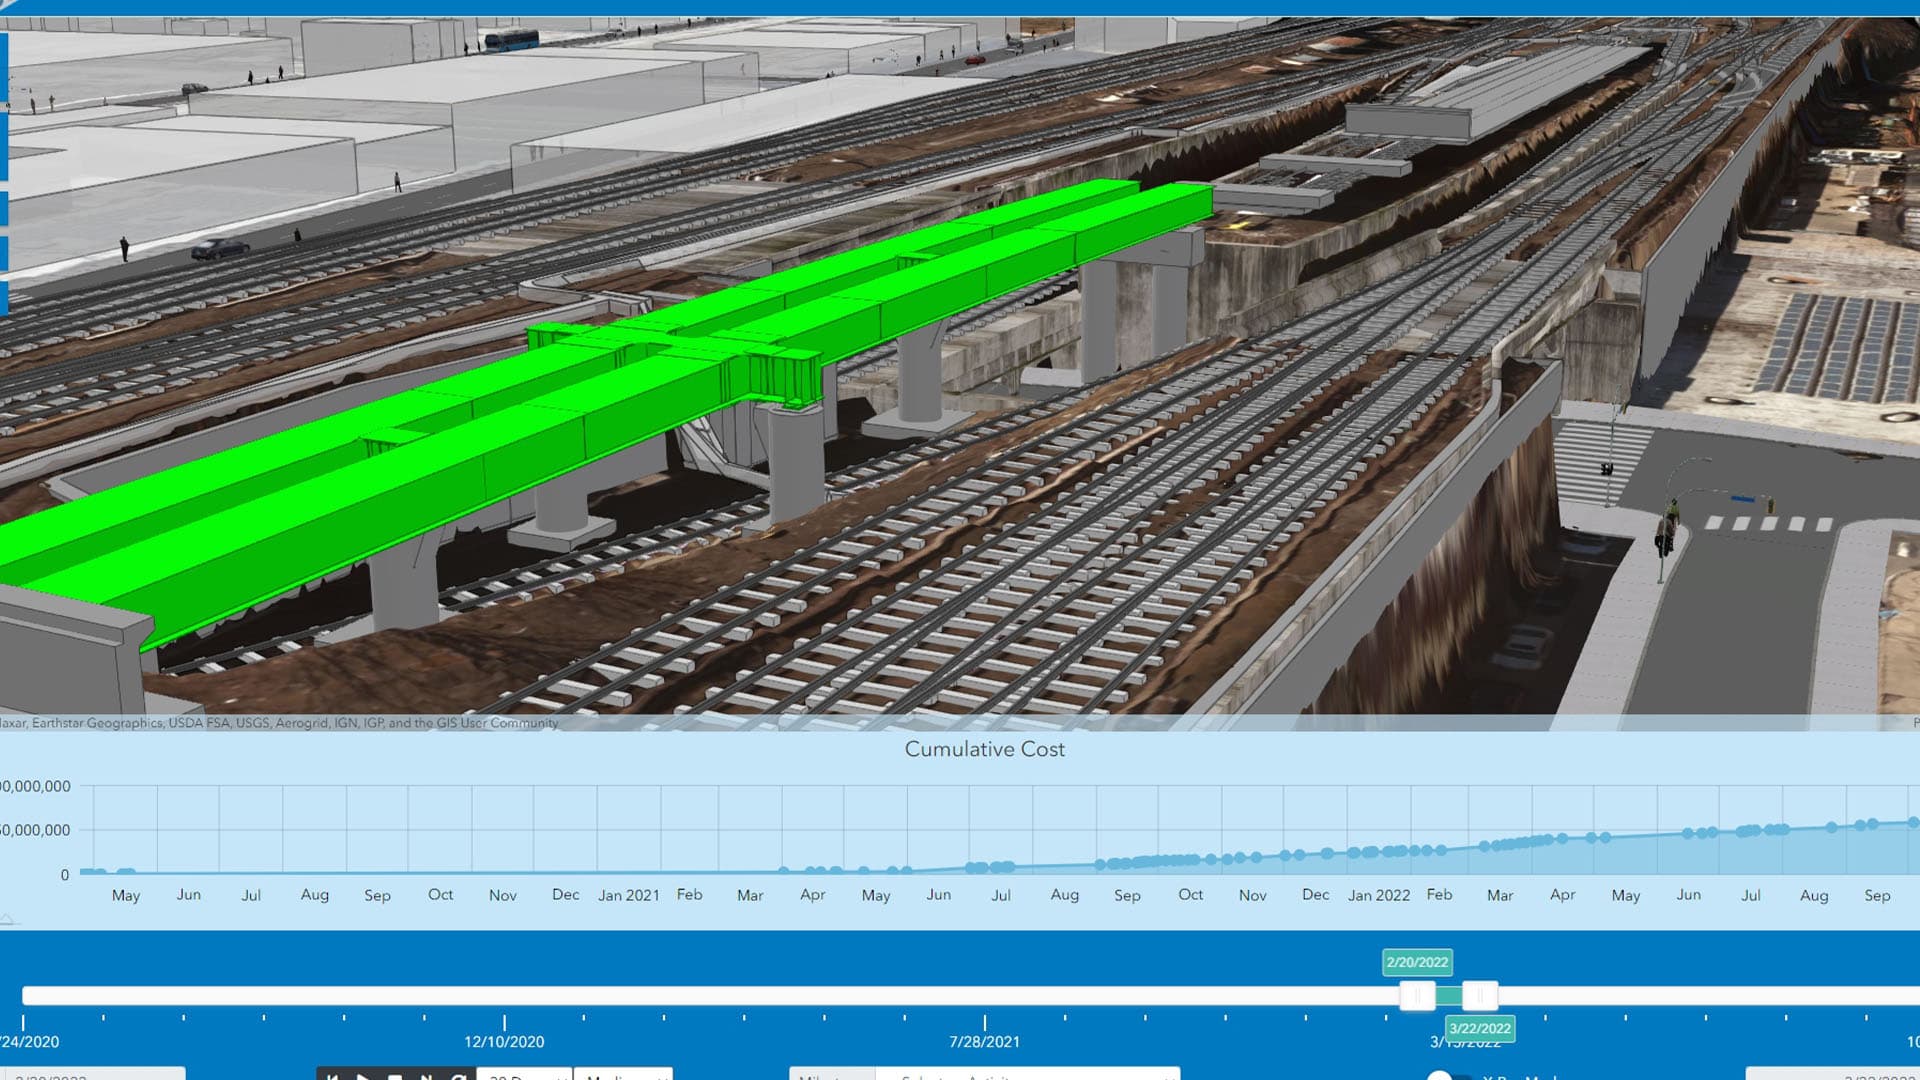
Push Play to View Your Project in 5D
With HNTB now nearing the finish of the design submittal stage, the design team is using the 5D digital twin model as it prepares for the construction phase. While looking at a virtual replica of Jamaica Station tracks, project planners can pull a slider along the bottom of the screen and scroll through 36 months of forecast progress, seeing how far a new section of rail will extend by March 2022, for example.
Alternately, an executive can hit Play on a three-month period of construction and watch a split screen that pairs an animation of a pier being built with a graph that charts the costs tied to that portion of the project.
The ability of GIS to integrate different types of data and software in a cloud-native environment made it possible for anyone associated with the LIRR project to access the visualizations via a web browser.
“A solution like this was critical because trying to convey these complex designs and this complex phase of construction is always a challenge for all the stakeholders,” says Jeff Siegel, a vice president and the Technology Solutions Center director at HNTB. “Now, because of the way we’ve done this, they can pull up and play what the actual construction phasing will be and what the outlay of cash will be based on estimates down to the unit level.”

Location is central to everything we do.
A Web-First Philosophy of GIS Fuels 5D Interactivity
Jamaica Station is part of a heavily trafficked transit corridor that transports over 200,000 passengers a day. The redesign project was important to many stakeholders, including partner agencies, local politicians, and transit officials. A 5D digital twin that was opaque or designed only for those with engineering backgrounds wouldn’t do—city council members might not be versant in AutoCAD.
After Siegel and the HNTB team surveyed the options, they concluded that GIS was the best foundation for executing a 5D digital twin plan of the JCI project.

“GIS is really the only platform that can truly provide that sophisticated integration or convergence of both the location of something as well as the attributes,” Siegel told WhereNext. “That enables such a strong coupling of the analytics when you want to pull all of that together.”
The importance of communication and collaboration on JCI led Siegel and Darin Welch, the project lead and associate vice president of geospatial and virtual engagement solutions, to prioritize a cloud-based, web-first approach. In the past, shareable maps were sometimes among the last things to be produced as a project was wrapping up. That set the stage for a new era, with GIS a key part of digital innovation delivery.
Welch, Siegel, and their team of technologists established a web-based GIS strategy to drive the 5D project from the start, acting as a centralized, authoritative data source where information would be updated continuously and open to any team member—internal or external—who needed access. With that model in place, workers who went into the field to perform inspections of the track and take photos were able to upload such data directly into the GIS platform, making it available within a 5D view.
“It’s really changed the way many people in our organization think of GIS, because location is such a critical dimension of the data we leverage within the AEC space, and it’s an approach we continued perfecting on Jamaica Station,” Welch says. “We see much more openness and willingness to leverage the power of GIS because we can take, with confidence, design information overlaid with other rich GIS datasets and tapestry, then allow that to influence our decision-makers, who are sometimes public.”

This type of solution pattern would be something I'm sure executives are highly interested in: how to be more efficient; how to be more effective; how to communicate better to all levels of stakeholders, even internally.
Geospatial Problem-Solvers
It was this proclivity to pursue new ideas that landed Siegel and Welch the assignment to actualize the 5D digital twin approach. The original idea for the 5D digital twin had come from HNTB’s New York-based design team as a way to help LIRR manage the complex schedule and budget of the Jamaica Station project. The 3D animators on the HNTB marketing team created an animation for the company’s pitch to LIRR decision-makers. Once HNTB won the project, it was up to Siegel, Welch, and their colleagues to turn the concept into reality.
Both men are part of the Technology Solutions Center, an HNTB center of excellence aimed at seeding digital infrastructure solutions throughout the company. Centers of excellence are an increasingly common unit at forward-thinking organizations.
Created by Siegel, a 27-year veteran of the company, the center provides consulting, advisory services, and implementation on a number of cutting-edge fronts across the company. Its members help other departments think through questions like how to streamline an asset management solution or govern data better.
In a company of 5,000, the center employs 45 individuals who focus on specific “patterns,” including infrastructure solutions, civil integrated solutions, asset management and resiliency, and geospatial and virtual engagement—the group Welch runs. As opposed to a skunkworks group, they’re a profit-making center, meaning their innovations must produce bottom-line value.
Because of that profit drive—and because so much of HNTB’s work is grounded in location—GIS and geospatial intelligence are often the lens through which the team views challenges and solutions.
“Darin coined the term ‘geospatial problem-solvers,’ and that’s the common thread we’re looking for, whether it’s a new GIS analyst that we just hired or a senior developer we recruited,” Siegel says. “We’re constantly looking for somebody who has that mindset of, ‘OK, here’s the problem. How do we solve it using the latest, greatest tools that are proven?’”

It quickly became a no-brainer for us that GIS was the best way to help visualize this.
Capitalizing on the Wisdom of the Crowd for Tech Integration
Due in part to client demand, HNTB was already using digital twins on projects including airports and wastewater facilities. A coastal resiliency program for New York City had even employed some 5D visualization. But Jamaica Station would be one of the company’s most comprehensive applications of digital twin technology and 5D elements, incorporating both horizontal and vertical infrastructure.
To sketch out possible approaches, Siegel convened an ideation lunch meeting at HNTB’s Chicago office that ended up stretching across four hours. With boxes of deep-dish pizza on the conference table, the diverse team pulled up potential apps on a projector and filled dry-erase boards with scribbled ideas. They brainstormed what the best toolsets would be, how to enable them to work together, and how to make it all accessible via the web.
Welch’s management philosophy—one that reflects the interdisciplinary nature of GIS—is to bring together multiple points of view, and the meeting included specialists in a number of digital technologies. His team of 10 includes urban planners, transportation engineers, developers, senior analysts, and a geotech engineer.
“Diversity has always been important to me—bringing insights from lots of different backgrounds and interests to see how we can leverage these technologies to make our processes and deliverables more efficient,” Welch says.
By the lunch’s end, they knew GIS would be the hub of the wheel, fed by a number of software spokes responsible for replicating the surfaces, objects, and streets in the digital twin visualization. While much of the design data was provided directly from the project team, a GIS-based “world building” tool gave the 5D immersive experience more real-world context by adding surrounding buildings and features.
An interdisciplinary team brought the vision to life. Senior GIS developer Ian Grasshoff became the visionary behind the web-based viewer; senior GIS architect Bill Cozzens helped design the realistic environment and city blocks around the rail’s digital twin; and Scott Lecher, lead BrIM specialist from HNTB’s civil integrated solutions team, helped align the visual elements into a smooth, scripted process.
To create the 5D view, the team built cost and calendar estimates from the ground up, taking advantage of the fact that each infrastructure element on the project had a cost and activity ID assigned to it. As the digital twin moves through time and a piece of a bridge pier or a track tie is set into place, that unit is added to the cumulative cost and tied to that section of timeline, synchronizing the three main elements of project management.
With the digital model available to all stakeholders, planners can rally around a holistic view of the project, with communication grounded in a shared understanding of the plan.
“We’ve often referred to GIS as a natural integrator,” Welch says. “We’re using it as a way to visualize multiple components from nearly every discipline in a meaningful way. We’re taking data, which these projects have vast amounts of, then turning it into information. But more important is turning that information into knowledge that supports decision-making.”

GIS makes it easy in a web setting to quickly understand and ascertain what you're seeing. Everybody's used to looking at maps these days.
A 5D Digital Twin Strategy Sets a New Standard
Siegel anticipates that projects such as this will raise the expectations for consultants like HNTB. “I have calls every week about a client asking, ‘I heard about this digital twin strategy. Should I be doing it?’” Siegel says. “We’re seeing this concept really get a lot of interest.”
He expects that in the future, elements like 5D and digital twins will become part of other firms’ offerings, even in fields beyond architecture, engineering, and construction. For example, with executives paying more attention to workforce development gaps, visual, interactive twins could be key to transferring knowledge from retiring workers to new hires who need to become productive quickly.
Anytime visual, location-based projects need to be shared with stakeholders, a GIS-based digital twin can be ideal for translating data into clear, digestible 3D—or 5D—formats.
“It really is a big difference maker,” Siegel says. “It’s not a prettied-up rendering. This is real data coming from the design . . . in an effective manner that’s still visually pleasing and readable, but navigable as well.”
The Esri Brief
Trending insights from WhereNext and other leading publicationsTrending articles

December 5, 2024 |

March 3, 2026 |

June 23, 2026 |

March 17, 2026 |

April 7, 2026 |

June 9, 2026 |