Informed citizens make better decisions. The COVID-19 pandemic has revealed the urgent need for clear communication of information regarding medical, economic, demographic, and social circumstances. The Johns Hopkins COVID dashboard gained popularity by providing advanced yet easy-to-use GIS tools to convey crucial data—now governments and organizations of all sizes are taking of advantage of this model. The U.S. Census Bureau has launched a data hub that provides important information for coronavirus-related planning. By visiting covid19.census.gov, anyone can access, use, and disseminate key geographic, economic, and demographic information for their unique constituencies.

What is a data hub?
A data hub is a website that gathers information together in one place, based on the needs of a particular audience. The U.S. Census Bureau’s COVID-19 data hub focuses on demographic and economic resources that are important as governments and organizations plan their next steps in responding to the ongoing medical and economic crises coincident with the pandemic. Visitors to the hub can customize and share the maps, infographics, and data with their audiences.
How can organizations use and share materials from the hub?
The maps, charts, infographics, and datasets on the U.S. Census Bureau’s COVID-19 data hub are free to access and share. Whether or not you are an ArcGIS user, the data hub offers ways to disseminate this vital demographic and economic information.
If your organization uses ArcGIS for geographic analysis, all elements on the hub site can be customized and incorporated into the organization’s messaging. You can embed infographics into your website to maintain dynamic content and functionality. Datasets and layers can be imported into your organization’s web maps, story maps, dashboards, and apps. Layers are ready-to-use and can be deployed for your own mapping needs or GIS analysis workflows.
If your organization does not use ArcGIS products, the information on the data hub is still highly usable. Elements like infographics can be easily exported as images and distributed through an organization’s website or newsletter. Infographics are an aesthetically pleasing way to convey a large amount of information in a ready-to-read format. Web maps from the Demographic and Economic Analysis section can be embedded in a website or dashboard in order to convey information uniquely relevant to your organization.
What information is included in the hub?
The hub is a one-stop shop for data vital to understanding the location of at-risk populations and economic impact and recovery in the wake of COVID-19. The data comes from the U.S. Census Bureau; its organization and presentation are made possible through partnership with Esri. The hub is continually updated.
This hub has already gone through three updates, and in each of those updates, we’ve taken a lot of feedback about the data and variables available.
As we learn more about the spread of the pandemic and the populations and businesses most affected, the data hub displays more and pertinent information.
Using Esri’s ArcGIS software and products, the hub displays a range of data and data visualizations. The elements of the hub are powered by the U.S. Census Bureau’s American Community Survey and County Business Patterns. The hub includes:
COVID-19 Impact Planning Report
This dynamic infographic shows key facts at the state and county levels, including information about at-risk populations, health insurance coverage rates, and regional business statistics.


Weekly Business Formation Statistics
This dashboard provides timely and high-frequency information on new business applications and formations in the United States.

Highlighted Census Programs

- Weekly Household Pulse Survey: This quickly deployed survey collects data on COVID-19’s impact on jobs, housing, food access, and schooling (among other surveyed categories) and allows viewing in an interactive tool displaying the results.
- Weekly Small Business Pulse Survey Dashboard: This brand-new survey measures the changes in business conditions for small businesses during the pandemic. The published results show the impacts on small businesses for any surveyed week, as well as trends over time.
- Community Resilience Estimates: This feature uses 11 risk factors to measure the ability of a population to recover from the impacts of disasters. Data shows the risk level by state, county, and tract.
Demographic and Economic Analysis

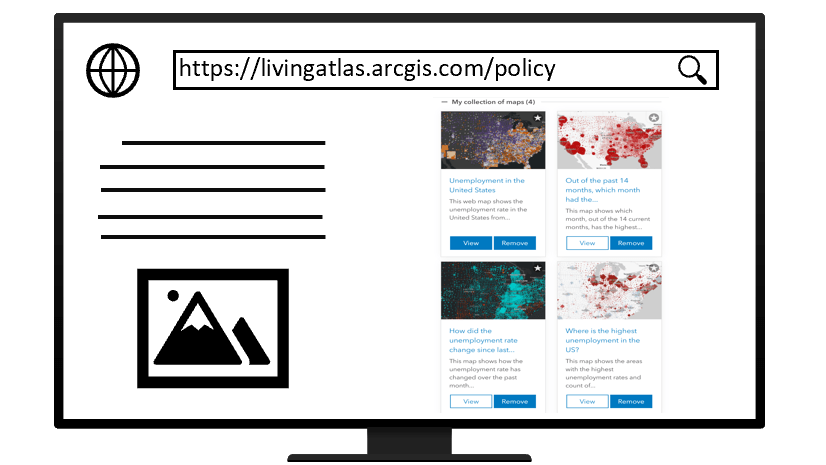
This collection of eight maps features information about vulnerable populations, businesses, employment, poverty levels, uninsured statistics, and language spoken at home. Maps include:
- Data on Employer Businesses from County Business Patterns (CBP)
- Data on Nonemployer Businesses (e.g. Self-Employed Persons) from Nonemployer Statistics (NES)
- Percent of Households with Less Than 75,000 (USD) of Income
- Percent of People Below Poverty
- Language Spoken at Home
Highlighted Datasets

For those interested in using the data, this collection of Census and American Community Survey (ACS) datasets highlights American communities that may experience particular demand for coronavirus-related healthcare and allows for easy integration into ArcGIS products or your own offline workflows:
- Population and Poverty Status
- Income and Benefits
- Population by Age and Sex
- County Business Patterns
- Nonemployer Statistics (NES) Business Variables 2017
Categorical Datasets Search

These pre-set searches of the U.S. Census Bureau’s vast trove of datasets allow the user to easily locate useful data in the form of Excel spreadsheets or feature layers:
- Demographic Characteristics
- Housing Characteristics
- Social Characteristics
- Economic Characteristics
- Business Characteristics
- Employment Characteristics
The Census Bureau realizes that in the midst of the pandemic, communities need reliable information. The COVID-19 Data Hub moves that information closer to the people who need it most.


Article Discussion: