Recently the Living Atlas team released a new app called Wildfire Aware. This app was designed to allow users to dynamically view information about wildfires and their potential impacts. When wildfires occur the citizens and those across the country have a variety of questions. The central idea for the Wildfire Aware app is to provide timely answers to those questions for a variety of trusted sources. ArcGIS Online, ArcGIS API for JavaScript, ArcGIS Pro and ArcGIS Living Atlas content made it feasible for a team to assemble and deliver those answers in the Wildfire Aware app. The Esri team responsible for this project wants to share a bit about the “making of” Wildfire Aware.

Audience and Purpose
Members of ArcGIS Living Atlas team frequently talk about the audience for and purpose of a map or app because it helps turn discussion about data into discussion about questions and answers. In this blog, we call out key decisions made to illustrate those occasions when the team recognized a way it could turn data into impactful information.
A key step is to define the audience. The audience anticipated for this app includes:
- Communities and residents near a fire
- Curious people who are hearing about a fire and are interested but live far away
- People with emotional or historic ties to the area – vacation rentals, family heritage, etc.
- Corporations who want more awareness of their customers impacted by a fire
- Organizations with an interest in environmental impacts of fire
- Media organizations seeking information that is traditionally difficult to obtain
This app is not a substitute for official maps and evacuation information being shared by local authorities. Our audience wants to view information, see the current and potential impacts, and share the map via social media, an email, or a text message so that the recipient can see the same exact map and information the sender is viewing.
We prioritized some of the questions the audience might have. Some of these questions are relatively simple facts to obtain, while others have a more complex nature.

App and Map Design
The Living Atlas team previously built an app called Hurricane Aware which served as the inspiration for our work on Wildfire Aware. It gave us a comparable user experience to talk about as requirements for a wildfire equivalent were discussed.
The wildfire basemap was developed early in the project and quickly began to achieve visual design objectives. The basemap author wanted near-seamless transitions between imagery and human geographies (towns, roads, forest boundaries, etc.) The basemap sets the stage for the fire location and perimeter on the map.

The basemap also helped the team think about the right layers to query to provide data to the information panel on the right side of the app. It’s one thing to put a town’s name on the map, but how many people live there and in nearby rural homes? It’s straightforward to show a fire perimeter overlaying a forest boundary, but what natural resources were present there? What if just a small piece of the fire boundary touches a census tract or a state forest boundary – what does that small overlap contribute to the whole story?
Data Aggregation
The map’s visual quality helped raise the bar of expectations for analytics, queries and the overall quality of the user experience. Braiding these threads together became a crucial part of the work. The team chose to tell a story about each fire’s effect on natural resources and people in the area. Data was perfectly well-structured for GIS analysis work but not structured for viral-ready application use.
The Hurricane Aware app summarizes population data using U.S. Census tract data because hurricanes are such large events, geographically speaking, that census tracts are a relatively small unit of geography to summarize using a hurricane swath or cone of uncertainty. For wildfires, we noticed that census tracts were not a suitable layer to use to summarize population in relation to a wildfire perimeter or distance for point of origin. Wildfires start small and their size changes hour by hour, so a more granular census geography was needed: census blocks.
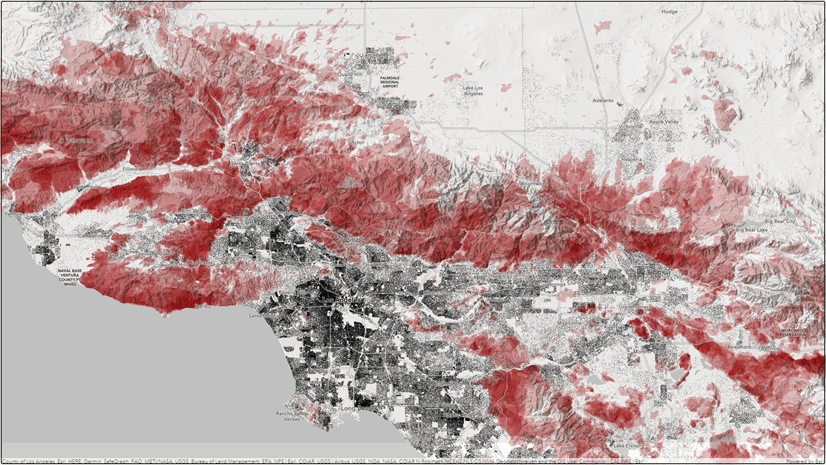
To facilitate team awareness of the problem with tracts and proposed solution, we used Arcade in our pop-ups to evaluate our spatial queries and visually inspect the results onscreen. That allowed us to show everyone the differences between tract level queries and block level queries. The map below illustrates this – the yellow boundary is a census tract affected by the Mosquito fire (in red). The map also shows census block centroids, represented by the people symbols. By displaying fire perimeters in relation to populations and infrastructure, users gain a sense of the potential impact of a given fire.
 with the Mosquito Fire (in red).")
We switched from querying tracts to querying blocks using a census block apportionment method. This is a proven approach used by ArcGIS Business Analyst and other tools. The team selected population and housing characteristics of interest and used ModelBuilder in ArcGIS Pro to prepare a blocks layer with those characteristics pre-apportioned to each block. The estimated values are then easily summed for blocks that fall within the fire perimeter or other spatial query. The resulting layer was delivered in ArcGIS Online as a feature layer so that the information could be rapidly queried by a pop-up, the app, or (eventually) a Notebook. Having a ModelBuilder model allowed us to easily add and delete attributes in that layer.

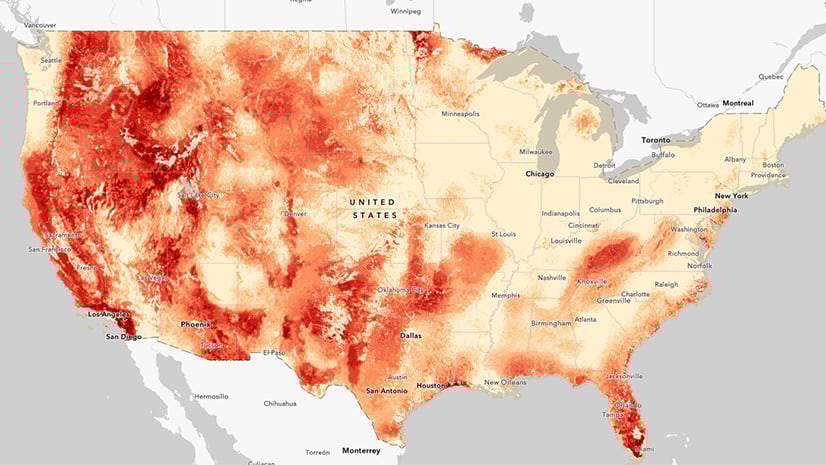
A similar approach was adopted to query layers with data about natural resources. To track what the fire is doing to the natural resources, we created an array of hexagons covering all 50 states, one data point per square mile. With that hexagon array we sought to answer the following questions: What potential is there for a wildfire hazard in that area? Is the area rich with threatened or endangered species? What ecoregion is this a part of? What types of landforms are found in that area, is it high mountains or flat plains? Is the fire burning in federally listed critical habitats? What public ownership, wilderness areas, and tribal nations are affected? How much of this area is forest, grassland, shrubland or bare ground?

One way of looking at a fire’s environmental impact is to account for how much carbon is potentially lost to the atmosphere when it is consumed by the fire. For this, we conducted analysis using a US Forest Service carbon model and assembled the total carbon stored in each hexagon. We counted carbon above ground for each square mile in forest canopy, understory, and dead material above ground.

Optimizing for Performance
Nothing goes viral like a fire. This is something we all have experienced when there is a structure fire in our neighborhood. Everyone wants to know what’s going on… at the same time. And everyone seems to be asking the same questions. When did it start? What happened? How did it start? Did their pets get out? Is everyone OK?
It dawned on us that everyone would be asking the same questions of wildfires as well. Given the way we had envisioned the app working originally, a large number of people could query the app at the same moment and overwhelm it. Maybe there was a way to prepare a set of answers before anyone even launches the app? Doing this would speed up the application considerably.
We can display population at risk and the underlying natural resources data for every fire using data aggregation, but there’s a caveat. If the query originates from the app, it means that every time a user clicks on a fire the data aggregation process is performed. This workflow can work for simple apps but what if thousands of users are clicking on the same fire every second? There is no need to query the data based on the same fire a thousand times per second.
We knew that the natural resources and population data does not change often, and the fire boundary changes a few times a day. We realized that the live feed of fire perimeters could dictate the frequency of queries. We just do the query once after a fire perimeter receives an update, and we store the results and display them every time a user clicks on a fire. Using this approach, we can pre-calculate those queries on population and natural resources and store the results in a feature layer to be available for the app. That query is cached in the CDN as well, further improving performance.
To do this we used Esri live feeds technology. At regular intervals, a notebook in ArcGIS Online queries vital information from the census blocks layer and the one square mile natural resources hexagons layer and aggregates the results, writing them to a table related to the wildfires feed. In this way the app already has the answer for the map user before they even click on a fire. This cuts way down on the number of queries made to the server making it able to handle everyone’s need for information.
This is especially useful for viral apps; we would have one query per fire instead of thousands of queries per second, dramatically reducing the number of times we perform an operation and increasing performance. We update the results of the pre-calculations if new fires appear, or their perimeters are updated. This process is implemented using live feeds and a notebook.
We created a live feed routine. A live feed routine was set up to automatically aggregate natural resources and population data based on the current fire perimeters. The live feed routine runs every hour as a hosted notebook in ArcGIS Online and stores the results of the fire aggregation process in a hosted feature service. The hosted feature service is used by the app to retrieve the results of the data aggregation process instead of doing it on the fly every time a user clicks on the map.
A hosted notebook was selected for running the live feed routine because it removes the need to set up a new system. It already has all the python libraries and tools required for the data aggregation, and it is a truly scalable solution: we can increase the frequency it runs during fire season or decrease it in the off season.
Live feeds allow us to reduce the number of queries performed by the app as well as increase responsiveness. Using hosted notebooks allows us to quickly set up and deploy routines and make them scalable during on and off season.
Application
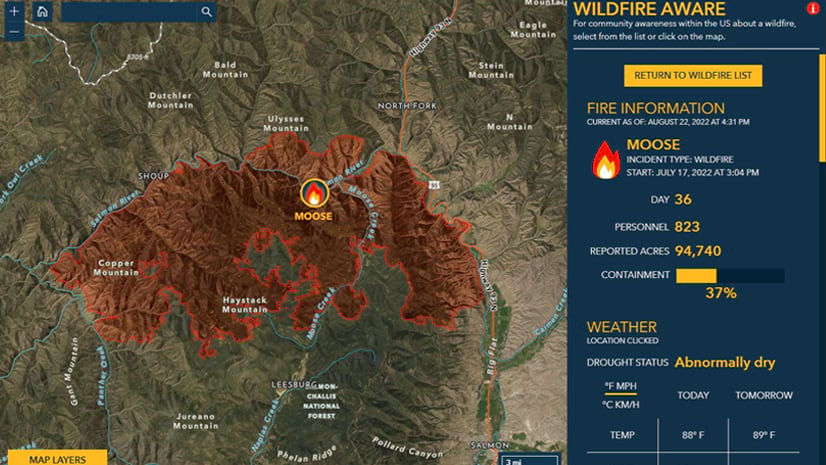
At the most fundamental level the goal of Wildfire Aware is to present and report to a wide-ranging audience the latest information about wildfires along with summarized information about the areas within and around them.
The basic layout of the app gave a lot of space to the map but gave the main attention to the right-hand panel that lists the fires and facts about a chosen fire. The map is at times a supporting actor in this app’s story, and at other times is a main focus. The app choreographs that.
The app is built with the ArcGIS API for JavaScript which dynamically connects all the visual elements – the information sidebar, the widgets, and some of the map-related graphics. Having the notebook bear the burden of pre-processing the aggregated layers freed up the application to perform simple, cache-able queries. The aggregated layers contain the key information that gives depth to the app by providing the human and ecological context throughout the map which uses the ArcGIS REST API.
Using a feature service’s endpoint URL we can access the information within that service, its layers, and associated capabilities. With a GET request we can query a feature service’s specific layer to receive the needed information. Once the requested information from our GET request is received, we double-check the returned query-object and then render that data with the other layers (fire information, temperature, drought conditions, wind, and air quality).
Apps built with ArcGIS API for JavaScript are highly adaptable and all the customized parts of this app work together: the list of fires ranked by number of people assigned to them, the report panel with all the information related to the fire and surrounding area, and the map with its controls. As a result, the audience can go to Wildfire Aware to obtain integrated information on people and natural resources at risk in a single place, by just choosing a fire or clicking on the map.

Results
As you have read, the various parts of ArcGIS contributed to the success of the team in bringing Wildfire Aware to life: ArcGIS Living Atlas, ArcGIS Online, Notebooks, ArcGIS API for JavaScript. Once all the pieces of the project came together, we wanted to explain this graphically and the result is above, courtesy of Emily Meriam.
Thank you to all the contributors to this blog: Emily Meriam, Gonzalo Espinoza-Davalos, Jim Herries, Michael Dangermond, Calvin Manning, James Sill, Chris Ferner
About the authors


Calvin Manning


Article Discussion: