After this year’s User Conference Plenary, it’s clear that 3D GIS is evolving quickly and changing expectations for engagement, decision support and operational planning. 3D GIS adds value to your investment in 2D GIS by providing an immersive and intuitive experience with new potentials for visualization and content. Advances in 3D GIS offer an exciting opportunity to adopt and present a new way of thinking about the ArcGIS Platform, and it ultimately should complement how you’re already planning, innovating and implementing meaningful 2D maps and apps.
3D Operational View for Wildfire Fighting
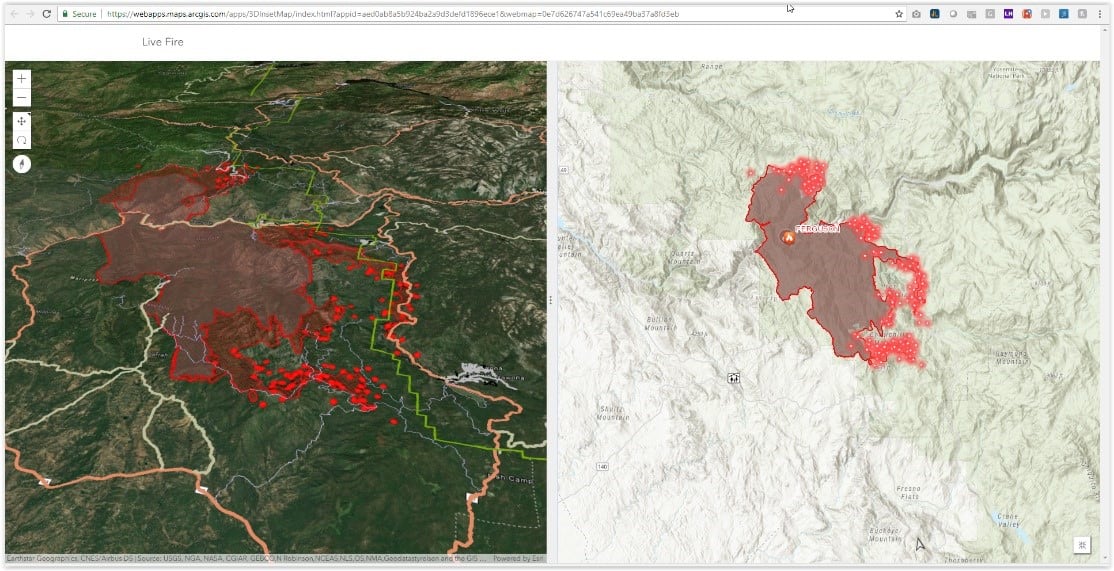
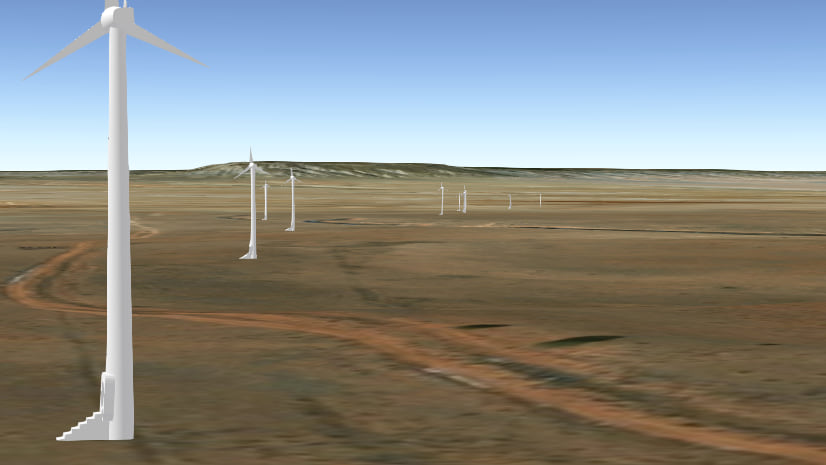
Paul Doherty from the National Alliance for Public Safety GIS recently utilized the 3D Inset Map, (now a 3d app template) to enhance situational awareness in the recent Ferguson Fire near Yosemite National Park. Paul uses the 2D maps to show the simple relationship between the wildfire perimeter and MODIS hotspots to structure and fuel. “3D maps help provide comprehension and a better understanding of how terrain may influence outcomes. In the case of a wildfire, seeing vegetation and topography in a 3D environment helps the map come to life.” Steep terrain affects fire movement, and it’s critical to understand that while placing resources or planning evacuations. The process was easy for Paul; “I just added the layer to my web scene and then published a Web App.”
3D maps help provide comprehension and a better understanding of how terrain may influence outcomes. In the case of a wildfire, seeing vegetation and topography in a 3D environment helps the map come to life.
2D Operational services are immediately accessible in Scenes and 3D apps
Paul’s example helps illustrate a pattern where existing GIS data is leveraged inside a 3D scene for enhanced situational awareness. ArcGIS Online and Enterprise make it simple to maintain data authority and timeliness while rolling out new 3D information products that support the existing and emerging needs of their staff.
The Authoring Approach
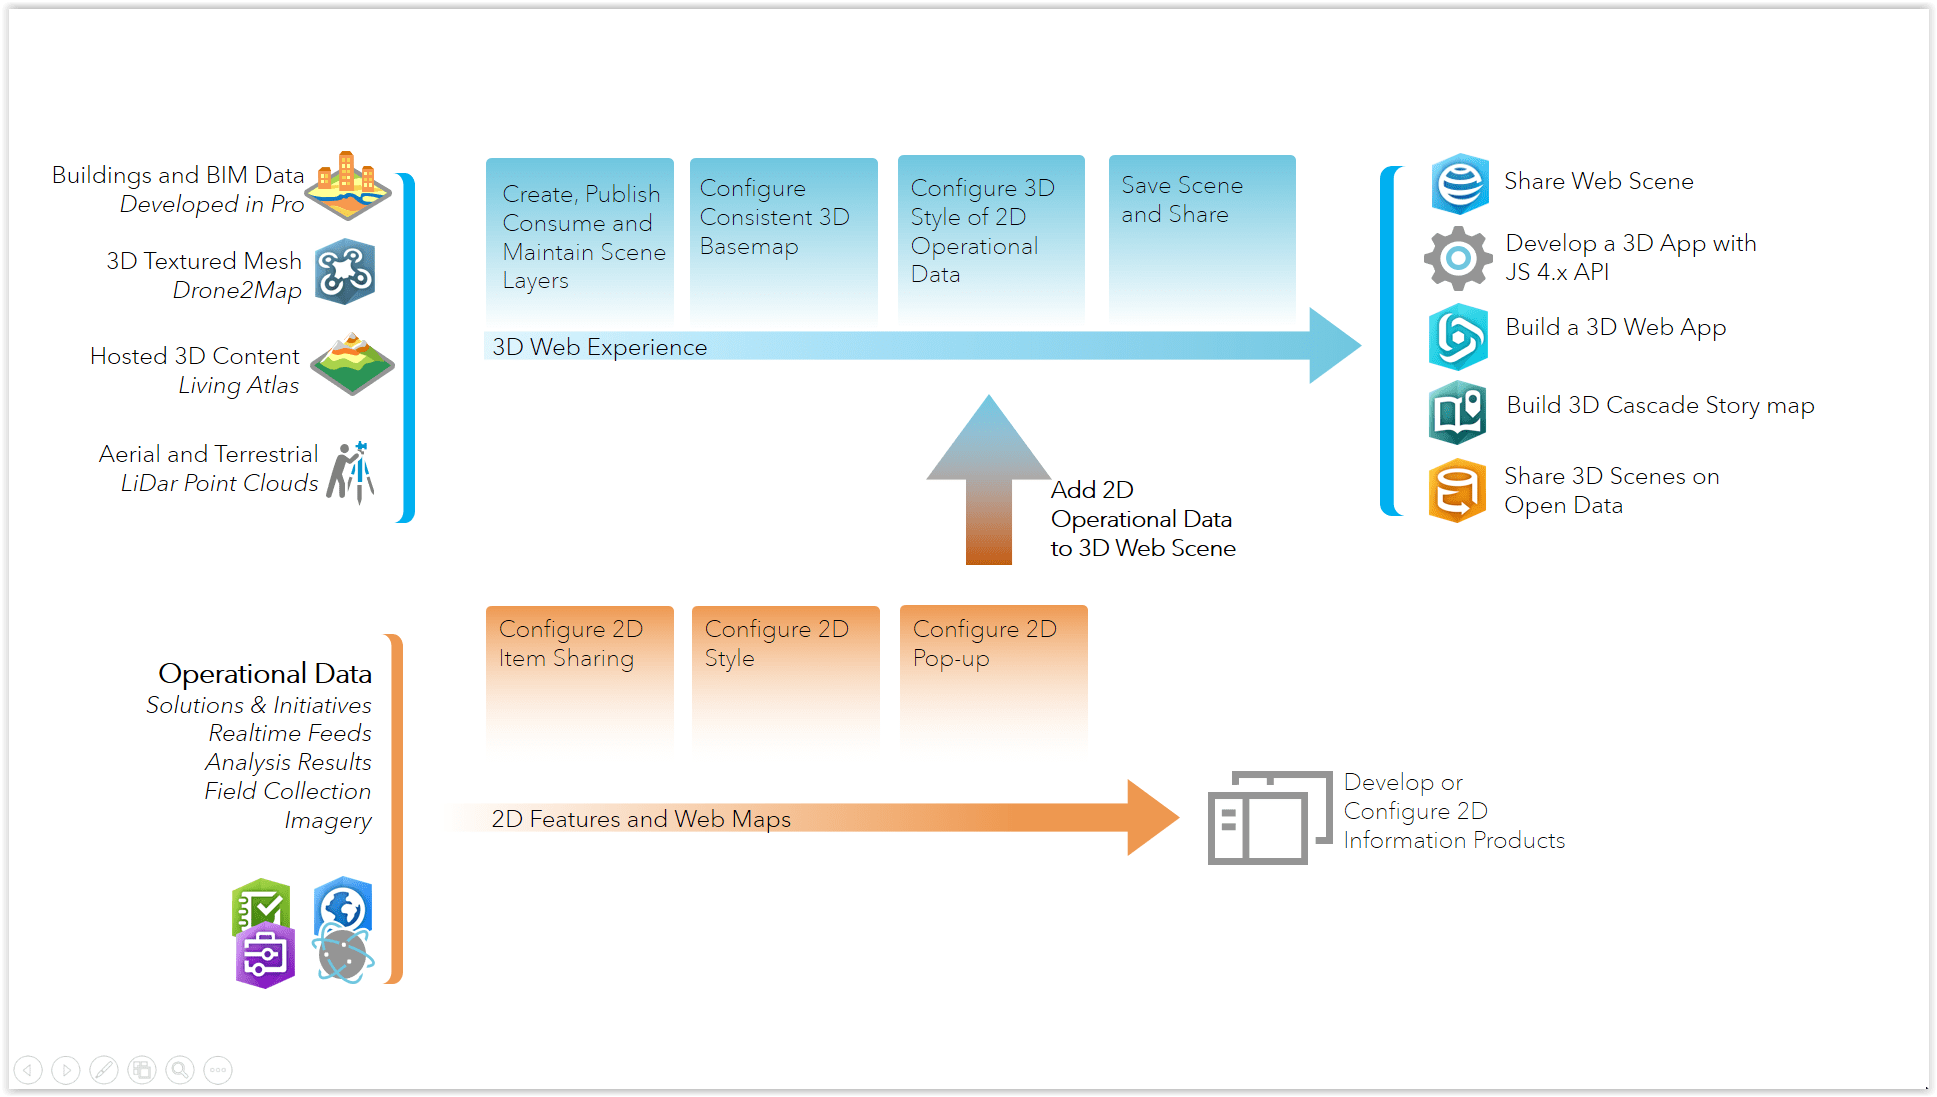
Working with 3D should incorporate your investment in traditional GIS data and organizational workflows without adding additional maintenance or confusion for you or your users. Organizations that use maps to support decision-making by reviewing and contextualizing operational 2D data can search for and add that operational 2D data directly in a 3D web scene. When properly configured and introduced into the organization, 3D adds immediate value to the end user. Since 3D Web Scenes are now accessible on mobile devices, it’s a great time to explore delivering 3D scenes and apps.
- 3D is Immersive and Intuitive: Our world is 3D and data visualizations in 3D provide an intuitive and immersive experience. With scene slides, you literally define the end user’s perspective to highlight observations.
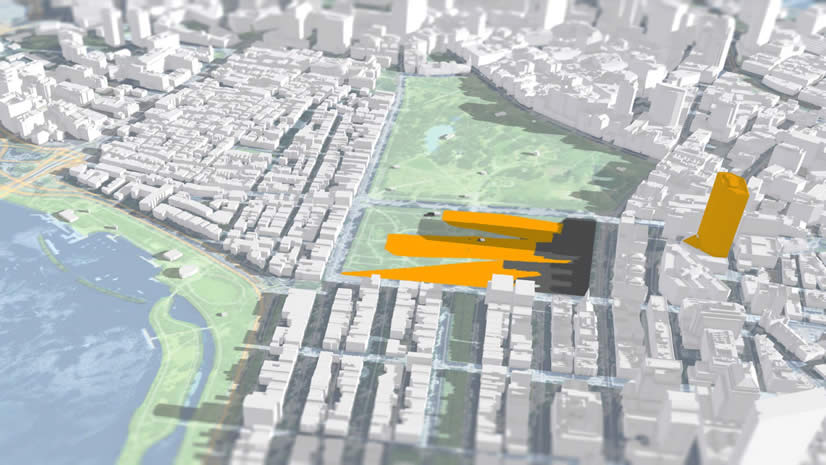
- New Visualization Styles and Possibilities: Represent attribute values with extrusions, use realistic 3D objects for cartographic styling.
- New Contextual Data Types: Contextualize Operational data with 3D Textures from Drone2Map or hosted terrain and buildings from the Living Atlas.
Authoring 3D scenes and apps rely on establishing consistent basemaps to orient the user and provide a framework for overlaying information on your organization’s Digital Twin. The Living Atlas and ArcGIS online community makes it easy to get started building your own 3D basemaps. Elevation is an immediately usable service that covers the entire world, and there are several cityscapes with 3D building models hosted in major cities. Several organizations are also sharing their 3D building models, high-resolution LiDar data and 3D textured mesh data derived from Drone2Map publicly through ArcGIS Online. If you can’t find the right 3D data to support 3D scene-building, it’s getting easier to produce 3D basemaps using drones.
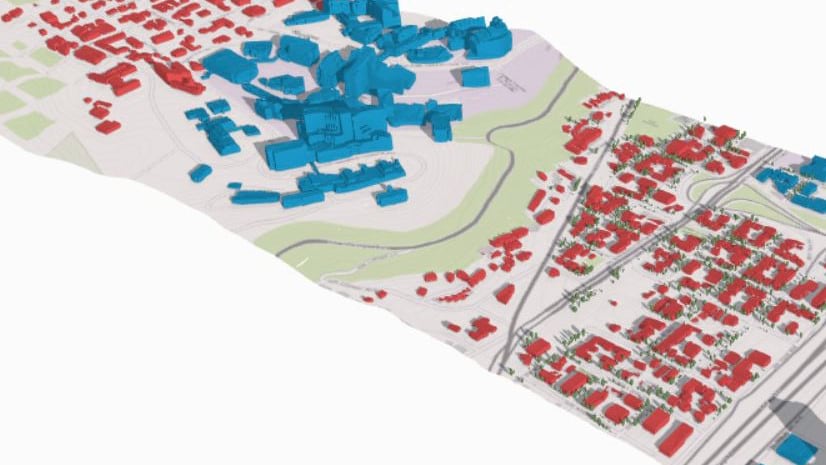
Authoring 3D Scenes using authoritative 2D Data
Authoring for 3D
Feature layers in Enterprise and ArcGIS Online are ready to be paired with 3D basemaps and consumed in 3D web scenes and apps. Operational data in the form of Feature layers can be added to the Scene, and most of the configuration options of that feature layer will persist in 3D. 2D item configuration options can also be used to augment the 3D authoring experience, providing more cartographic choices while preserving consistency with your audience. Point Feature layers are now unlimited by number of features supported, and polygon and line Feature Layers can support up to 2000 features.
Pop-ups
Pop-ups configured in either the item details or a web map persist in 3D scene, and it’s a great way to add functionality to a scene view or 3D app. Pop-ups have a lot of value for end users, and you can use them for activities like viewing inspection details (including attachments!), summary statistics and even use advanced expressions through Arcade. There aren’t many opportunities to provide operational summary statistics or attribute information currently in the 3D web experience, so supplementing with meaningful pop-ups is a good strategy for information products that support briefings or decision making.
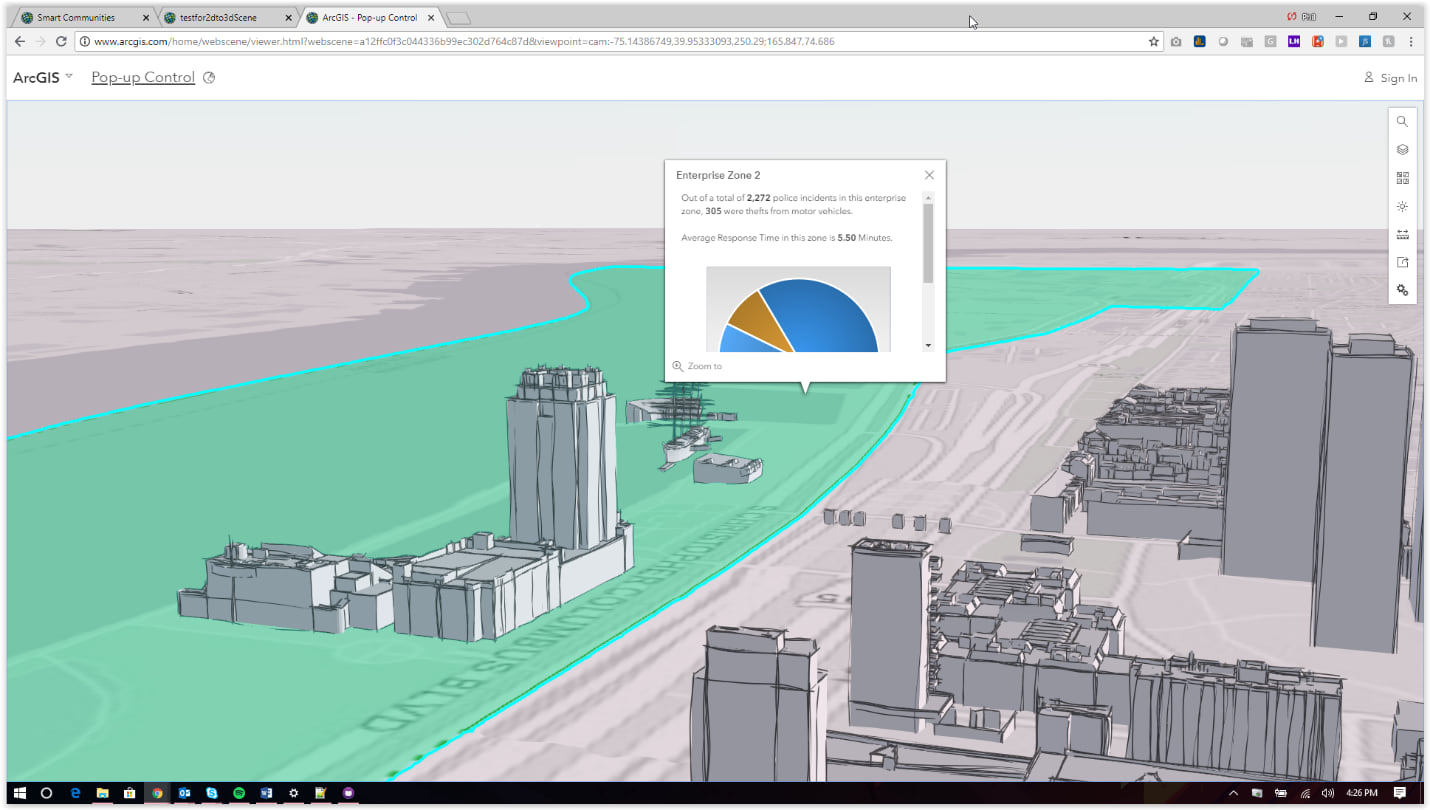
Use meaningful Pop-ups to enhance your Scenes and 3D Apps
Symbology
A majority of the symbology choices configured in item details or web maps will persist in 3D, and this is great news for analysts working to maintain consistency in information products from 2D to 3D. Not only do analysts have options available to depict data with 3D styles or extrusions, but there are hundreds of symbology choices in the web map and item detail configurations that can be applied to the 3D experience. Additionally, you can introduce custom symbology to your 3D scene by referencing hosted images to provide a customized feel. Using 2D or ‘flat’ symbology is also a great way to reduce overhead and increase the performance of your scenes, just be mindful that flat symbology will not be visible behind 3D objects (no matter the transparency).
Create eye-catching scenes with Firefly symbology.
Smart Mapping
Smart Mapping provides a useful option to explore data through styles and scales based on one or more fields. Many of the smart mapping options available in 2D smart mapping persist in 3D and can be foundational way to communicate metrics within the context and perspective of 3D scenes. Counts and Amounts, 2D Sizes, Symbolization of Time, Arcade Expressions are all significant smart mapping functions to communicate attributes meaningfully and consistently across your organization. Since the 3D web mapping experience is so immersive, you can define the perspective for the user with slides to guide the user towards essential observations.
To add to the visualization options, the Scene Designer enables 3D smart mapping on 2D feature layers. Point feature layers can use height to convey and compare attribute values, or point features can be symbolized with thematic or realistic 3D object models. You can even create and host your own 3D models as styles. A point cloud Scene Layer also presents smart mapping options that help you get the most out of your hosted LiDar data.
Clustering and Heatmapping symbologies do not currently persist in 3D scenes and apps, but you can achieve comparable results with geoprocessing tools (Kernel Density and Collect Events).
Labels
Labeling in 2D feature layer configurations persist in 3D, and it can be a great strategy for orienting your users with reference layers or call out information. The use of ‘halos’ help to make the text stand out from the background, and color choices can help differentiate layers. You also have the potential for utilizing Arcade expressions to customize what and how your labels are communicating.
Rotation
Symbol rotation is handled a bit differently in scenes. Since rotation is relative to a map view, symbol rotation doesn’t persist correctly into a scene. There are, however, options for rotating 3D shape symbols based on attribute values that present options for realistically depicting directionality. This can be useful for a real-time tracking feed.
Refresh Interval
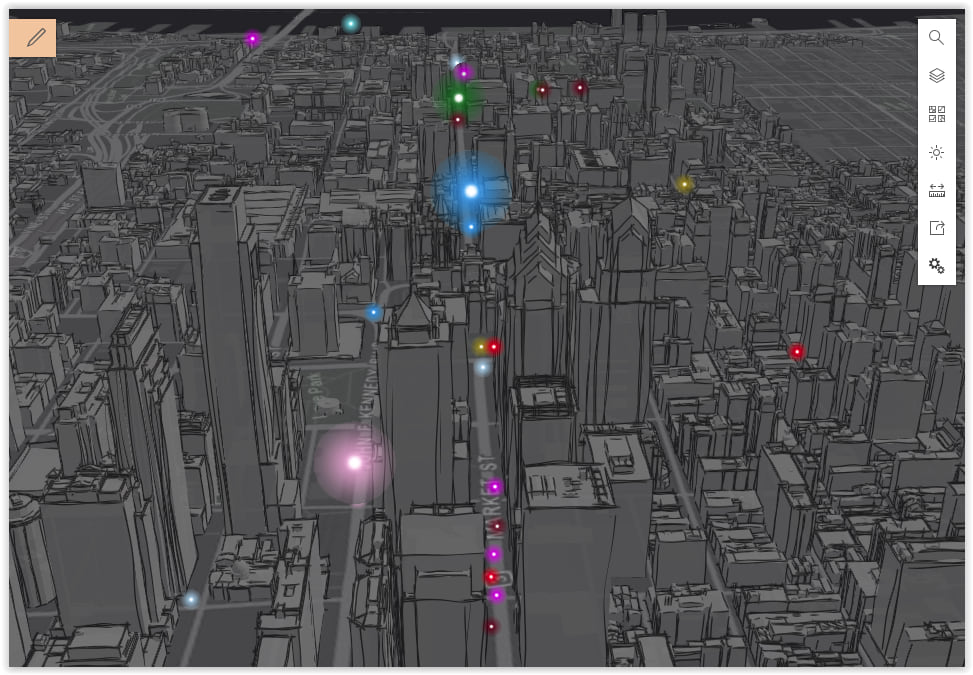
3D scenes and apps honor real-time data from the GeoEvent Server Role. This is valuable to provide situational awareness to managers and dispatchers who are working with live tracking data from AVL systems. All that’s necessary to prepare this data for a scene is to set a refresh interval in the item configuration details. In the example below, I present a feed from GeoEvent Server that represents a real-time tracking layer with additional context if they’re moving within line of sight of placed spotters. A useful tip: 3D symbols will show behind buildings with transparency, but 2D or ‘flat’ symbology will not visualize behind transparent buildings and other 3D features.
Scenes can visualize real-time data
Views
Ultimately, views are instrumental in sharing versions of operational data to groups while hiding specific fields, filtering features and providing specific symbology and pop-up information. Views refer to the original feature service, and the view updates as new features are added. Not only can Views be a useful way to segment and provide access to data into different security groups, but you can use Views to create symbology choices that can be optimized for 3D.
Tips for getting started
When getting started, one of the biggest challenges to consider is orienting the user to a new experience and giving them every chance to understand and navigate the scene. Slides, reference labels and inset maps help make initial 3D Operational scenes more approachable for first-time users.
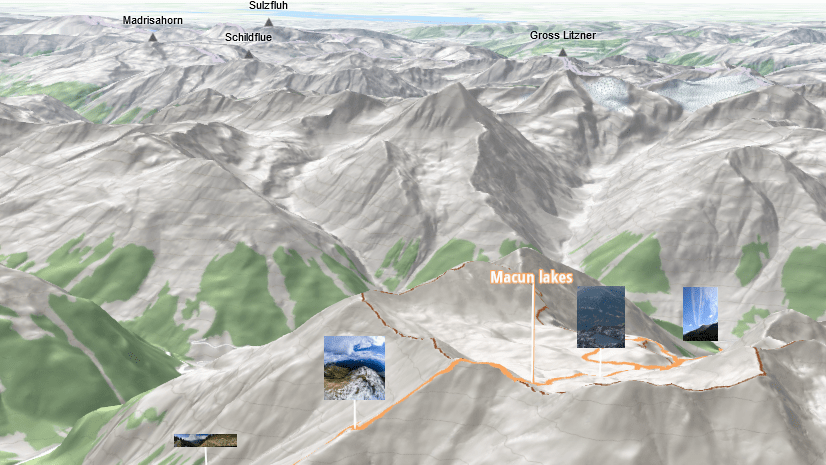
- Slides: Slides in scenes are analogous to bookmarks in the web map. Save slides to turn layers off and on and to present specific viewpoints with slide labels that can provide additional context. Story maps and web apps can use slides in conjunction with the story map narrative or to drive locations in the web app.
- Reference Labels: 3D Scenes can use 2D basemaps to help orient users initially. Labels in the basemaps for street and place names, however, are often difficult to read as 3D Scenes are tilted. Making 3D place names and labelling them within the scene helps orient users to their viewpoint.
- 2D Inset Map: Paul’s example showing fire perimeters utilizes an Esri Early Adopter Template: 3D Scene with Inset Map. By giving a shared representation of 2D and 3D, it helps translate the experience of navigating and orienting within a 3D environment with guides found in their regular 2D experience. You can call scenes and web maps in the URL, and this template provides a convenient example to understand administering and maintaining 2D and 3D views.

Commenting is not enabled for this article.