I recently had a conversation with a GIS professional responsible for assessing the feasibility of developing utility and energy projects in the southwestern United States. Knowing this, I asked him two questions:
Me: Does your organization build 3D web apps?
Him: No.
Me: Do you have a use-case or desire for building 3D apps?
Him: Absolutely, but I don’t have 3D data…
Me: You don’t need 3D data to build 3D apps. You can get started with what you already have.
At the 2018 Esri Developer Summit in Palm Springs, Raluca Nicola and I presented on this very topic: you don’t need 3D data to get started with 3D apps! In fact, many of you can take your existing data and get started today using the ArcGIS API for JavaScript (JS API).
Building an airspace encroachment analysis app
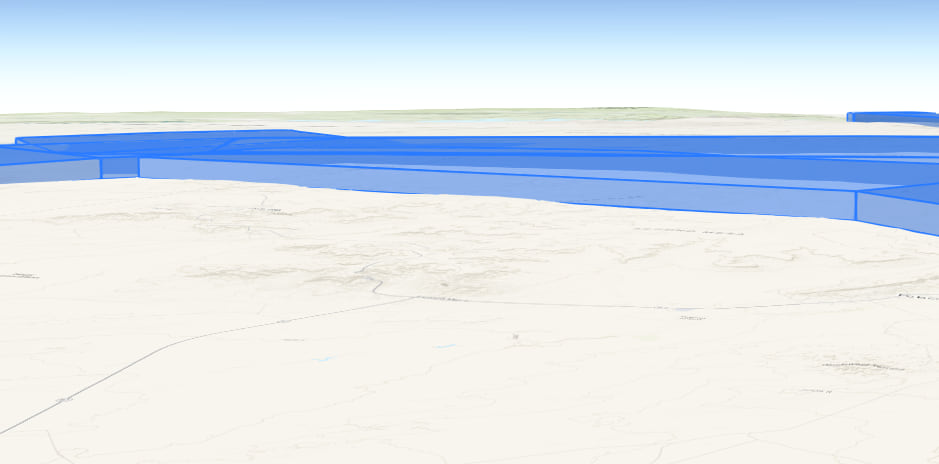
The case this user posed involved displaying Military Training Routes (MTRs) in a 3D view and using that data to visually represent whether proposed energy or development projects, particularly wind farms, are at risk for encroaching on them. An MTR is airspace reserved for military training, and must be kept clear from any interference. MTR encroachment has been a hot topic lately since wind turbines have been designed to be larger and more powerful in recent years.
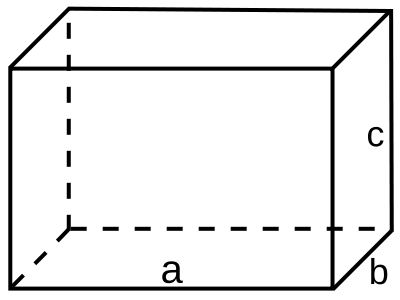
In 2D maps an MTR is commonly represented as a line or a polygon. In reality it is a volume, similar to a cuboid, defined by a set length (a), width (b), and height (c).
The project proposals this user deals with largely focus on wind farms. So the goal of the 3D app would be to visualize the MTRs in 3D; plot the locations of proposed wind turbines, visualizing them as 3D models; and assess whether the turbines are at risk for encroaching on MTRs based on their height, which can be modified in the app.
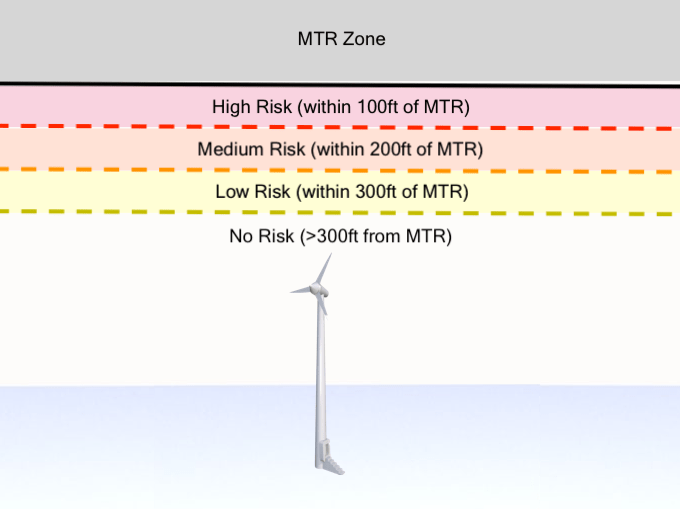
Multiple risk levels could be defined to classify whether a project proposal has potential for interfering with designated MTR airspace. For prototypical purposes, the user indicated the app should determine encroachment in one of three risk zones, each 100 feet apart from one another, expanding vertically and horizontally from the MTRs.
I acquired a subset of my colleague’s MTR data, which was represented as polygons. This data contain a number of attributes, including the elevations (relative to the terrain) of the bottom and top of each MTR. With that polygon layer, which contained attributes representing vertical measurements, and a CSV file containing fictional wind turbine locations, I was able to create the following proof of concept in a matter of just a few hours.
To see how it works, open the app and click the download icon in the top right corner of the view. Then drag and drop the CSV into the view. The height of the turbines is automatically read from the CSV and used to determine their risk for encroachment. The color of the MTRs is updated to reflect the risk the turbines pose at the given height. Notice that you can alter the height of the turbines to re-run the analysis.
Airspace encroachment analysis
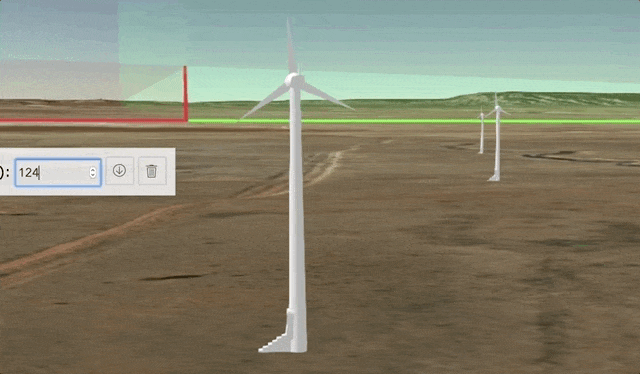
Turbines are imperceptibly small at the initial startup location so you may need to zoom a few times toward to the purple point symbols to see them. You can also click the “Zoom to turbines” button (icon with four arrows pointing inward) in the top left corner of the view to zoom to their locations.
As you navigate to the turbine locations, you will notice they are rendered with 3D symbology based on their indicated height. As you change the height of the proposed project, the height of the turbines will likewise change to reflect how they would appear in the real world in relation to the MTRs and the surrounding elevation.
How the app works
There are three aspects of the JS API used in this application that allow us to render 2D data with 3D symbology in 3D space:
- Extrude polygons based on real-world measurements
- Offset features in vertical space using attribute fields
- Draw 2D points with 3D realistic symbology scaled to real-world size
Extrude polygons
Polygons can be extruded using an ExtrudeSymbol3DLayer in a PolygonSymbol3D. The following snippet will extrude all polygons in the layer based on a fixed height of 1000 meters.
layer.renderer = {
  type: "simple",
  symbol: {
    type: "polygon-3d",
    symbolLayers: [{
      type: "extrude",
      size: 1000,  // meters by default
      material: {
        color: [ 43,123,255,0.5 ]
      }
    }]
  },
};
But we want to extrude the height of each area based on a real-world value since heights will vary depending on the MTR. This is accomplished with the real world size visual variable, which is set directly on the layer’s renderer. If we had a height field, we could simply reference the field name in the visual variable and the JS API would handle the extrusion based on values in that field.
// extrude features based on field value
// using a size visual variable
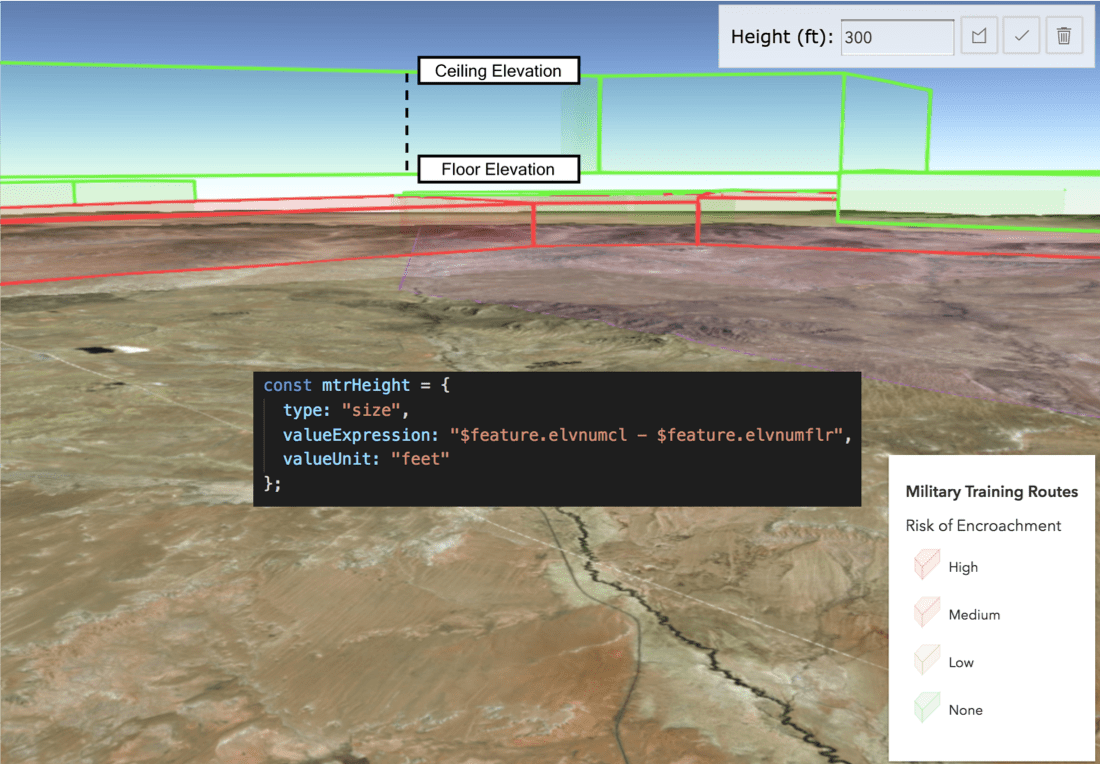
const mtrHeight = {
type: "size",
field: "heightField",
valueUnit: "feet"
};
renderer.visualVariables = [ mtrHeight ];
layer.renderer = renderer;
The MTR dataset, however, has two fields that can help us determine the height of each zone: elvnumcl (elevation ceiling) and elvnumflr (elevation floor). We can use Arcade in the size visual variable to take the difference between those two values, allowing us extrude based on the actual height of each zone.
// extrude features based on Arcade expression
const mtrHeight = {
  type: "size",
  valueExpression: "$feature.elvnumcl - $feature.elvnumflr",
  valueUnit: "feet"
};
For example, if the elevation of the ceiling of the zone is 30,000 feet and the floor elevation is 12,000 feet, then the extrusion value will be 18,000 feet.
Offset features in vertical space
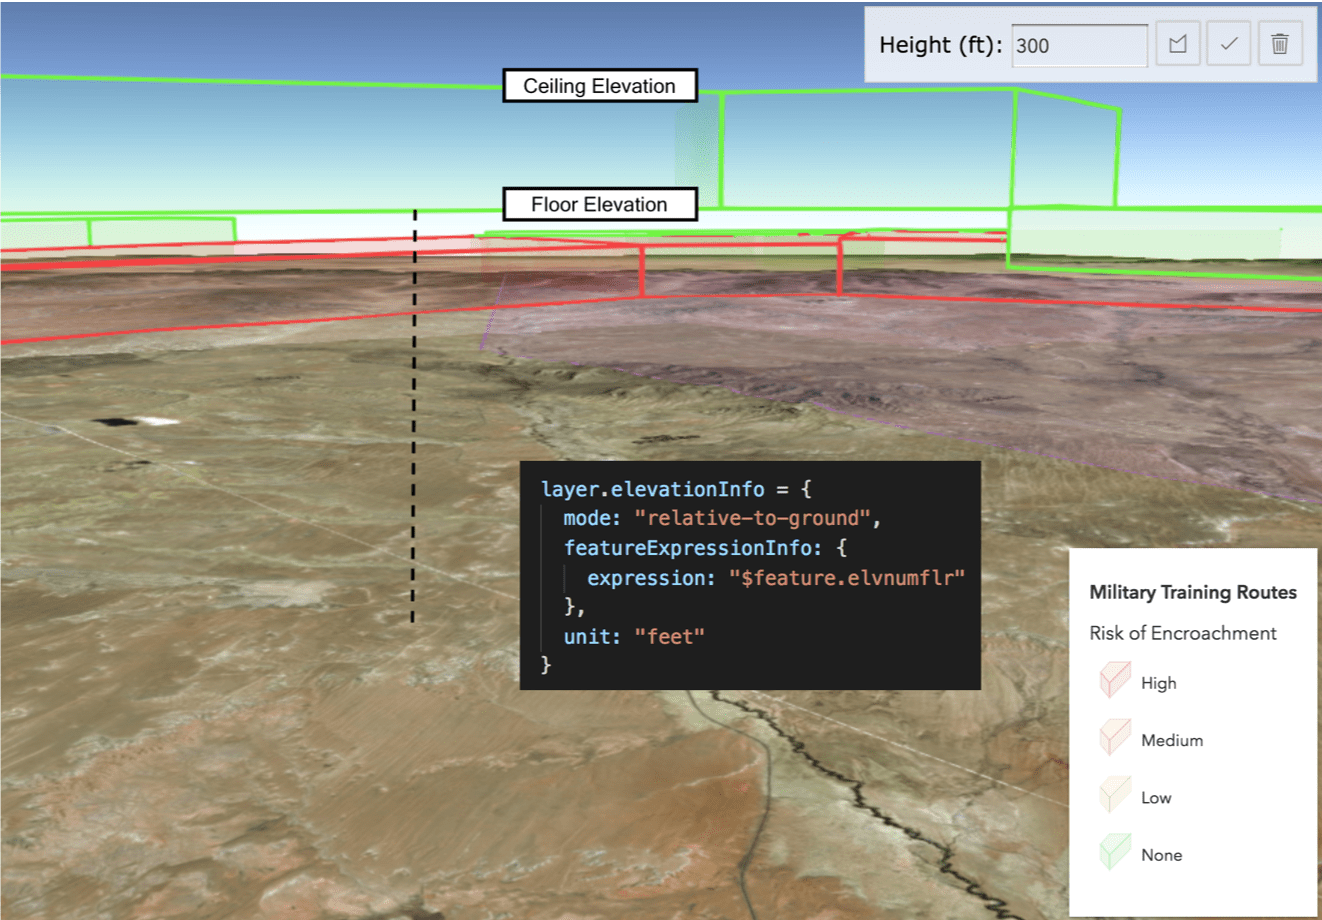
The elevationInfo property of the layer indicates where the features should be drawn in vertical space. If geometries have z-values, then they are placed at those absolute locations by default. Understanding the configurations of the elevationInfo property is essential when creating 3D apps with 2D data sources. When I say “2D”, I specifically refer to features that don’t have z-values in the geometry object.
In the MTR data, the elevation floor attribute indicates the altitude, or number of feet above the ground (not sea level), at which the bottom of the MTR resides. Since this value is relative to the ground, we’ll use the relative-to-ground mode, setting the offset to the elvnumflr value.
// vertically offset features based on elevation
// or z-value stored in data attribute

layer.elevationInfo = {
  mode: "relative-to-ground",
  // other values: absolute height | on-the-ground | relative-to-scene
  featureExpressionInfo: {
    expression: "$feature.elvnumflr"
  },
  unit: "feet"
};
Check out the Elevation options sample to become acquainted with all the options available to you in this powerful configuration setting.
Draw 2D points with 3D realistic symbology
Now that the MTRs render at their appropriate locations, let’s add the wind turbines to the map and style them with realistic 3D symbology.
The ability to render 2D points with complex 3D models is one of my favorite parts of the ArcGIS API for JavaScript. The API has hundreds of symbols available that can be drawn in your app with just a few lines of code. The realistic symbology is defined with the API’s WebStyleSymbol class. To use a web style symbol, simply search the Esri Web Style Symbols reference page and indicate the style and symbol name of the model you wish to use. You can even copy and paste the snippet used to construct the symbol directly from that page to your app.
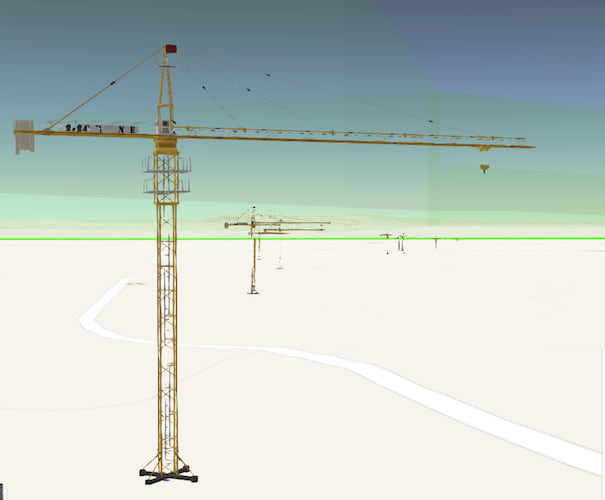
For example, to render the points with a construction crane model, paste the following code to the symbol of the CSVLayer renderer.
// render points using a 3D model
// of a construction crane in a web style
// provided out-of-the box by the JS API

csvLayer.renderer = {
  type: "simple",
  symbol: {
    type: "web-style",
    name: "Tower_Crane",
    styleName: "EsriRealisticTransportationStyle"
  },
  visualVariables: [{
    type: "size",
    field: "total_ht",  // crane height in feet
    axis: "height",
    valueUnit: "feet"
  }]
};
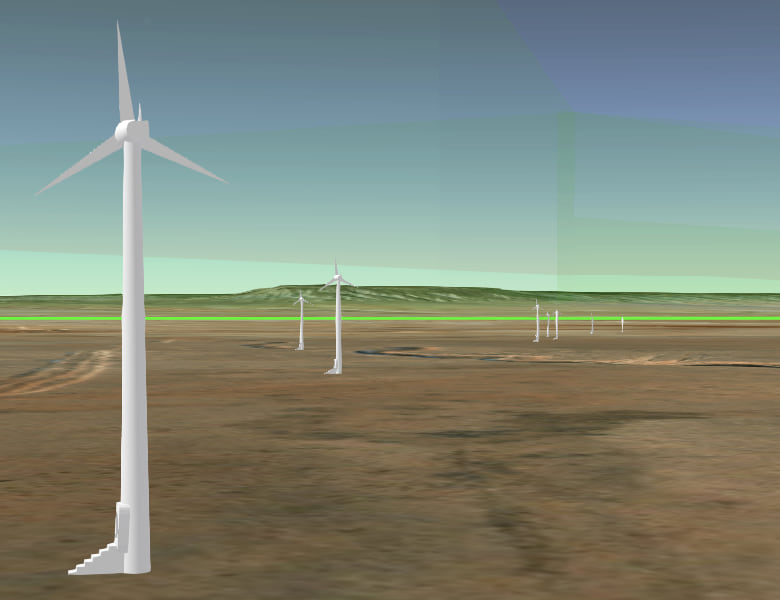
Since the JS API doesn’t have a wind turbine symbol, we can publish our own to ArcGIS Online and consume it in the app. See the Share a web style documentation on how to accomplish this. My colleague Russell Roberts and I found this free wind turbine 3D model symbol after doing a search on Google. We downloaded it and published it to ArcGIS Online using ArcGIS Pro. It took no more than five minutes from the start of the search to actually using the model in my app.
Use the same RealWorldSize visual variable to scale the symbol based on its height in the real world. You can use Arcade to scale the model to custom heights based on user input.
// render points using a 3D model
// of a wind turbine published from ArcGIS Pro

csvLayer.renderer = {
  type: "simple",
  symbol: {
    type: "web-style",
    styleUrl: "https://www.arcgis.com/sharing/rest/content/items/635f270120664b6fa510ff5dd2ba099a/data",
    name: "Turbines"
  },
  visualVariables: [{
    type: "size",
    field: "total_ht",
    axis: "height",
    valueUnit: "feet"
  }]
};
3D client-side analysis
For the purposes of this application, simply rendering 2D data in 3D is not enough. Performing an encroachment analysis is what ties the two data sources together and makes this app useful. We can perform an encroachment analysis client-side using the JS API’s geometry engine and simple math with the elevation attributes.
The analysis will be executed in a custom function set to the field property of the renderer. This will allow us to analyze each MTR in relation to the project and shade them with a different color depending on the assessed risk level for encroachment.
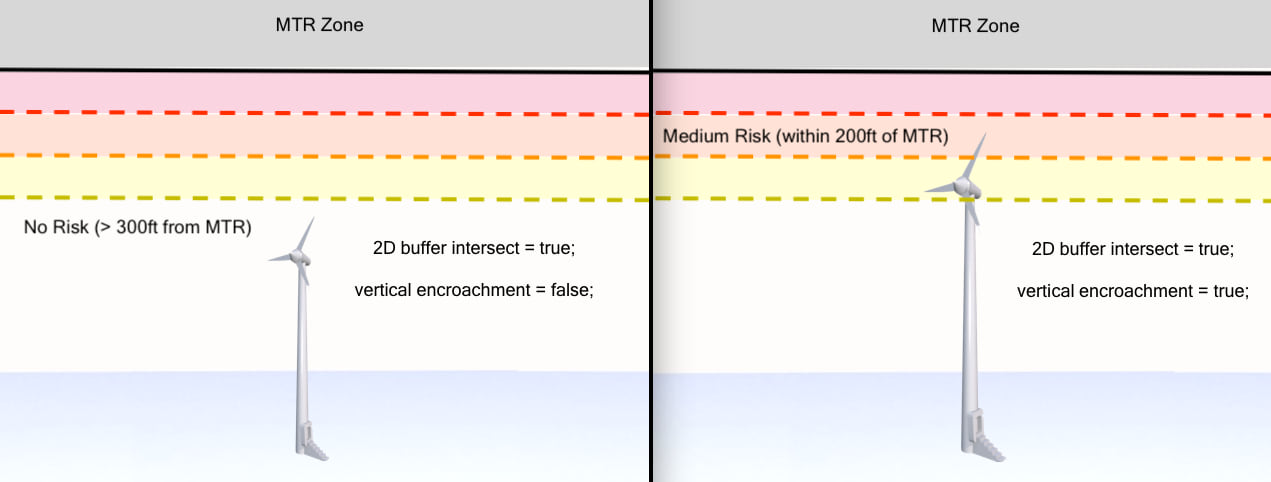
While this is presented as a 3D encroachment analysis, it’s important to realize that we aren’t performing complicated 3D operations such as 3D buffer and intersect. Rather, we create several 2D buffers around the project points, then we check two conditions:
1. Do any of the 2D buffers intersect an MTR?
2. Is the height of the project plus the buffer distance greater than the lower elevation value of the MTR?
If both conditions are true, then the appropriate risk level is returned.
// get geometry from layer and height from UI
const projectGeometry = { /* geom object */ };
const height = 300;

const riskLevels = {
  low: 300,
  medium: 200,
  high: 100
};

let riskLevelBuffers = {};
// buffering outside of renderer function to improve performance
for (let level in riskLevels){
  riskLevelBuffers[level] = geometryEngine.geodesicBuffer(projectGeometry, riskLevels[level], "feet");
}

let classifyFeatures = function (graphic){
  let ceilingValue = graphic.attributes.elvnumcl;
  let floorValue = graphic.attributes.elvnumflr;
  let geom = graphic.geometry;
  let minRestriction = floorValue;

  let risk = "none";  // none | low | medium | high

  for (let level in riskLevels){
    let bufferValue = riskLevels[level];
    let heightRisk = height >= (floorValue - bufferValue);
    let xyRisk = geometryEngine.intersects(geom, riskLevelBuffers[level]);
    risk = heightRisk && xyRisk ? level : risk;
  }

  return risk;
}

let renderer = {
  type: "unique-value",
  field: classifyFeatures,
  uniqueValueInfos: [
    // set high, medium, low colors here
  ]
};

layer.renderer = renderer;
For example, suppose the 200ft buffer intersects an MTR polygon. If the elevation of the lower bound of the same MTR is within 200 feet of that buffer, then the project location is at “medium” risk for encroachment. If just one of those conditions is false, there is no risk for encroachment.
Summary
Hopefully, you now have a sense of how powerful 3D can be for helping your users better understand problems relevant to vertical geography. For example, I could have performed the same analysis and a similar visualization in a 2D app. However, the 2D version of the app would fail to convey the actual space each MTR occupies in the real world. How would you gain any sense of depth without the third dimension?
Also, I hope you walk away inspired with ideas you can use to get started with 3D, even when you are restricted to only using 2D data. With 2D data, you can extrude, use 3D models, and place features in 3D space. You can even attempt 3D analyses. No, we didn’t create “real” 3D buffers and perform a true 3D intersection on that buffer. But we did find a solution that is pretty close and will work for similar use cases. Check out the additional samples below, for more examples of building 3D apps with 2D data.
- Extrude building footprints based on real world heights
- Thematic visualization with realistic 3D symbols
- Visualize features with realistic WebStyleSymbols
- Elevation options
- Using callout lines with labels
- Create a local scene (Render data below the ground)
So get started, and give 3D a try!


Commenting is not enabled for this article.