The September 2021 Map Viewer update has been released! The update includes several key enhancements, such as line charts, layer effects, improvements to OGC support and imagery layer support as well as support for controlling how overlapping features in the same layer are displayed.
Read below to learn more about the latest features and enhancements now available in the new Map Viewer.
Layer effects
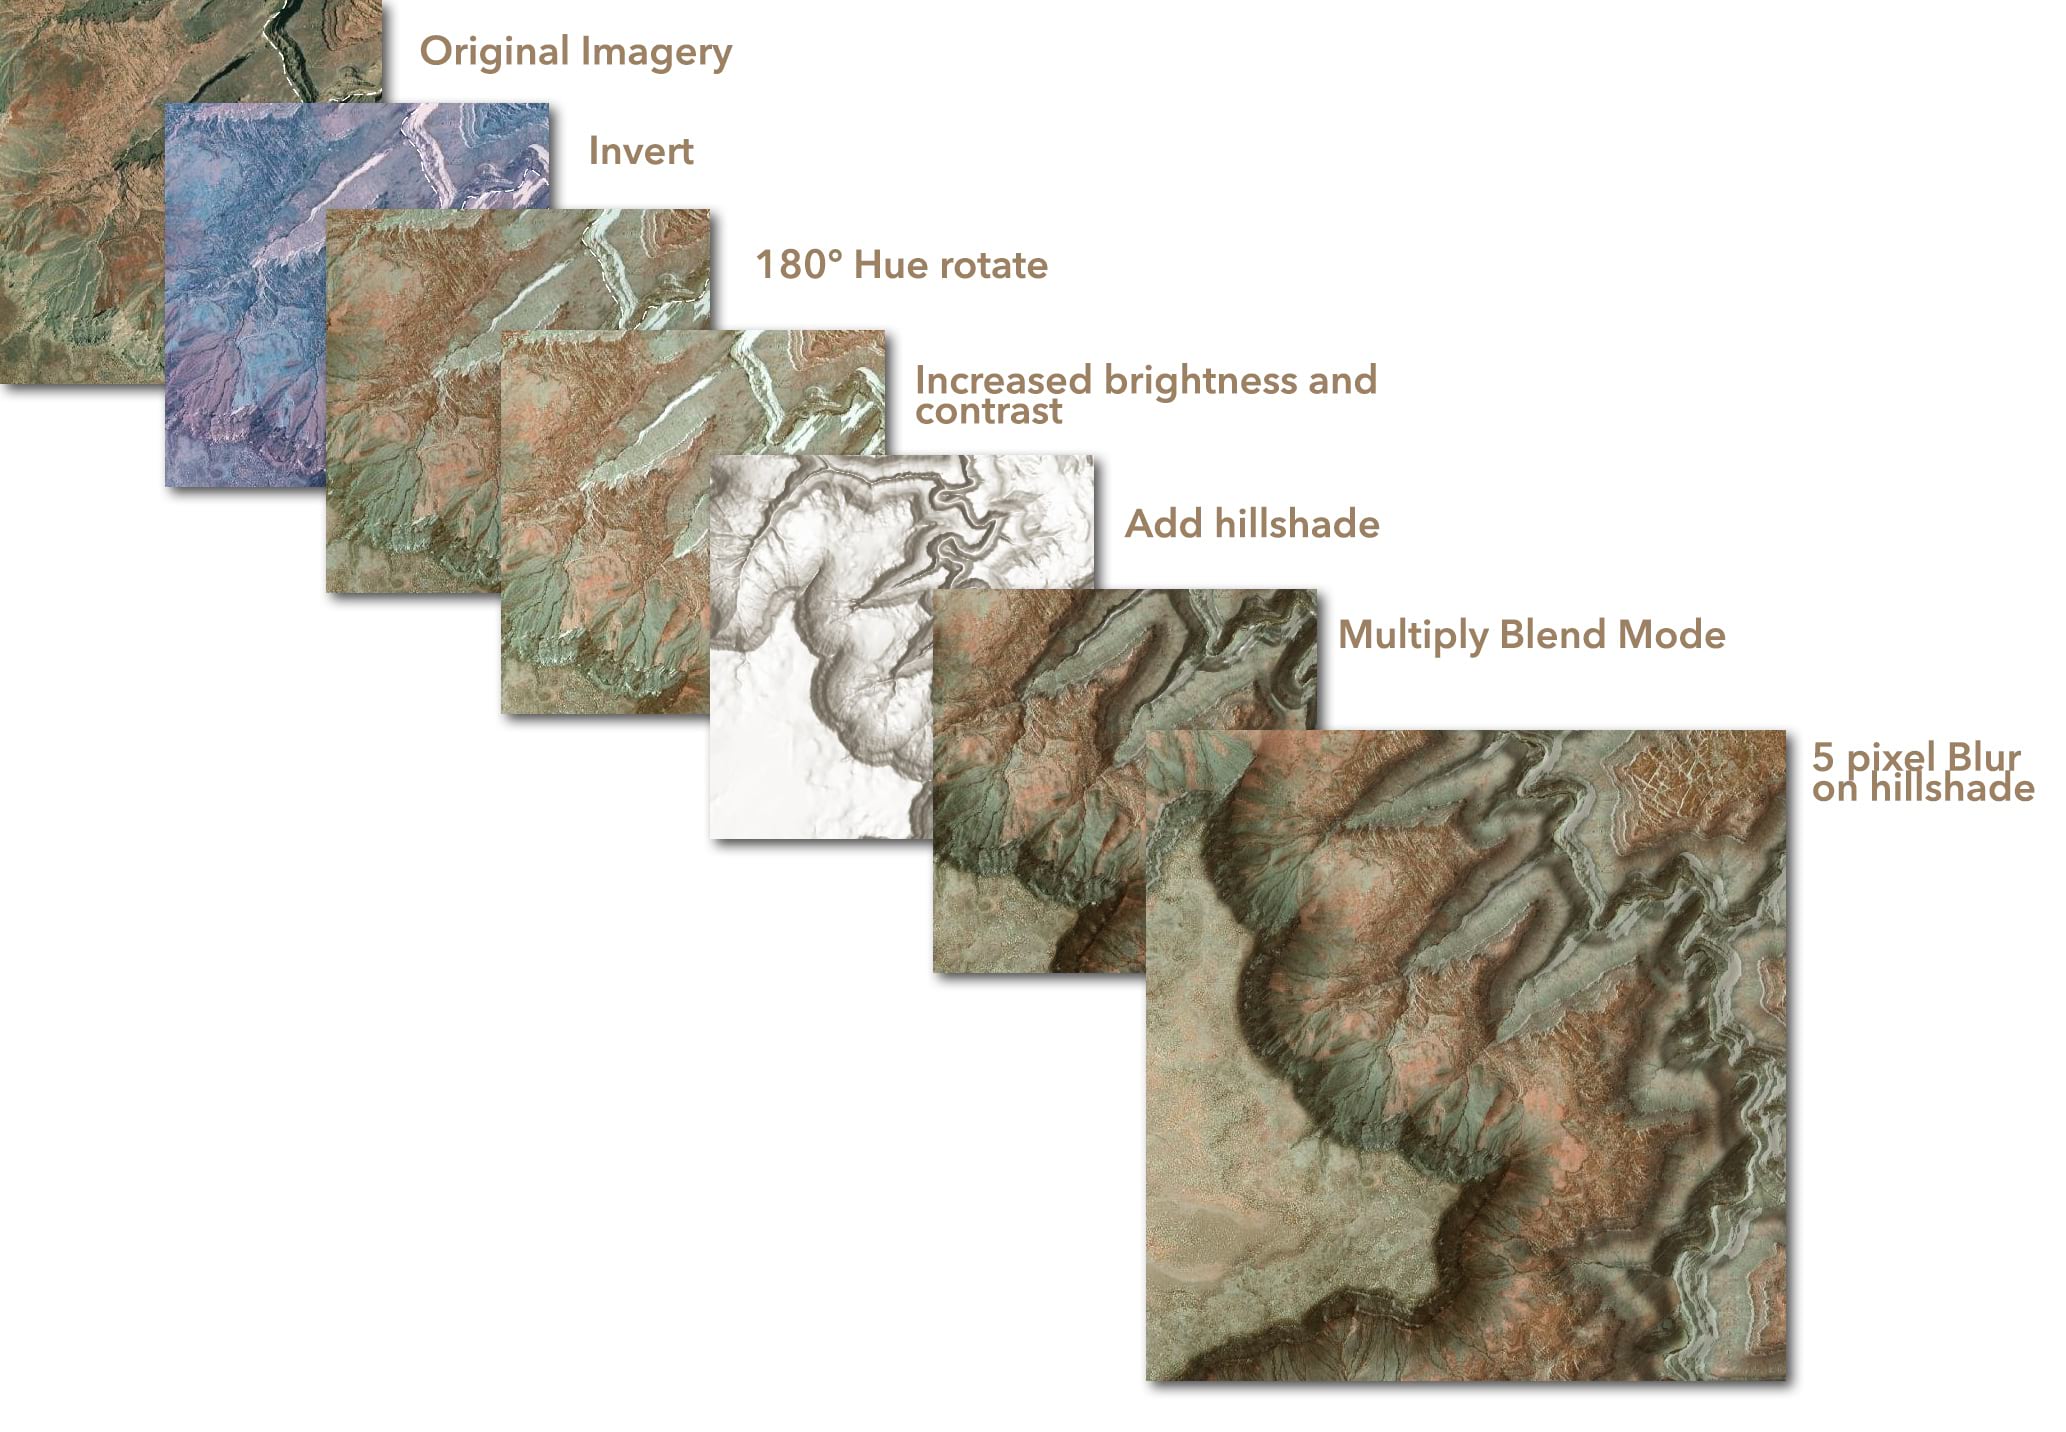
Add dramatic, visual effects to the layers in your map. With effects such as drop shadow, bloom, and blur, you can add cartographic touches to your map that give prominence to overlapping features (bloom), communicate fuzzy boundaries (blur), and many more.

It only takes a couple clicks to get started with something that will wow your audience but the variety of options and combinations offer countless possibilities for you to explore. Whether simply enabling dropshadow to bring focus and depth to features or combining layer effects with blend modes, the latest Map Viewer update makes it even easier to build high quality, eye-catching maps. Check out Effects in Map Viewer and Enhancing imagery basemaps with layer effects to get started.
Charts
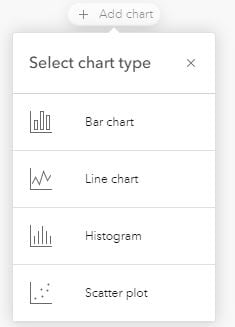
With the September update, line charts are now available in Map Viewer. Ideal for showing change (change over time for instance), line charts join the other chart types supported in Map Viewer – bar charts, histograms, and scatter plots. See Visualize change with line charts in Map Viewer for more info.
Performance improvements
Built on the 4.x JavaScript API, Map Viewer automatically inherits many of the enhancements added to the 4.x JSAPI. With the September update, Map Viewer picked up significant performance improvements for feature layers with many polygons, polygons with complex geometry, as well as maps with many feature collection layers.
Drawing time for these layers has improved by 20% or more in many cases. Check out Performance improvements in version 4.21 of the ArcGIS API for JavaScript for for a deeper dive into the details and more info about other Esri apps that also automatically pick up these enhancements.
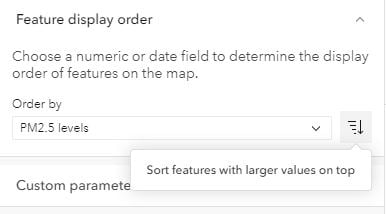
Feature display order
Feature display order allows you to control the display order of overlapping features within the same layer. Using a numeric or date field, you are able to sort the display based on the values in the selected field. You can sort feature display so that the most recent dates display on top (earthquakes sorted by magnitude for instance), or you can sort so that features with the largest value display on top..or the smallest values show on top! With the ability to control how features are ordered, you can choose which overlapping features to emphasize or de-emphasize. Note: overlapping features in different layers are still controlled through layer ordering.
To learn more, check out Overlapping features? Feature Display Order is here to help!
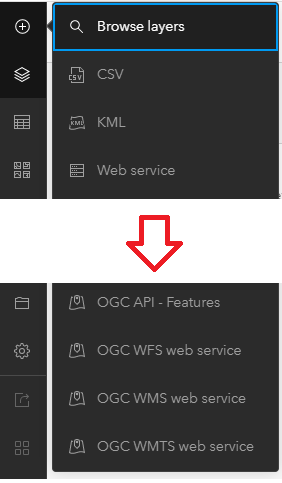
Improved support for OGC layers
In addition to OGC API – Features, you can now add, configure, and save OGC layers such as WFS (2.0.0 with geojson support), WMS, and WMTS. WFS support includes labeling, pop-ups, attribute table, and clustering. Additionally, you can enable pop-ups for WMS layers and and configure layer effects and blend modes for all four OGC layer types. Look for an update later this year to include support for smart mapping and filtering for both WFS and OGC API – Features.
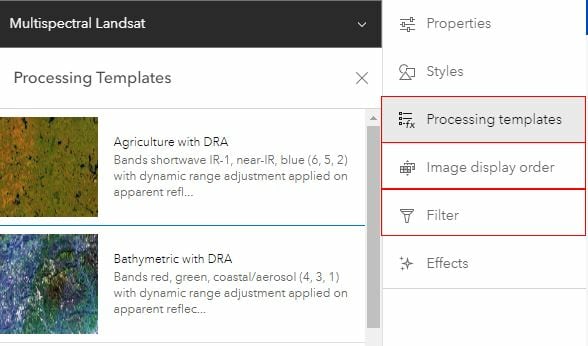
Imagery layer enhancements
The Map Viewer update includes several enhancements for imagery layers as well. Available, from the settings (light) toolbar, you can now configure processing templates, image display order, and filter for imagery layers. Additionally you can view attribute table for imagery layers that support query.
Build floor-aware maps

More resources
- Gain a better understanding of web maps created in the new Map Viewer versus web maps created in Map Viewer classic with web maps and the new Map Viewer.
Participate in the Map Viewer GeoNet space to keep up on news , provide feedback, and join in discussions.

Article Discussion: