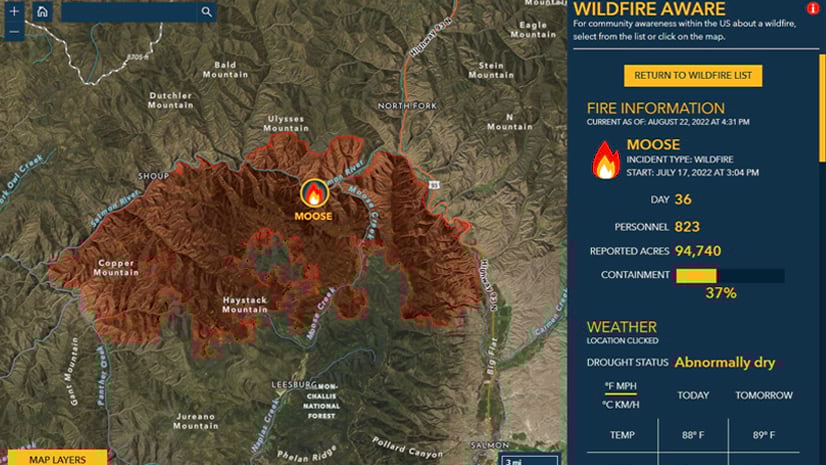
By now we hope you’ve checked out the Wildfire Aware app put together by the Living Atlas team and have bookmarked it to refer to when wildfires are raging anywhere in the USA.

In contrast to other fire tracking apps you may encounter, Wildfire Aware uses the power of geographic analysis to not only show you the progress of a wildfire according to the latest drone flights and satellite sensors, but it also goes in depth and gives context about what might be or have been affected by a wildfire.
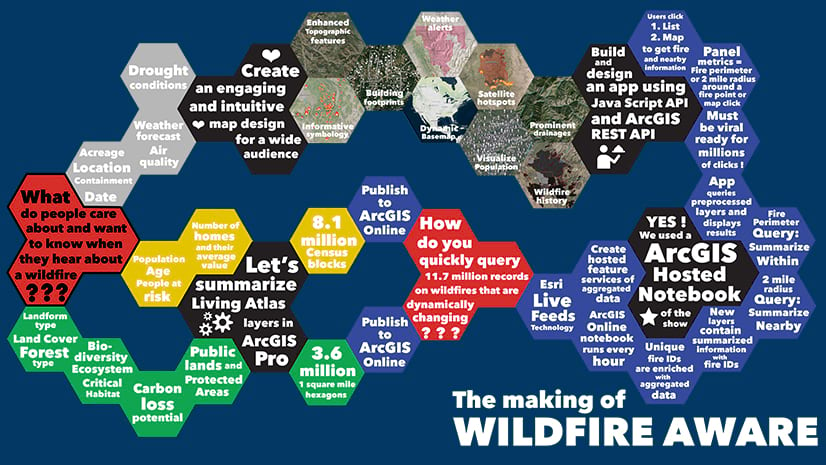
In the past this information only existed within the Wildfire Aware app. Over the winter we had requests from users for the source incident, population, and environment enriched layers. So we have broken those out separately and the layer is now available in ArcGIS Online for whatever purpose you choose! You can use it in your own custom app, keep track of what’s happening in your own state or county, or include it for a purpose we can’t even imagine.
What’s happening in the background is the Wildfire Aware app relies on the automated live feeds technology to routinely enrich and update the fire perimeter every 30 minutes with information from 22 authoritative layers found in the ArcGIS Living Atlas of the World. The map is almost always current and answers important questions such as:
- Fire information such as name, number of incident personnel, and acreage burned.
- Weather information related to temperature, wind, and air quality.
- How many people are over 80? This age group is especially vulnerable to a wildfire.
- Are there other vulnerable people here? How many people are too young to drive? What is the percentage of people who own a car? How many people are not proficient in English?
- How many housing units are there and what is the median housing value in the fire perimeter?
- What percentage of the perimeter is (was) forest? or grassland? If it’s forest, what type of forest is it? How many tons per acre of carbon is it? What ecoregion is it in? Is it in mountains, plains, or tableland?
- How rich is the area with endangered and threatened species? Is there critical habitat?
- What parks, wilderness areas, or tribal nations are affected?

Esri’s Living Atlas and Live Feeds Teams are excited to see what creative solutions the user community will come up with using this new Wildfire Population and Environment Enrichment layer.


Article Discussion: