As Q1 2021 comes to a close, we’re wrapping up our five-part blog series showcasing Business Analyst enhancements from the December 2020 release of ArcGIS Pro. To meet your needs, we set out to improve utility, efficiency, and flexibility with this release.
Recap
Our team has released a series of blogs covering the recent updates to ArcGIS Business Analyst Pro. We’ll recap the last four blogs in the series and leave you with a few final highlights of the December release.
Here’s what will be covered in this blog:
- Arcade expressions – Create trade areas with flexibility and efficiency
- Remove Overlap – New ‘Center Line’ method, Multiple layer support, and access for all ArcGIS Pro users
- Generate Approximate Drive Times – Friction of distance comparison and benchmarking
- Territory Design – Improved spatial indexing for performance gains
- Custom Network Data Source
- Batch Infographics with ArcGIS Pro
Part 1
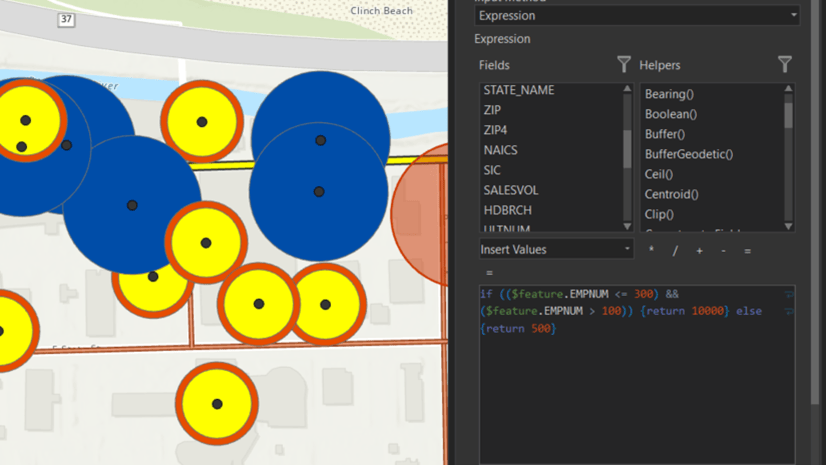
Arcade expressions – Create trade areas with flexibility and efficiency
Apply Esri Arcade expressions to use feature attributes or formulas to determine ring, drive time, or walk time radii distance, time or thresholds. Now supported in Generate Drive Time Trade Areas, Generate Threshold Drive Times, Generate Threshold Rings, Generate Trade Area Rings.
If you’d like to learn more, read our Data-driven trade areas with Arcade expressions blog or watch the video below.
Part 2
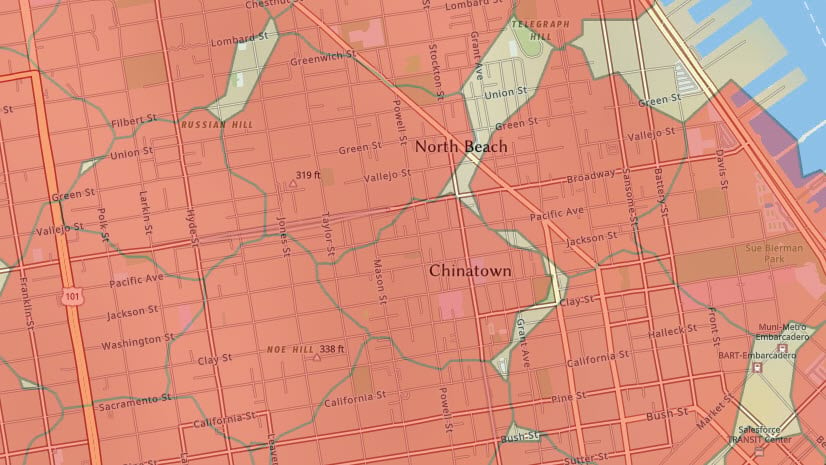
Remove Overlap – New ‘Center Line’ method, Multiple layer support and access for all ArcGIS Pro users
The new Remove Overlap (Multiple) tool has arrived! This allows you to create boundaries between intersecting areas from multiple datasets and output results to a single feature class. The Center Line method reassigns areas of overlap equally between affected polygons. Remove Overlap and Remove Overlap (Multiple) are both available in Business Analyst’s Trade Areas toolbox or ArcGIS Pro’s Analysis toolbox, in the Overlay category.
If you’d like to learn more, read our Exciting updates to the Remove Overlap workflow blog or watch the video below.
Part 3
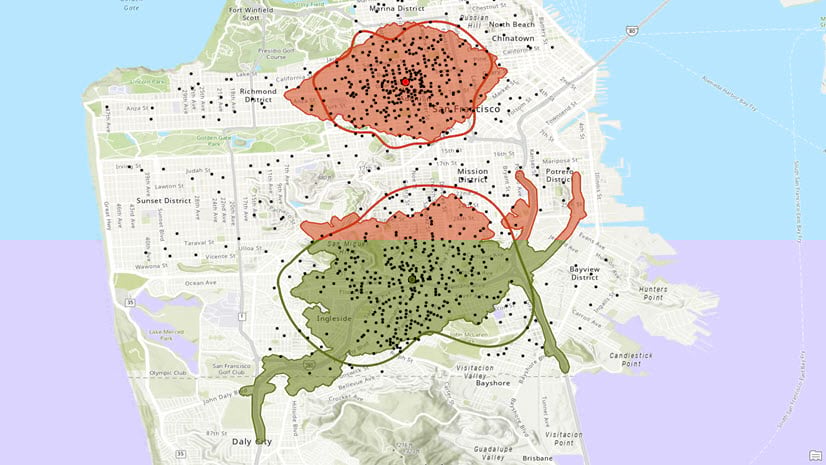
Generate Approximate Drive Times – Friction of distance comparison and benchmarking
Business Analyst users regularly use rings to depict a trade area for a business or organization. The Generate Approximate Drive Times tool offers further insight into the ring and how people move about within it.
If you’d like to learn more, read our Gain further insight about markets using the Generate Approximate Drive Times tool blog or watch the video below.
Part 4
Territory Design – Improved spatial indexing for performance gains
Performance improvements in this release focused on getting territory solutions created faster so you and your teams can focus on balancing, optimizing and making decisions about your territories with greater efficiency. Specifically, processing times for large polygon and point feature classes have been drastically reduced.
If you’d like to learn more, read our Performance improvements for Territory Design blog.
Other Updates
Additional feature enhancements and resources were included in the December 2020 release of ArcGIS Business Analyst Pro — we’ve highlighted some of our favorites below.
Custom Network Data Source
ArcGIS Pro users have spoken, and we have listened. With the December 2020 release, you are now able to use your organization’s custom network source data to power Business Analyst tools. All the powerful features you’re used to are now functional on custom network data sources that might be unique to your business or geography.
Examples:
- Generate trade areas based on your custom public transit network dataset to better understand access to customers, patients, or members via public transit.
- Using a custom street- or road-based network dataset with alternative metrics like fuel consumption or EV battery capacity, instead of distance or time.
Learn more about creating custom network datasets from our Network Analyst team and how to bring them into Business Analyst.

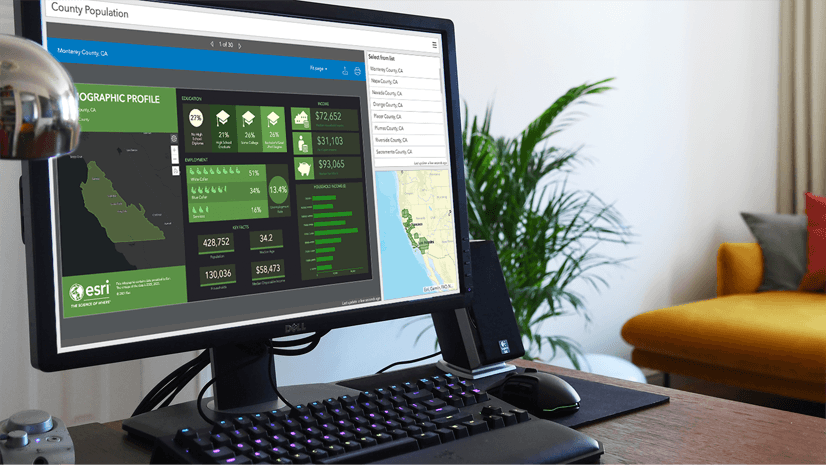
Batch Infographics with ArcGIS Pro
We are often asked how to create infographics like those in Business Analyst Web App using Business Analyst Pro.
As of the December 2020 release, you can now create infographic-style reports using the Summary Reports tool. Follow these short instructions to install the US 2020 Data patch so you can access the templates and start running infographics off of your local data.
Note: This is currently only supported for US local data installations.
Additional Resources
The ArcGIS Business Analyst team is hard at work putting the finishing touches on our Spring/Summer release. Look out for an introduction to what’s coming in the next few weeks. In the interim, please visit use the following links for other information regarding ArcGIS Business Analyst:
- Email the team at businessanalyst@esri.com
- Join our LinkedIn Business Analyst User Group
- Read more Business Analyst blogs at Esri blogs
- Watch Business Analyst videos on Youtube
- Join the Business Analyst places in the Esri Community


Article Discussion: