Urgent care centers provide medical services to patients in need of care that is non-emergency, but that is more pressing than a scheduled visit to a general practitioner. Because it is usually more affordable to visit an urgent care center than to go to an emergency room, and because urgent care centers provide more affordable treatment regardless of health insurance, these facilities are a mainstay for those living in underserved communities.
In this article, you will use suitability analysis in ArcGIS Business Analyst Web App to locate a site for a new urgent care center. You’ll create a point layer of existing center locations to use as a suitability criterion, in addition to demographic variables that approximate a profile of potential urgent care center patients. When you’ve completed the analysis, you’ll create a report to summarize information about the chosen location.
You’ll perform this analysis on block groups in Maverick County, Texas, a county on the southwestern border of Texas. Some quick data exploration using color-coded maps offers some pertinent information: the median household income is low relative to the rest of the state:

And, conversely, the percentage of uninsured people is high compared to other counties in Texas:

This combination of low rates of health insurance and low median income can be an indicator of the need for urgent care facilities in these communities.

You’ll use these two indicators, in concert with many others as explained in the next section, to rank the county’s block groups and find the optimal location for a new urgent care center. By performing a suitability analysis, you can locate the top five areas in Maverick County that are suitable for a new urgent care center.
Perform a suitability analysis
In ArcGIS Business Analyst, suitability analysis allows you to decide which factors are most important to you, then evaluate and rank sites on a map according to these criteria. For this analysis, you will choose criteria related to health and wealth, and rank the block groups within Maverick County to identify the area with the highest need for an urgent care center.
You will begin by creating a new project in Business Analyst Web App. Business Analyst Web App opens to a blank map.
Determine locations for analysis
To start your suitability analysis for an urgent care center in Maverick County in Texas, you first need to identify the locations for the analysis. You will use these locations to gather representative demographics and other data. In this lesson, you’ll use U.S. census block groups, which are subdivisions of census tracts and the smallest geographic unit for which demographic statistics are reported. Maverick County comprises 37 block groups, each with an average of 502 households and a population of approximately 1,600. This distribution makes these block groups an ideal focus for our analysis when determining the service area for an urgent care center.
You will now employ suitability analysis to determine a specific candidate block group for an urgent care center in Maverick County.
On the ribbon, click Run analysis and choose Suitability analysis. The Suitability analysis welcome pane appears, outlining the three steps in the suitability analysis workflow.
- Click Geographies or hexagons to use standard geographic regions (such as states, counties, and ZIP codes).
- Use the Analysis extent search field to search for Maverick County. Selecting Maverick County locks the analysis extent to that area.
- Use the Level of detail drop-down menu to specify block groups as the level of detail for your analysis.

Now that you have selected the sites for the analysis, click Next.
In the next section, you will continue the suitability analysis workflow, selecting and weighting your analysis criteria.
Select criteria
Suitability analysis identifies the optimal sites according to your chosen criteria. In this context, the aim is to identify which block groups in Maverick County are in greatest need of an urgent care center. You will select criteria to reflect this goal. To incorporate these criteria into your analysis, follow the steps below:
- In the workflow pane, add variables from the data browser. Click Select criteria and select Add variables from data browser. Choose the following variables:
2023 Population Density (population per square mile) 2023 Age Dependency Ratio 2023-2028 Population: Compound Annual Growth Rate 2023 Health Services—Businesses (SIC) 2023 Median Household Income 2021 Population w/Income Below Poverty Level (ACS 5-Yr) 2021 Pop <19: No Health Insurance (ACS 5-Yr) 2021 Pop 19-34: No Health Insurance (ACS 5-Yr) 2021 Pop 35-64: No Health Insurance (ACS 5-Yr) 2021 Pop 65+: No Health Insur (ACS 5-Yr) 2023 Important to See Doctor When Sick: 4—Agree Completely 2023 Prefer Urgent Care vs. Doctor’s Office: 4—Agree Completely 2023 Struggle with Health Care Costs: 4—Agree Completely At the top of the Data Browser window, thirteen variables have been selected. Click Apply. In addition to the socio-demographic criteria, you’ll also incorporate a point layer as an additional criterion next.
- Navigate to the Analysis criteria section, click Add criteria, then choose Select criteria and select Add point layer.
Prior to performing the analysis, we created a points of interest layer that integrates data from Foursquare on existing urgent care centers, healthcare centers, and emergency rooms within Maverick County. Similarly, you can leverage points of interest (POI) search to create a comparable layer.

Selecting the point layer automatically adds it to the map. Click Close.
By including Business Analyst points of interest (POI) data mapping existing urgent care center locations, you’ll be able to identify locations currently underserved by such facilities and thus in greatest need of new urgent care services.
Tip: Once you have selected the criteria, you can click Save list to store the selected items under the My lists tab for future use.
Once you have added criteria, the suitability analysis runs automatically, displaying the results in the Results pane. The map ranks the block groups—displayed as color-coded polygons on the map—and adjusts the rankings as you add, remove, or change weights of criteria.

Adjust criteria
You will now adjust the criteria to more accurately match our goal of finding where urgent care is needed the most.
- In the Analysis criteria section, Positive is selected by default for all variables. However, some variables inversely affect the need for urgent care. For instance, as the number of urgent care centers in an area rises, the demand for an additional center decreases. Adjust the following criteria:
2023 Health Services—Businesses (SIC) Click Inverse. Urgent Care, Health Clinics, Emergency Rooms Click Inverse. Then click More optionsand select Count of points.

- In the Weighting section, click Adjust weights. Currently, each criterion is assigned a default weight of 7.14%. The weights for all criteria add up to 100 percent.If you increase or decrease the weight for any criterion, the weights for each remaining criterion automatically decrease or increase proportionately. To keep the weights of other variables unchanged, you can secure the weight by clicking on the Lock button. Set the weights for the following variables to the values specified below and click Lock after each adjustment.
Criterion Weight 2021 Population w/Income Below Poverty Level 10% 2023 Health Services—Businesses (SIC) 10% Urgent Care, Health Clinics, Emergency Rooms 33%

- Once you have modified the weights, click Done.
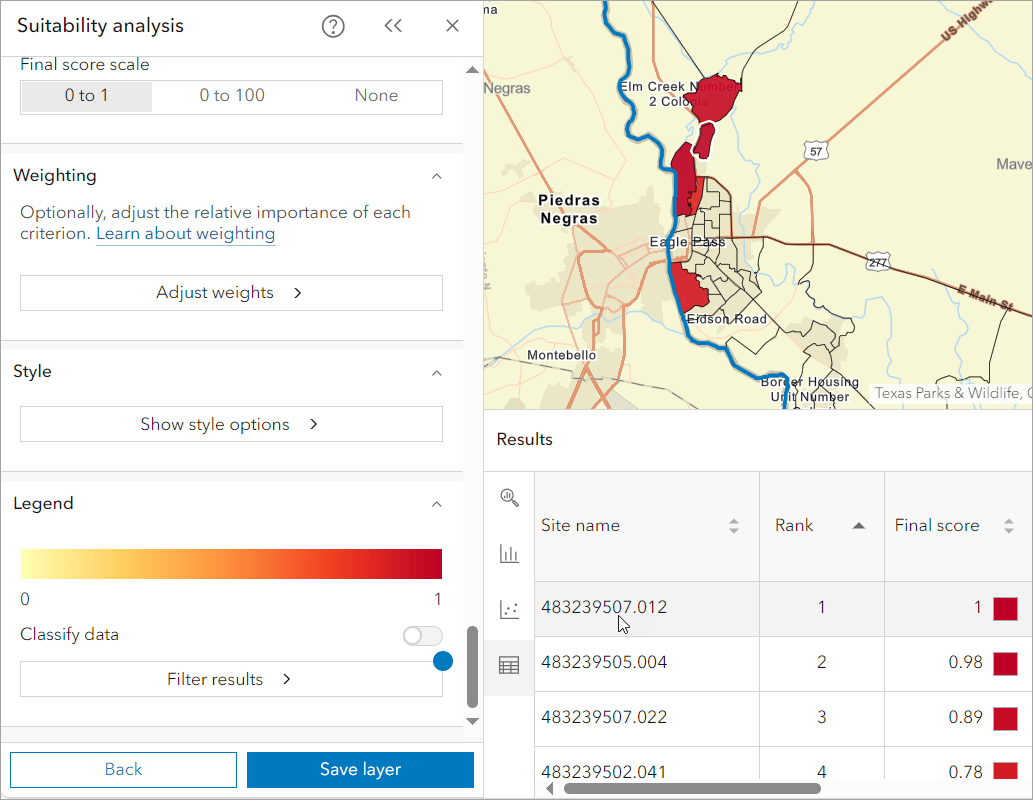
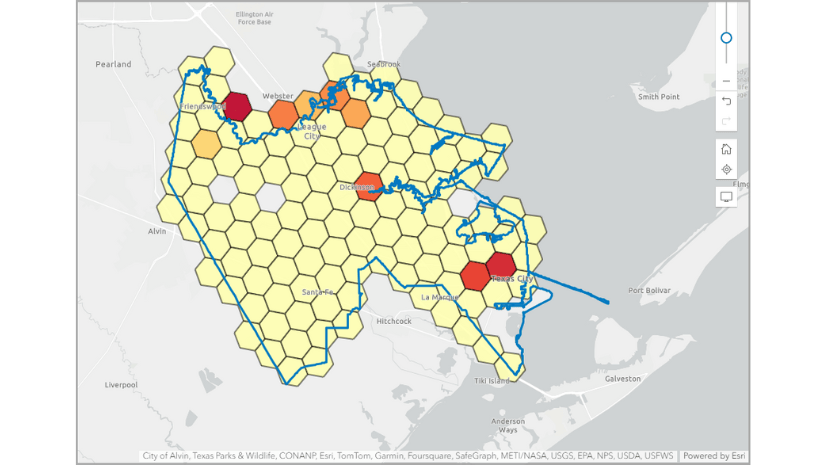
Here is a snapshot of the block groups most in need of an urgent care center, based on our adjusted criteria.

You have conducted your suitability analysis using criteria relevant to identifying a potential area for urgent care need in Maverick County. The results pane now shows that for the 37 block groups in Maverick County, the average final score is 0.43, and it highlights the top 5 block groups that rank the highest.
You can now leverage Business Analyst to further refine your results, allowing for more detailed analysis if needed.
View ranked sites
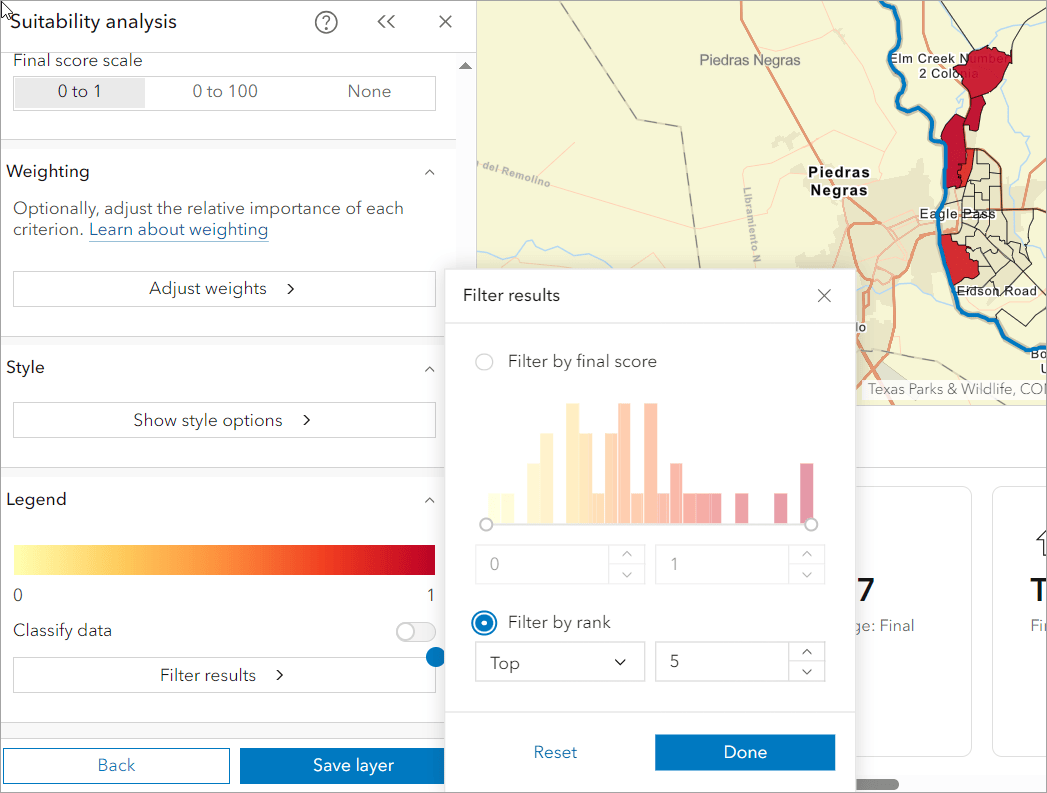
In the Legend section, do any of the following to filter the results:
- Click Filter results.
- Click the Filter by rank option to filter by rank value instead of final score value. The default setting is to rank by the Top 5, and you will keep this setting.
- Click Done.
The map now shows the top five block groups most in need of an urgent care center in Maverick County. To identify the area most in need of an urgent care center, click Table in the Results pane, and then click the Block Group ID that ranks number 1. This area is highlighted on the map.
Generate reports to learn more about the selected area
Your analysis has identified the most suitable block group for a new urgent care location, based on your criteria. To introduce the area to stakeholders, you will create a Key Facts infographic and a Community Profile tabular report. The infographic presents a small set of important information about the chosen block group and is designed to provide immediate insight into block group characteristics. The tabular report provides a more robust set of demographics and is designed for those that want a more in-depth and detailed review of the area.
Create an infographic
In the map, do the following:
- Click the most suitable block group location. A contextual menu is returned.
- Select Infographics from the contextual menu. Your default infographic template runs for this block group.
The drop-down menu on the upper left displays all standard infographic templates from the Business Analyst dataset.
- Select Key Facts from the drop-down and click Run Infographic.
The infographic runs, presenting key demographics of the block group. You will next export the infographic to share it with stakeholders.
To export the infographic, do the following:
- Click the Export infographic button in the upper right corner.

- Examine the available formats but keep the default format, PDF.
- Click the Add header and edit title check box. Title and Subtitle text boxes appear.
- You could change the report title by typing in the Title text box, but you will keep the default.
- In the Subtitle text box, type Most Suitable Block Group.
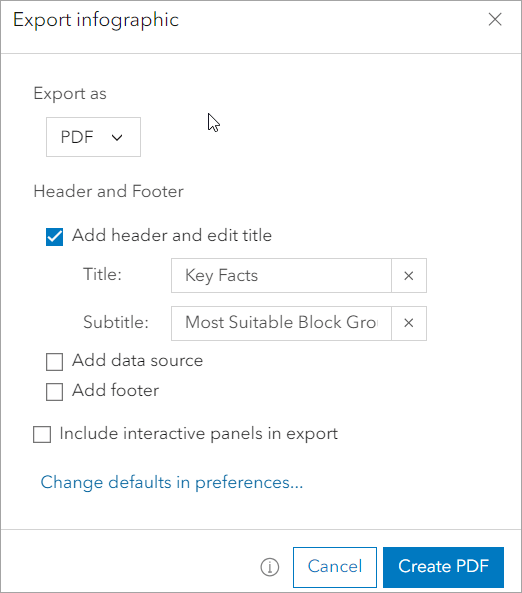
- Keep the rest of the defaults and click Create PDF.
The PDF is created and located in the Downloads folder on your computer.
This infographic template conveys important information about the selected block group. For example, the median household income for the block group is $34,508. This is less than half of the respective value for the United States.
Create a report
With the PDF created, your final wrap-up activity is to create a Community Profile tabular report for the block group identified as most suitable, based on your criteria.
To create the Community Profile report, do the following:
- In the map, click the most suitable block group and, in the contextual menu, select Reports.
- A drop-down menu displays all standard reports from the Business Analyst dataset.
- Select Community Profile, keep the default format of PDF, and click Open report.
The Community Profile report is returned as a PDF and is stored in your Downloads folder.
This tabular format breaks down demographics a bit further for stakeholders interested in a more robust set of demographics for the area.
Conclusion
In this article, you used ArcGIS Business Analyst Web App to conduct a suitability analysis with the goal of identifying the most critical location for an urgent care center in Maverick County. By integrating demographic data and mapping existing healthcare facilities, you highlighted key areas that are underserved in terms of urgent care. This analysis not only revealed where the demand is highest, but can also guide your decisions on where to establish new urgent care centers for optimal community service. These findings underscore the value of using suitability analysis for informed strategic planning in healthcare, ensuring that resources are directed to where they are most needed.


Article Discussion: