ArcGIS Business Analyst helps you make smarter decisions for market planning, site selection, and customer segmentation. You can use ArcGIS Business Analyst Web App to help you identify under-performing markets, pinpoint the right growth sites, and find where your target audience is located through our web platform or mobile app. If you’d like to learn more or want to try ArcGIS Business Analyst Web App, sign up for a free 21-day trial.
The first ArcGIS Business Analyst Web App, ArcGIS Business Analyst Mobile App, and ArcGIS Community Analyst release in 2023 is here! This new release comes packed with updates, enhancements and new features. You can start using this updates and enhancements today!
Below is a full list of our updates in the February 2023 release:
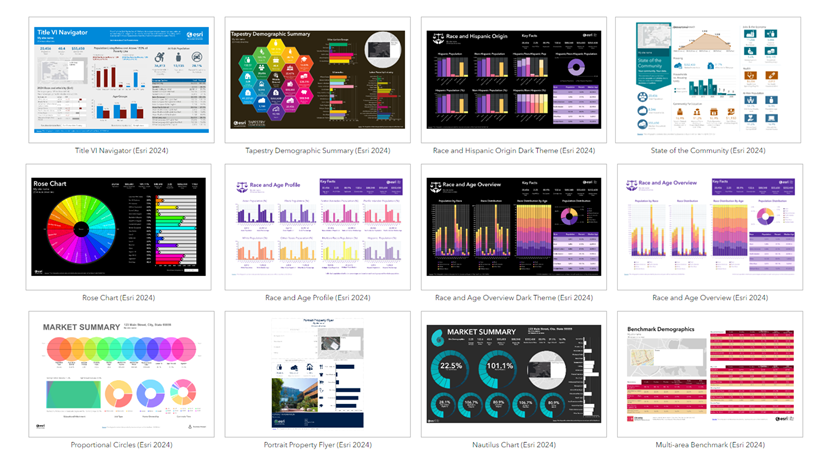
- New infographic templates available in the infographics gallery
- New data browser search option
- Data enhancements
- ArcGIS Experience Builder: Business Analyst widget enhancements & improvements
New infographic templates available in the infographics gallery
New: Civilian Labor Force Profile infographic
The interconnections between various industries and worker types underscores the significance of comprehending the job market mix. With this in mind, we crafted the Civilian Labor Force Profile infographic to offer insights on employment and labor force indicators, based on the latest American Community Survey (ACS) data and local area unemployment statistics.
This two-page visual is loaded with valuable information, including selected demographics, occupational classification, employment statistics, labor force measures, and unemployment information. The infographic can answer your questions about the nature and types of jobs, how income and pay are distributed, and how these relate to other demographic and segmentation factors.
We also include a location quotient (LQ) index, which compares the job market to the expected number of jobs based on the national average. This index allows users to identify which industries and job types contribute the most to the local economy. For instance, an industry with an LQ of 2 indicates that it has 100% more jobs than the national average, making it critical to the local economy and potentially linked to other industries, such as the services sector. On the contrary, an LQ below 1 highlights opportunities for economic growth by creating new jobs. A balanced job market with a diverse mix of occupations and high LQ is crucial for the long-term stability and prosperity of a community.
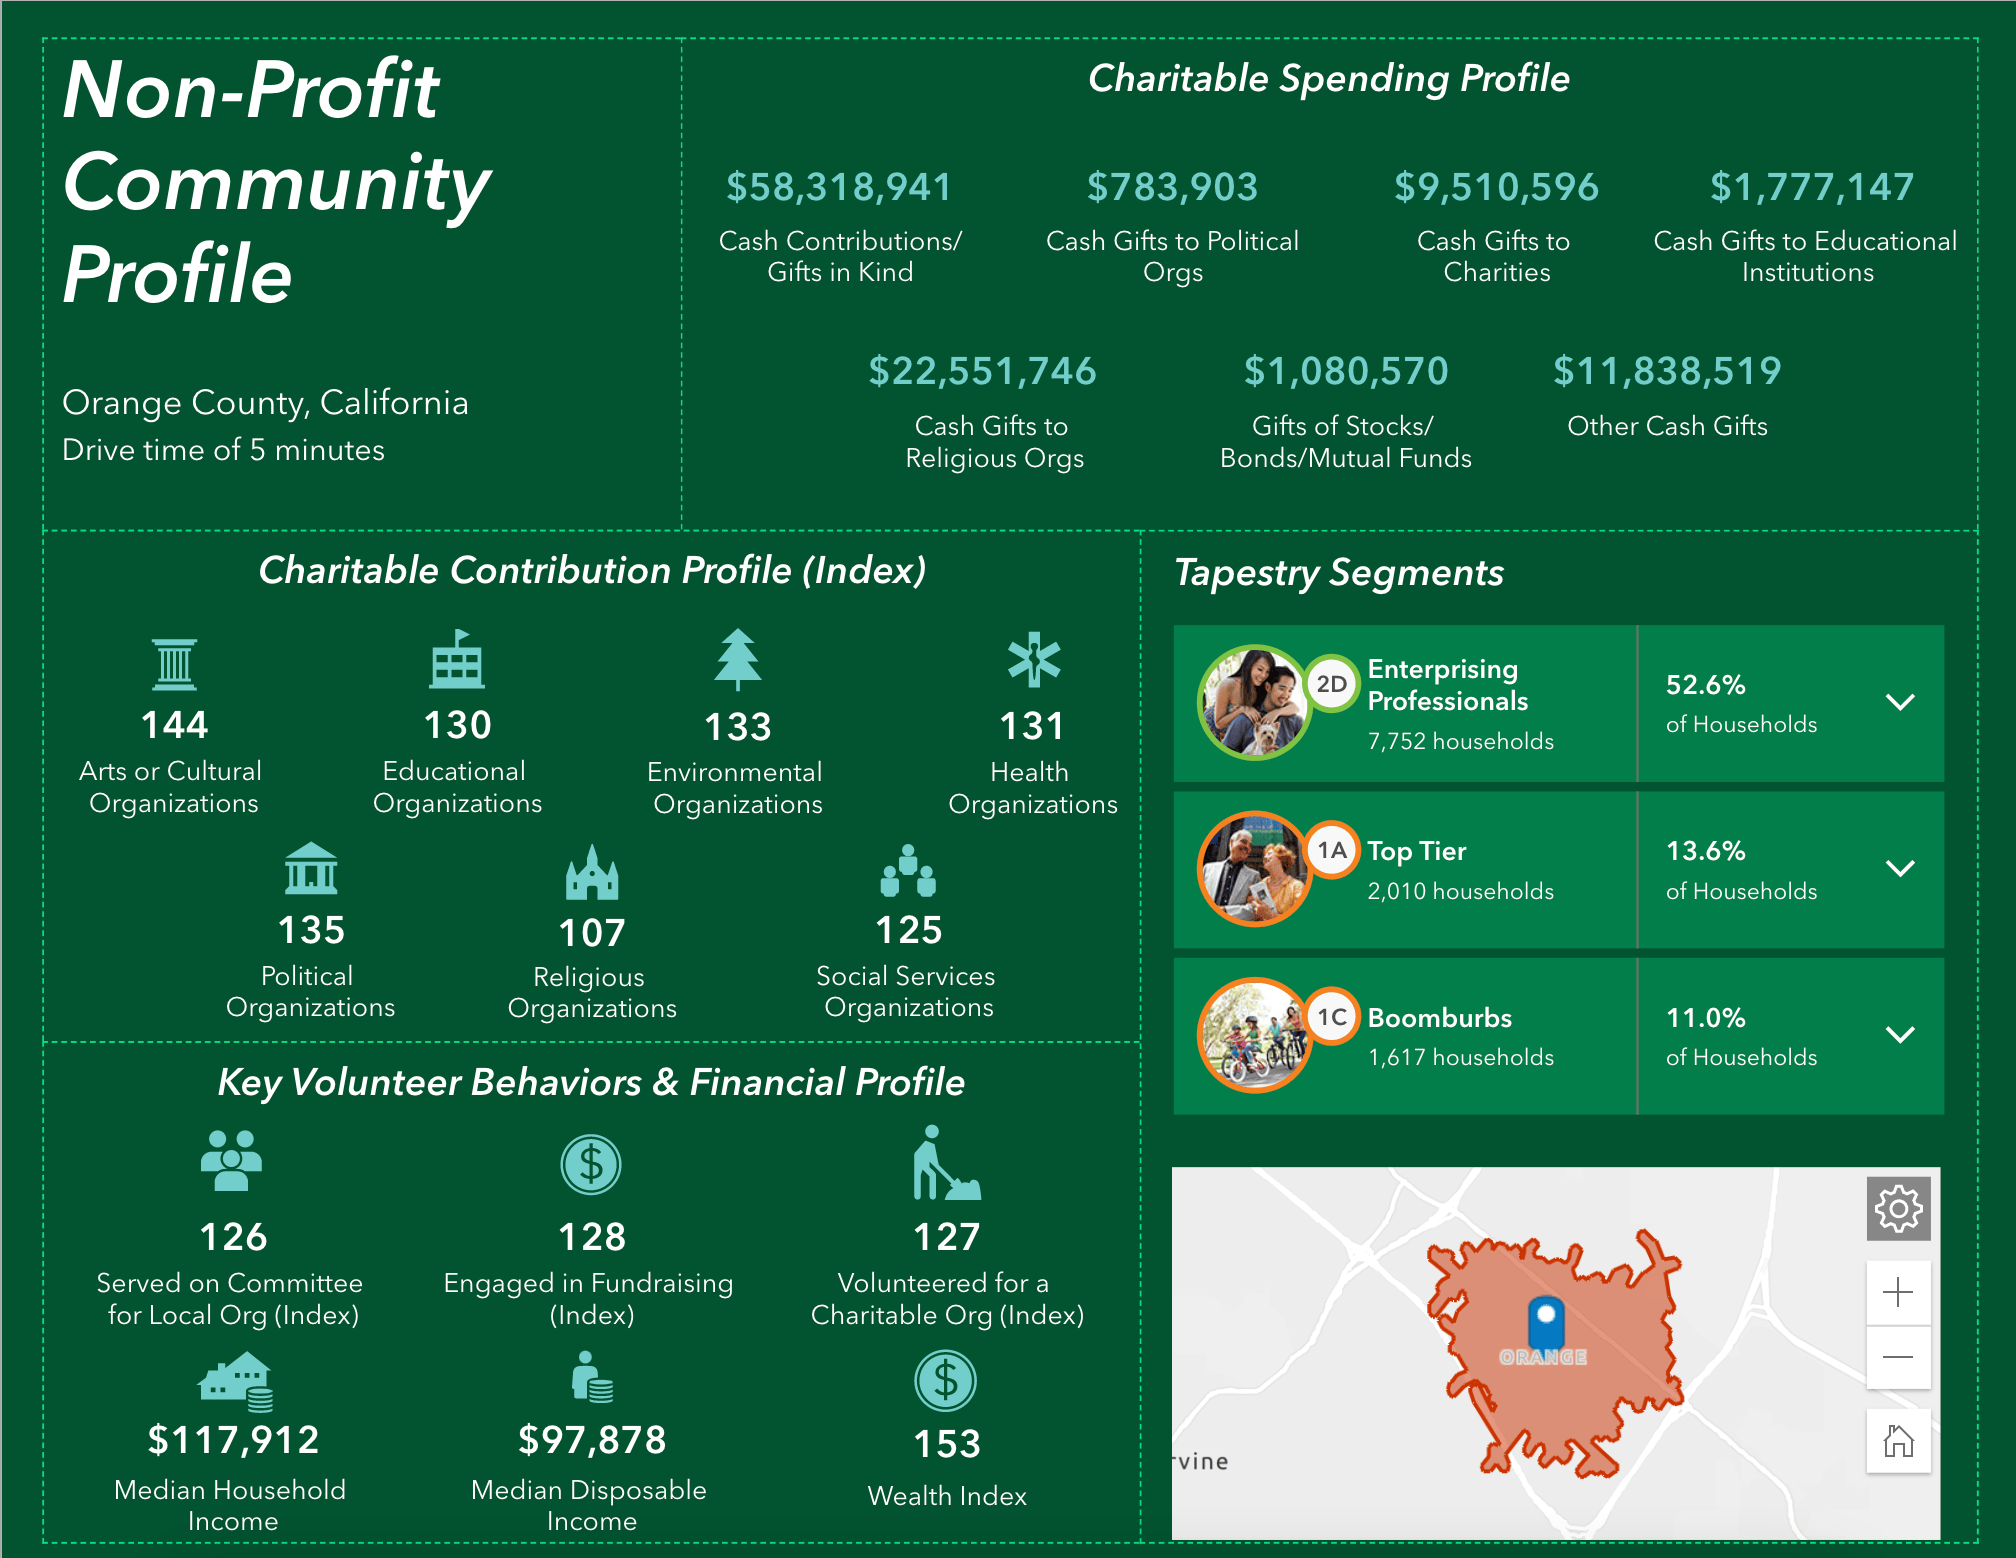
New: Non-Profit Community Profile infographic
Exciting news for nonprofit organizations! Our infographics gallery now includes a new template: Non-Profit Community Profile. This infographic is designed to help you navigate the crucial aspects of nonprofit development, including fundraising, building a strong team, and raising awareness. With this new addition, we aim to provide you with valuable insights that will empower you to make informed decisions and drive success for your nonprofit organization.
The Non-Profit Community Profile template is composed of four distinct sections, each of which can assist in answering various questions:
- Charitable Spending Profile: This section highlights the types and amounts of donations being made in a selected location.
- Charitable Contribution Profile: This section reveals the community’s level of generosity and priorities regarding the causes they support.
- Volunteer and Financial Behaviors Profile: This section showcases the community’s willingness to volunteer or serve in key leadership positions.
- Tapestry Segments: This section uses market segmentation to categorize U.S. neighborhoods based on their behavior, enabling you to target potential donors, volunteers, or specific causes they are passionate about.
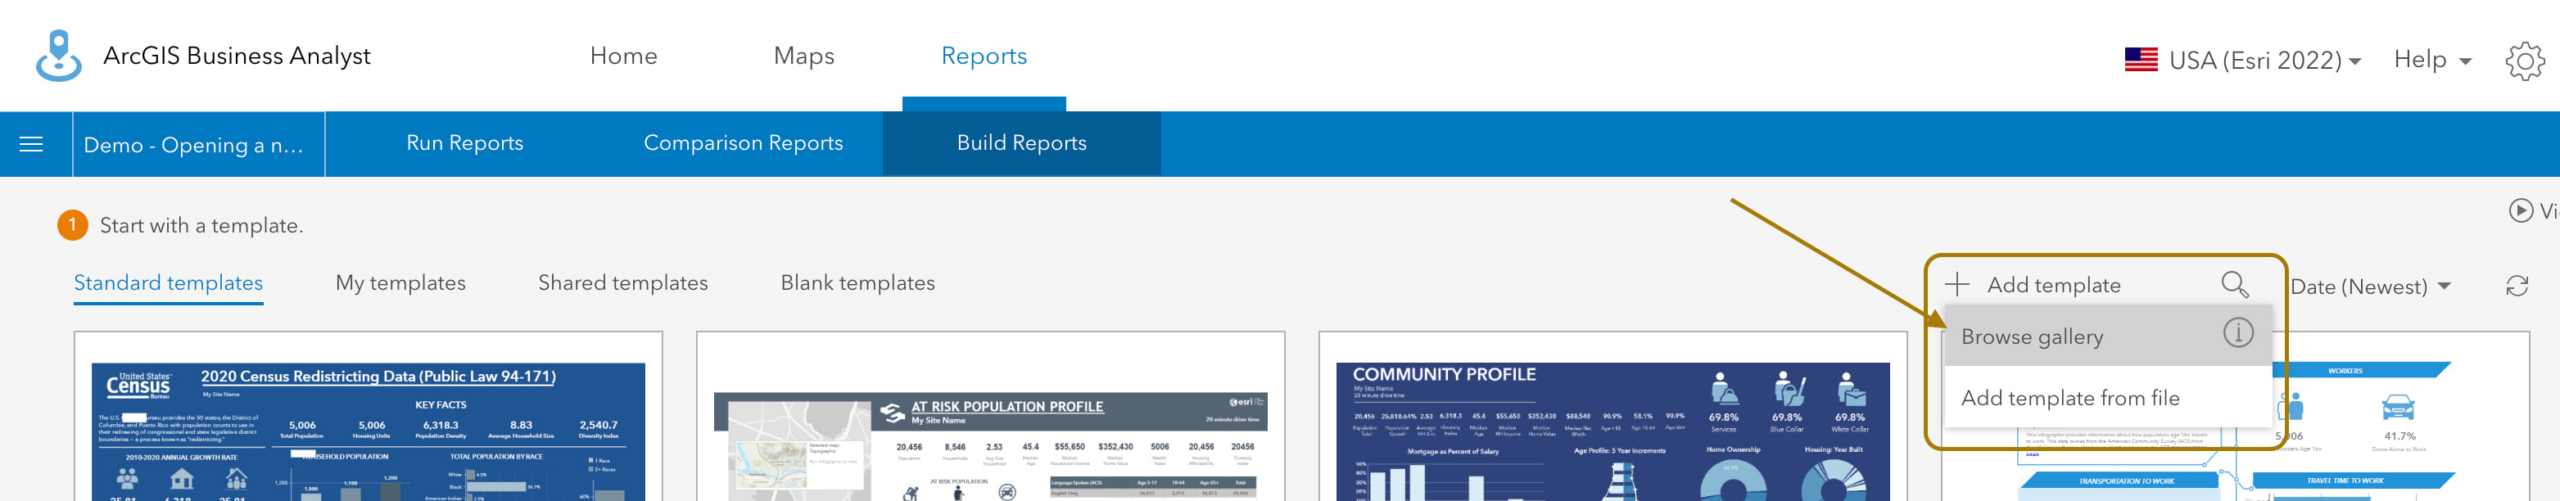
How to gain access to these templates
At this time, the new templates will only be available to users with an Advanced license and that both are USA infographics. You can access the infographic templates in Build Reports > Build infographics > Add template > Browse gallery. Mouse over the template and click the Add button. The template will be saved and added on your My templates tab, where you can run the infographic or make edits and design changes as desired.
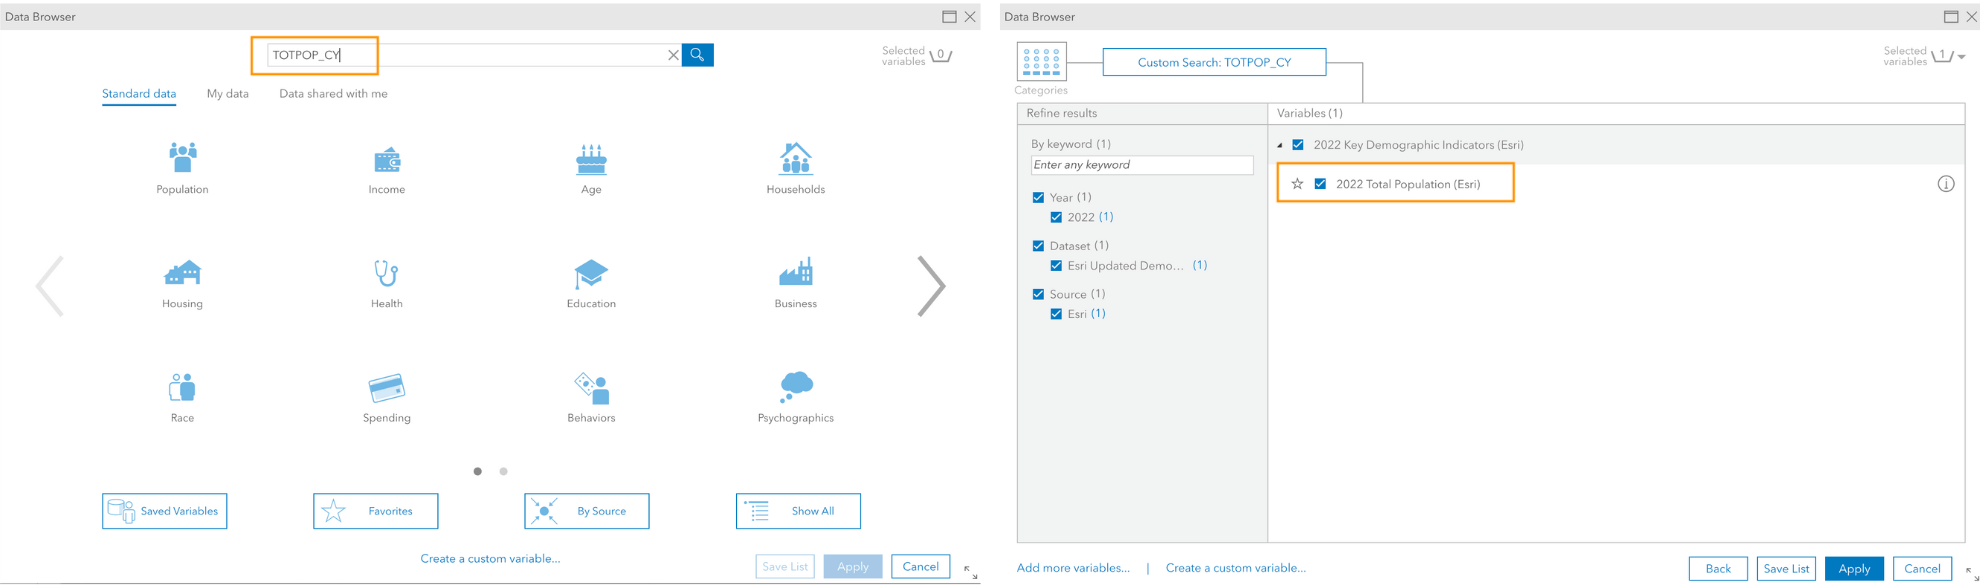
New data browser search option
The data browser now includes a new search option. In addition to search terms, you can now search for variables using the Variable Identifier (ID). This upgrade will be particularly useful for users who rely on the Census Variable Identifier in their research. Our aim is to enhance your productivity by offering this new search function.
You can access the most up-to-date data variable list by visiting Esri Updated Demographics.
For example, if you want to find the total population data, simply enter the Variable ID “TOTPOP_CY” in the data browser search bar. The variable will then be displayed and ready for use in mapping, analysis, and reporting.
Data enhancements
We are excited to announce the following data updates for ArcGIS Business Analyst Web App, Mobile App, ArcGIS Business Analyst Pro using Online data, and ArcGIS Community Analyst:
ACS updates for USA and Puerto Rico
Esri provides the U.S. Census Bureau’s American Community Survey (ACS) data for the United States and Puerto Rico. ACS uses a continuous measurement (or rolling) sample, in which a small percentage of the population is sampled every month. This release contains the annual update to the ACS datasets, which is the 2017-2021 ACS estimates, five-year period data collected monthly from January 1, 2017, through December 31, 2021, for variables such as household population, school enrollment, poverty, and housing units’ year built.
Global data updates
We also updated the following global data in the February release:
- Michael Bauer Research data (from 2021 to 2022) for 21 countries and regions
- Crime indexes from Applied Geographic Solutions (AGS)
- Global points of interest (POI) data from Foursquare
- Business data from Data Axle and SafeGraph
Please find more information about the data updates in What’s Coming in Esri Demographics (Feb 2023).
ArcGIS Experience Builder: Business Analyst widget enhancements & improvements
The Business Analyst widget in ArcGIS Web AppBuilder is a widely popular and well-loved tool that provides users with the ability to view additional information about any point or polygon feature on a map through the creation of reports and infographics. In order to preserve this valuable experience, we have brought the Business Analyst widget to ArcGIS Experience Builder, the next generation of ArcGIS Web Appbuilder. Our goal is to ensure feature parity for users who are transitioning to ExB and also looking for new functionalities to create amazing apps.
The Business Analyst widget in ArcGIS Experience Builder (formerly known as BA Infographic widget) will be out of beta in the upcoming release. Thanks to the insightful feedback we received from beta testers, we discovered that some users require an interactive location search function for their end users. As a result, we have introduced a new Workflow mode to enhance the user experience. Moreover, we added so many customizable options and support interactions with other ExB widgets.
The widget now has two modes: Preset mode and Workflow mode
Preset mode
This mode allows the app creator to predefine a specific site and a specific infographic for the end user. End users can use the app to view infographics prepared by the app creator. The preset mode also supports interactions with other widgets, for example Map widget, to allow the user run the preset infographics on different sites.
Workflow mode
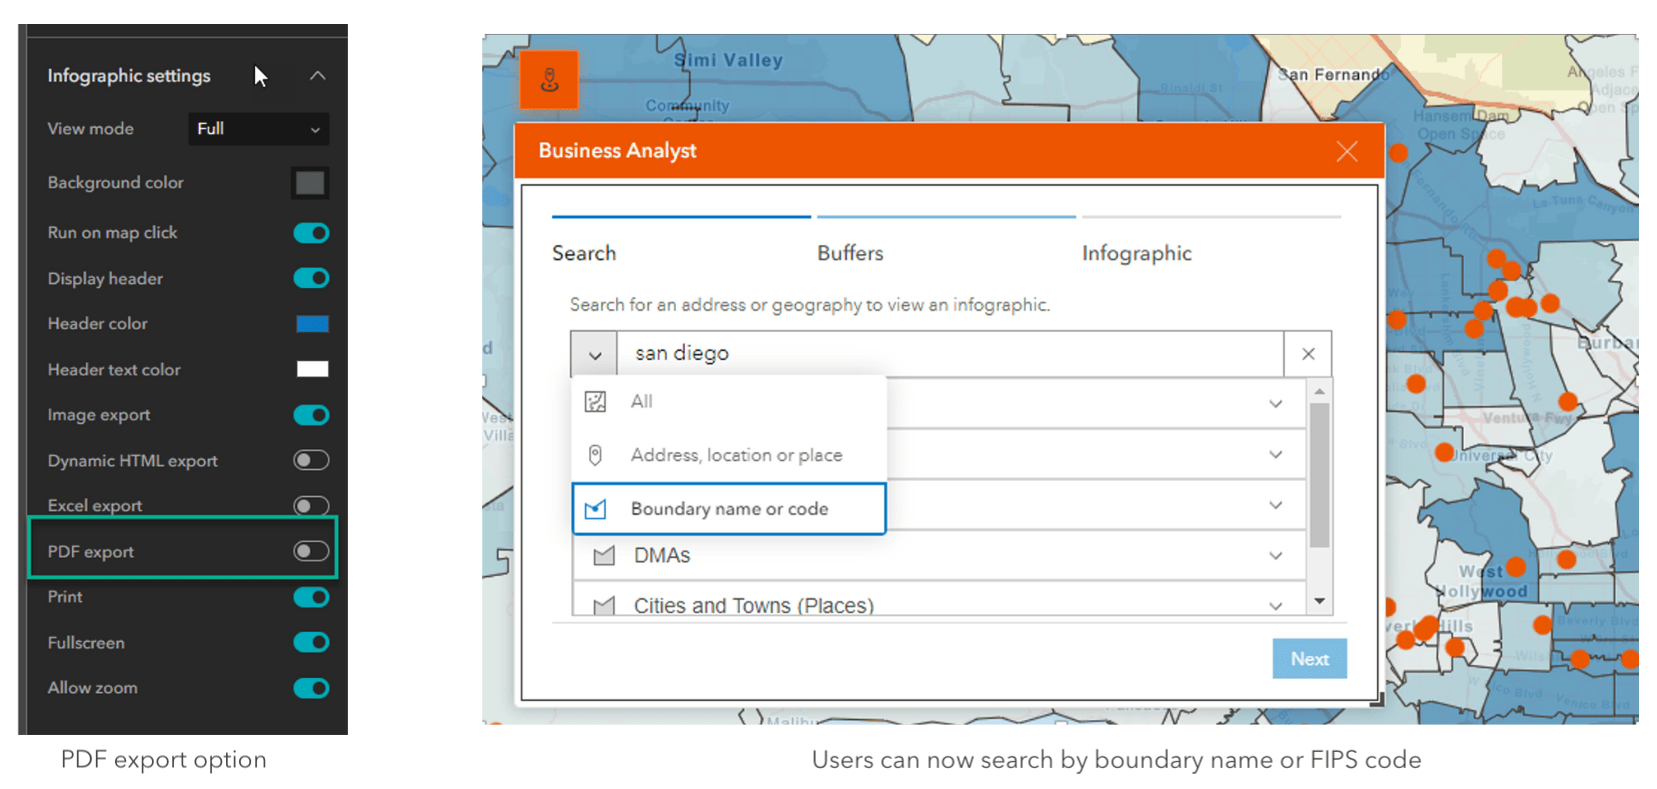
This mode allows the app end users to search for a POI/geography boundary, create buffers based on a selected area, and run infographics from the available list. App creators have full control of the end user experience for every step of the workflow. They can customize the search, buffer, infographics, and export options that are available to their end users. This new mode enables creators to set up an infographic-generating app for their end users.
Users can now search by geography name or FIPS code in the workflow mode. We also added support for exporting the infographics to PDF for both modes if the app creator allows it.
Business Analyst widget enhancements
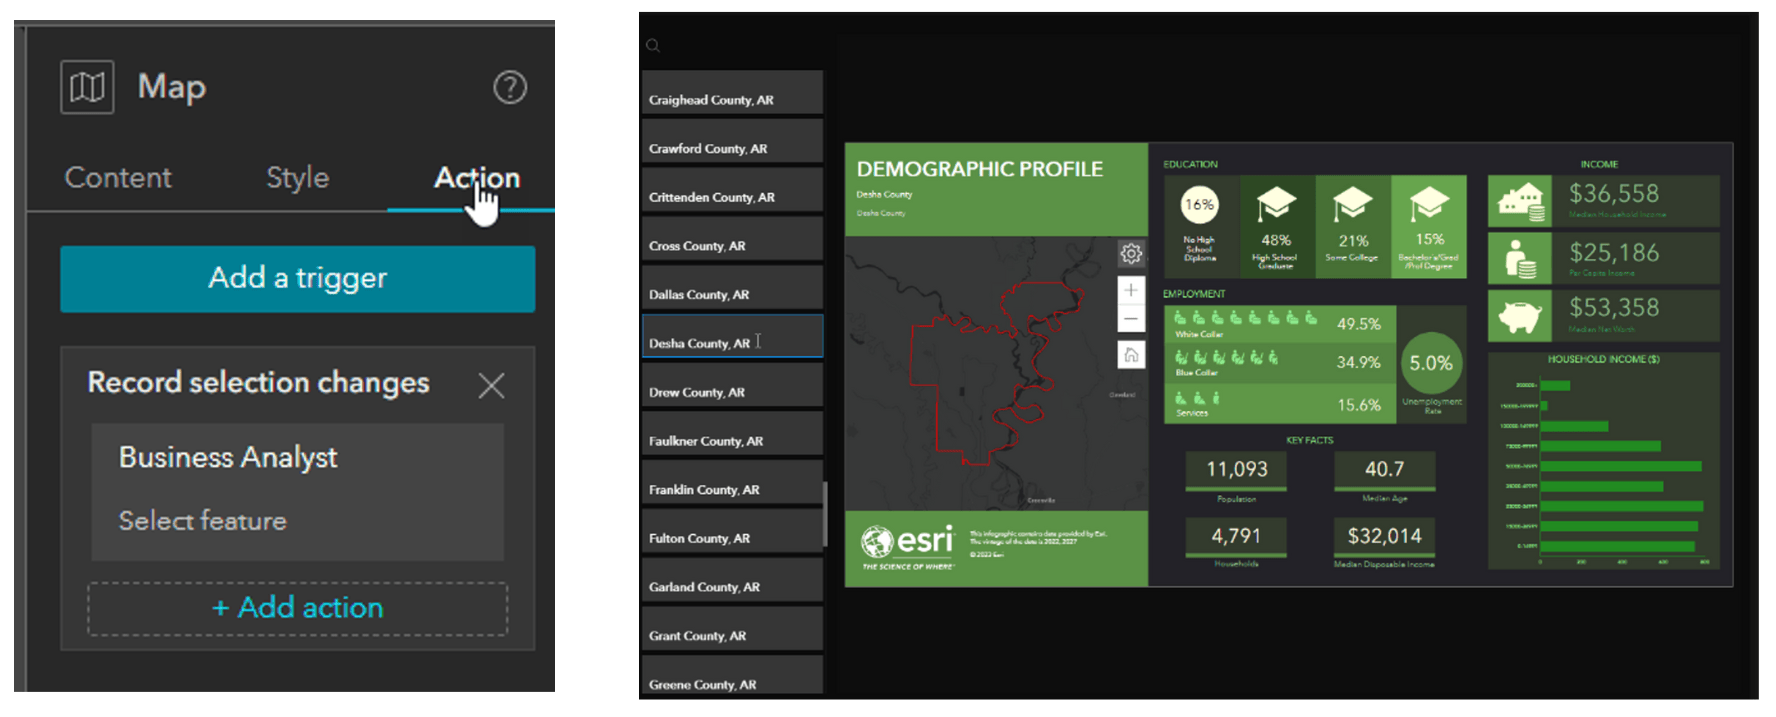
In this release, we added action triggers to the Business Analyst widget’s functionality, which makes it extremely powerful. The Business Analyst widget now works with multiple widgets that support feature/record selection (Table, List, Query, Map, and Search widgets). When a point or polygon feature is selected, you can run infographics using that input feature. For example, you can now build an Experience Builder app with a List widget that shows a list of counties from your feature layer, and then interactively run infographics on each feature by clicking items in the list.
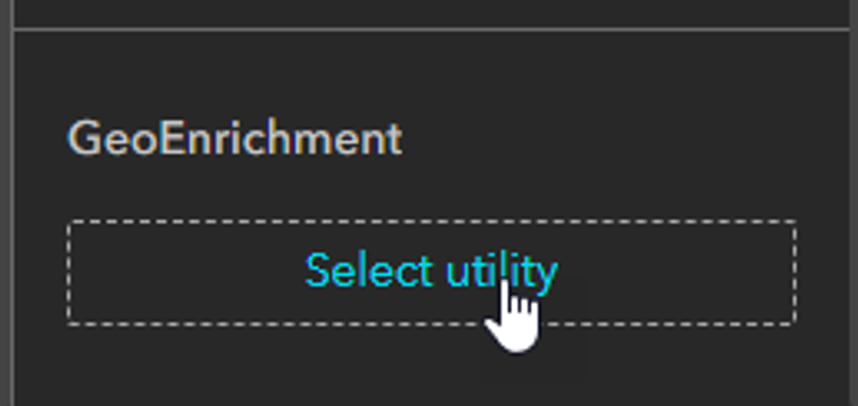
Additionally, we incorporated the GeoEnrichment proxy (subscriber content) to broaden accessibility of the widget to a wider audience who may not have the necessary privileges (GeoEnrichment and Network Analysis). By doing so, ArcGIS members, with viewer and editor roles/user types, will now be able to use the widget when the app is configured and shared within the organization. Note: the widget deos not support public sharing for this release.
NOTE: If you have previously created an ArcGIS Experience Builder app with the BA infographic widget (Beta), you will need to make some edits to support the new functionalities. Otherwise, your old apps might appear broken. We will provide the specific steps necessary to make sure your apps continue to work.
For additional information on the Business Analyst widget in Experience Builder, head over to the below blog articles:
- The Business Analyst Widget in Experience Builder is coming out of beta with great new features.
- Important changes to Experience Builder apps with Business Analyst Infographic (beta) widget.
Additional resources
We hope you find the enhancements of the February 2023 release helpful. Additionally, please visit the following sites for more information on ArcGIS Business Analyst:
- Business Analyst product overview page
- Review pricing and purchase Business Analyst
- Join our LinkedIn Business Analyst User Group
- Join our Business Analyst Esri Community
- Read more Business Analyst blog articles on ArcGIS Blog
- Watch Business Analyst Web App videos
- Watch Business Analyst Mobile App videos
- Visit the Business Analyst Resources page


Article Discussion: