The June 2020 release of ArcGIS Business Analyst Web and Mobile Apps has arrived just in time for the Esri User Conference! Highlights of this release include the ability to run multiple infographics for multiple areas at the same time (what we call Batch Infographics), add normalization variables such as population or consumer expenditure to Void Analysis, use standard geographies in Custom Data Setup, new infographic report templates and more. There are many new features in this release (link at the bottom of this blog), but I’m only going to focus on a few of my favorites alongside and the 2020/2025 Esri US Demographics Data updates.
Here are the June 2020 updates that will be highlighted in this blog:
- Batch infographics
- Void Analysis normalization
- Standard geographies in Custom Data Setup
- Enhanced map reports
- New infographic report templates
- Customizable “My Facts” tab in Business Analyst Mobile
- 2020/2025 Esri US Demographic Data updates
Batch Infographics
In the March 2020 release of ArcGIS Business Analyst Web, we introduced side-by-side comparisons to view a single infographic for up to ten areas. Now you can run multiple infographics for multiple areas at once, then export up to 100 at a time as a zip file. With this feature, we’ve also included an Export toggle option so you can export your infographics without having to first run them individually.
For example, imagine you created an infographic for your retail business that spans across many stores. You could first run a single infographic to review information for all of your stores, then turn the Export toggle on and click the “Export All” button to run infographics for each of your stores.

Void Analysis Normalization in ArcGIS Business Analyst Web App
Void Analysis gives you the ability to analyze areas to identify gaps compared to a reference area. In the past, the data used was limited to businesses and services. In this release, we’ve added normalization variables, such as population, households, or consumer expenditure. Adding normalization variables provides additional context to determine if a true gap exists, or if there are simply fewer identified businesses because fewer people live or work in the area.


Standard Geographies in Custom Data Setup
There is a new Add Data option in the Custom Data Setup to let users configure data as standard geographic boundaries. This option allows you to set up layers as standard geographic boundaries, such as county and state. These layers can be combined in Business Analyst Web with Esri data in infographics, reports, and analysis workflows.

Enhanced Map Reports
Your exported PDF map reports have never looked better. With a new and improved appearance, you can now generate professional-quality map reports using vector basemaps for better detail and higher resolution directly from Business Analyst Web App.

New Infographic Report Templates in ArcGIS Business Analyst Web App
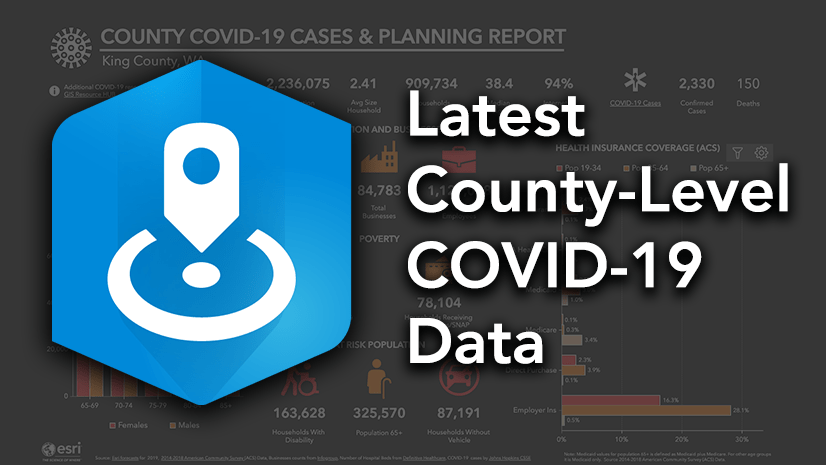
There are many new infographic templates that are now available in Business Analyst Web App with this release. Two of my favorites are the Coronavirus (COVID-19) Impact Planning Report and the Race and Age Overview. These two infographic templates are both informative, including data such as population with no health insurance and population distribution, and visually stunning.


Customizable “My Facts” tab in Business Analyst Mobile
In ArcGIS Business Analyst Mobile, the “Standard Facts” tab shows key demographic facts that pique the interest of many Business Analyst users, but the variables included on this tab cannot be modified. With this release, we’ve introduced a “My Facts” tab that is populated with a list of facts you select. You can add and remove variables from the data browser, data added to Business Analyst Web App, and data shared with you in your organization.

2020/2025 Esri US Demographic Data Updates
With this release, the updates made to Esri’s United States demographics and data are now available directly in ArcGIS Business Analyst Web App. The June 2020 release includes Esri 2020/2025 demographic forecasts including U.S. population, income, households, consumer spending, Tapestry Segmentation, and more.
The following are the data categories that have been updated:
- Population
- Age by sex
- Race by Hispanic origin
- Age by sex, race, and Hispanic origin
- Households and families
- Housing by occupancy
- Tenure and home value
- Labor force and employment by industry and occupation
- Marital status
- Education
- Income—including household income distributions, household income by age of householder, and per capita income. Updates of household income are also extended to provide after-tax (disposable) income and a measure of household wealth and net worth.
- 2020/2025 Consumer Spending
- 2020 Market potential, Tapestry segmentation, business locations, shopping centers, traffic counts, and more.
To read more about the data included in Business Analyst and how often it’s updated, you can read more on our ArcGIS Business Analyst data documentation page.
Additional Resources
We’re so happy to share this release of ArcGIS Business Analyst Web App with you. The full list of updates included in the June 2020 release of ArcGIS Business Analyst Web App can be found here, but I’ve included some additional links below that you may find useful.
- Business Analyst product overview page
- Review pricing and purchase Business Analyst
- Business Analyst resources page
- LinkedIn user group
- Business Analyst YouTube playlist
- GeoNet community
- Business Analyst Web App login page
- Read the reviews of Business Analyst on G2
- Email the team: businessanalyst@esri.com


Article Discussion: