Studying Up on Higher Education explores the cost and diversity of post-secondary education.
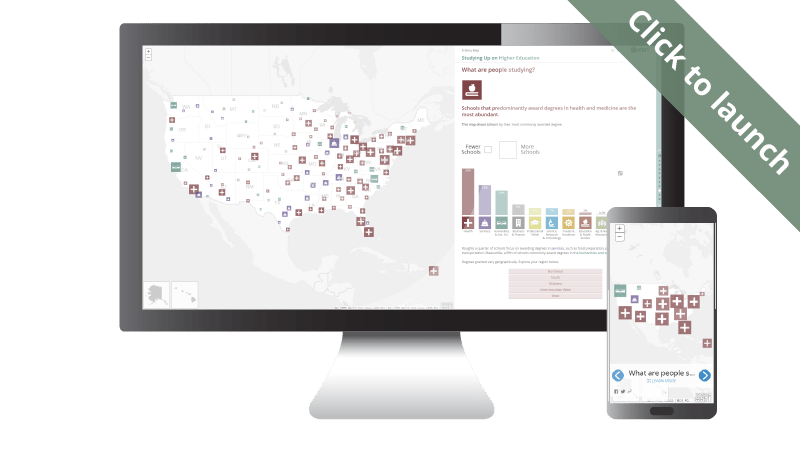
Navigating the landscape of learning after high school can be daunting. Professional certificates, trade schools, cosmetology programs, and traditional two- and four-year degrees abound in a landscape of thousands of institutions.
While the stakes of getting a college education are greater than ever, today’s students have a wide range of options for finding their ideal fit.

In nine maps this story map (built with the Map Journal template) visualizes a range of metrics pulled from the U.S. Department of Education’s College Scorecard. In particular, it compares datasets from 2016 and 2006. The piece looks at the type and variety of schools, cost and debt loads, demographics, and degrees.
In addition to the story map, we’ve also made our maps and data available in an ArcGIS Online Group.
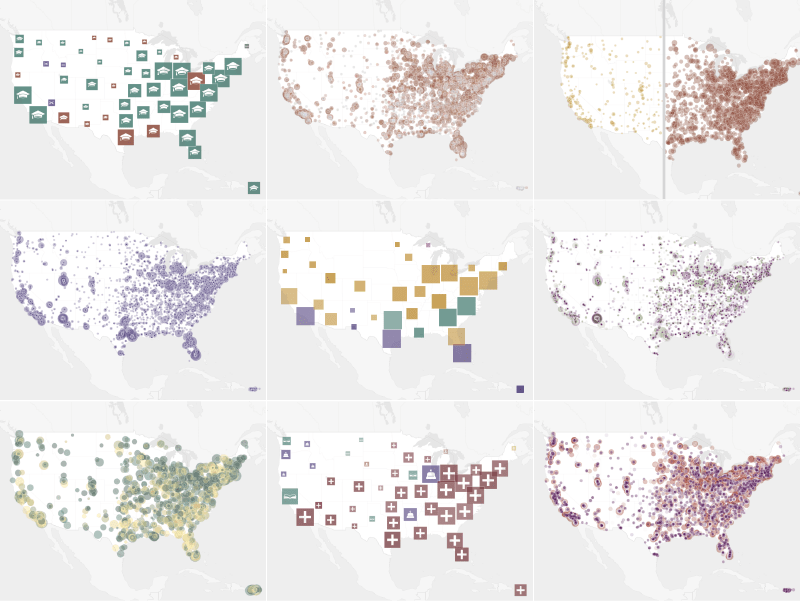
In addition to the data, this story demonstrates a handful of useful customizations:
- An experimental inset map app uses inset buttons to navigate to Alaska and Hawaii. This allows the story to truly be about the nation without having a map extent with lots of unused space.
- CSS inserted into Map Journal’s source view styles the look of Story Action buttons. Not only do the Story Actions enrich the narrative and reveal greater depth of data, custom styling allows the buttons to blend into the overall look and feel of the story.
- Customized colors for the navigation bar further reinforce a consistent color palette throughout the story map. Additionally, removal of the outlines from around the side panel blend the map and text areas together allow for a softer reading experience.
To find other advanced tips and tricks for Story Maps, check out our Developer’s Corner blog. Keep up with the newest in Story Maps by signing up to receive the Planet Story Maps newsletter.






Commenting is not enabled for this article.