Your Map Viewer Questions Answered
Do you have to convert maps made in Map Viewer classic to Map Viewer beta? Learn the answer and get your other Map Viewer queries answered.
Do you have to convert maps made in Map Viewer classic to Map Viewer beta? Learn the answer and get your other Map Viewer queries answered.
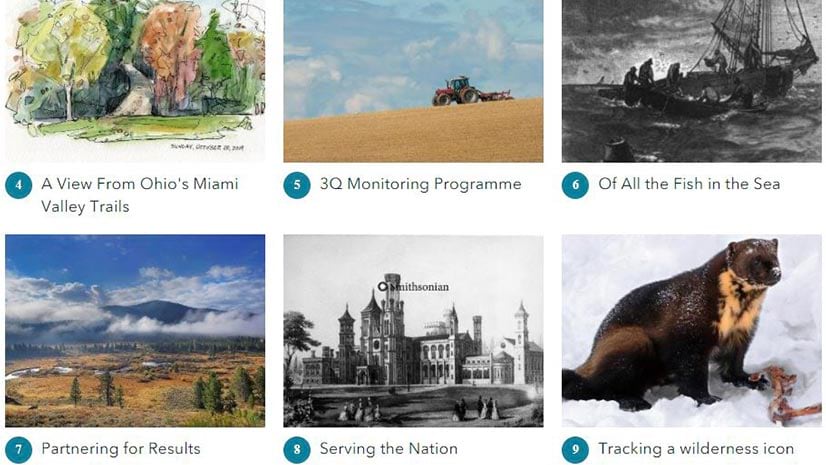
Allen Carroll, program manager for storytelling at Esri, shares a collection of his favorite stories created by the ArcGIS StoryMaps community.
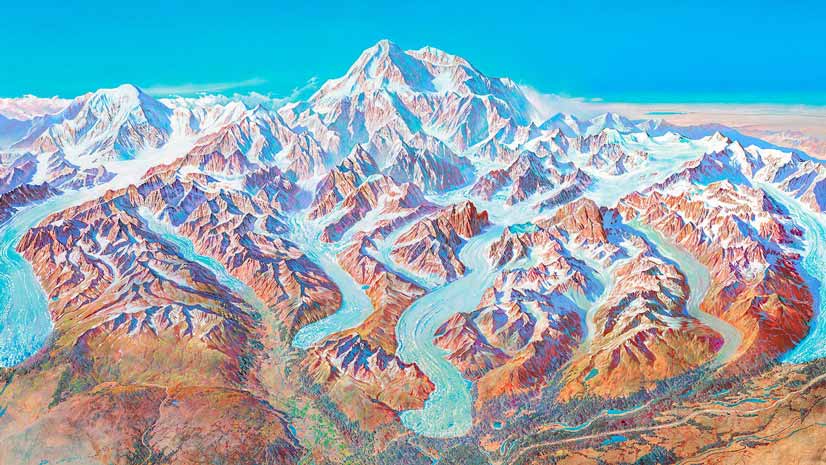
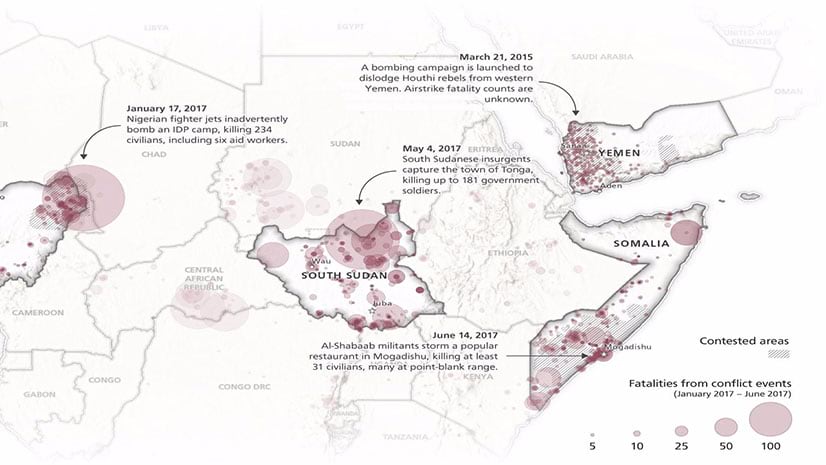
Betsy Mason, co-author of All Over the Map: A Cartographic Odyssey, talks about how data visualization changed the course of history.
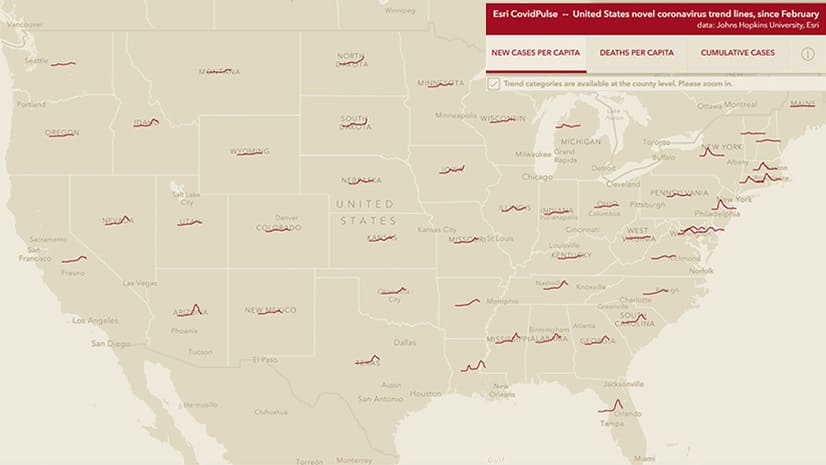
Check the new CovidPulse map from Esri to see the trend lines for reported cases of and deaths from COVID-19 in the United States.
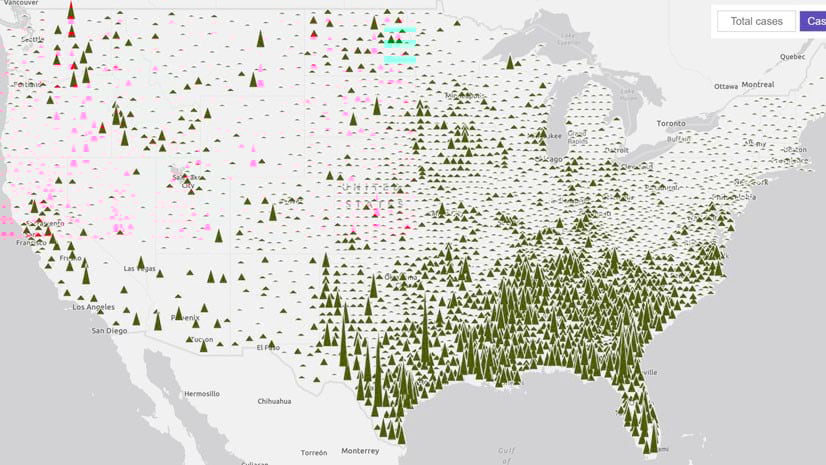
ArcGIS API for JavaScript recently began to support high-quality, scalable vector symbols in 2D MapView instances. See what you can do with them.
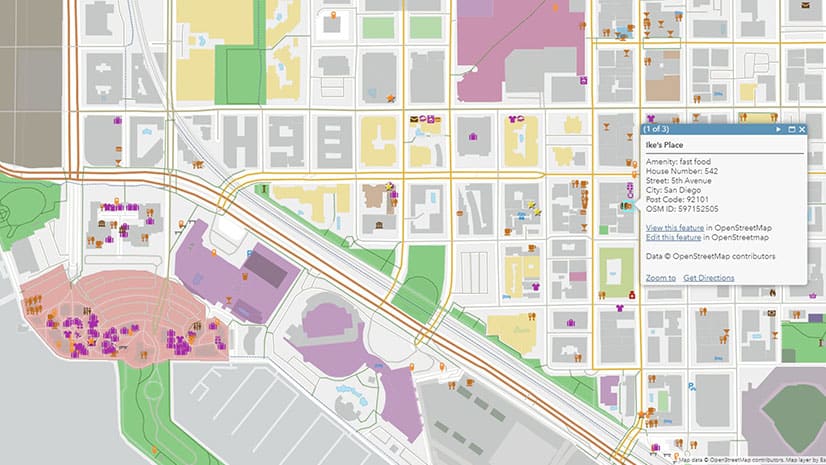
Esri will soon introduce a new set of feature layers, available in ArcGIS Online, that offer access to the latest OpenStreetMap (OSM) data.
To learn about the insights GIS will give us in this challenging new era, tune into a replay of the Esri User Conference Plenary Session.
As maps have switched from static paper items to digital conversations, you need to think about how interactive to make your maps.
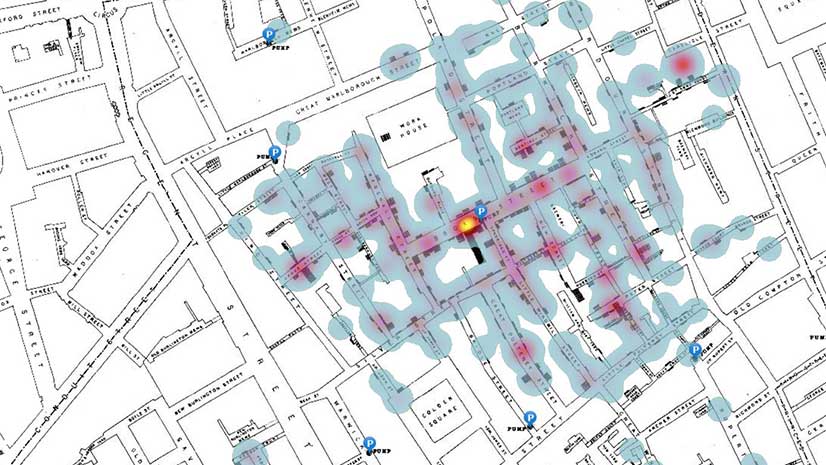
In this ArcGIS Learn lesson, you will remap Dr. John Snow's cholera outbreak data from 1854 in ArcGIS Online.
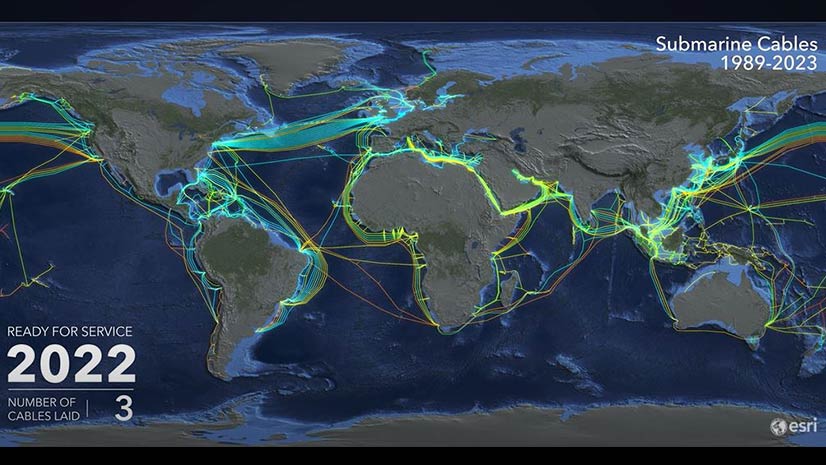
View an animated map of the worldwide system of underwater cables that carry telephone and Internet traffic.
Rich Nauman from the Esri environment team offers great advice on how to best convey information in your maps.
Esri president Jack Dangermond gave a talk at the 2020 Geodesign Summit about how science and geodesign can help create a sustainable future.