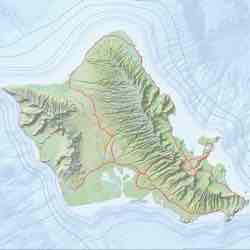
Overall, the process of making a map is all about how you communicate (#3) the things that you discovered (#2) from the geographic information that you collected (#1).
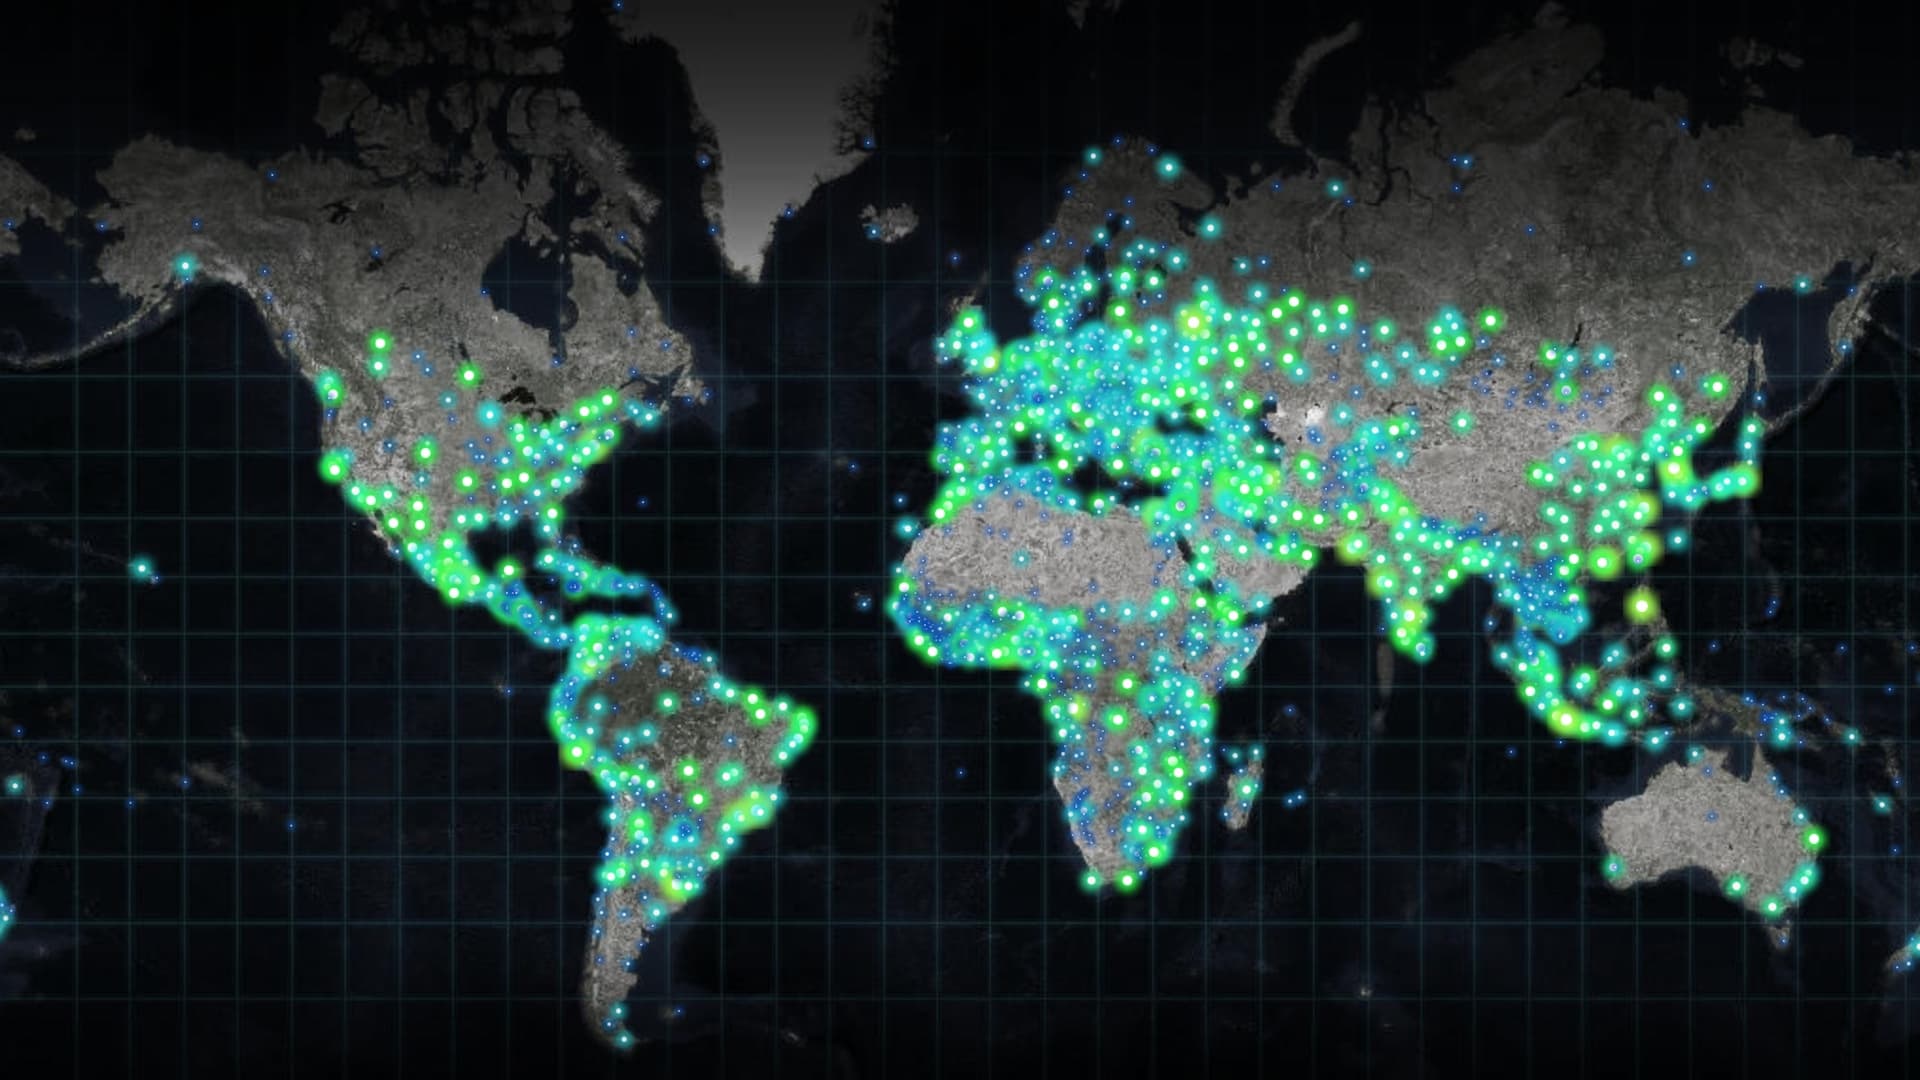
This post originally appeared on the ArcGIS Blog.
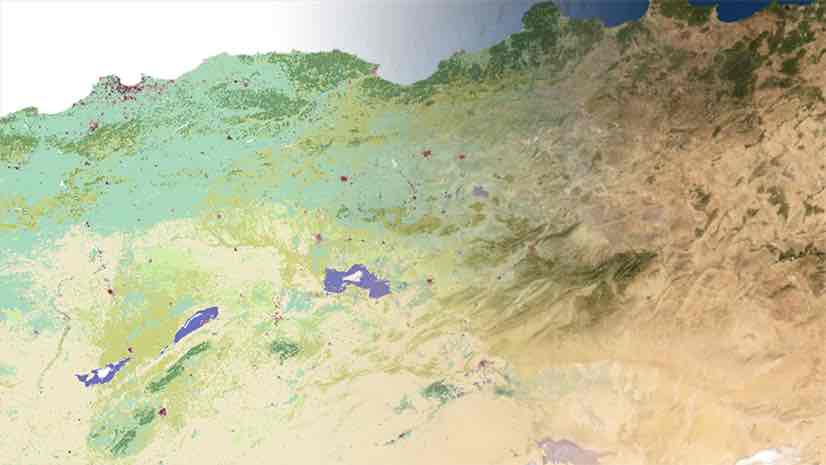
I get asked how maps are made from time to time. The short answer is ‘on a computer’, but the people who ask me are curious about the full process and deserve a better answer. So, here’s a long answer:
This can happen in many different ways. Here are a few examples:
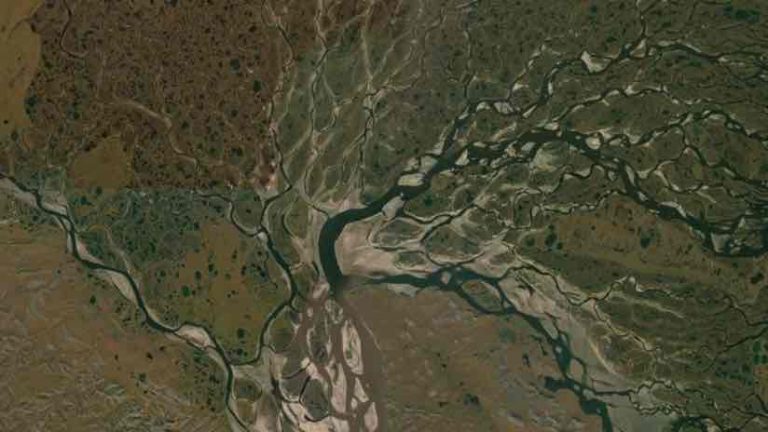
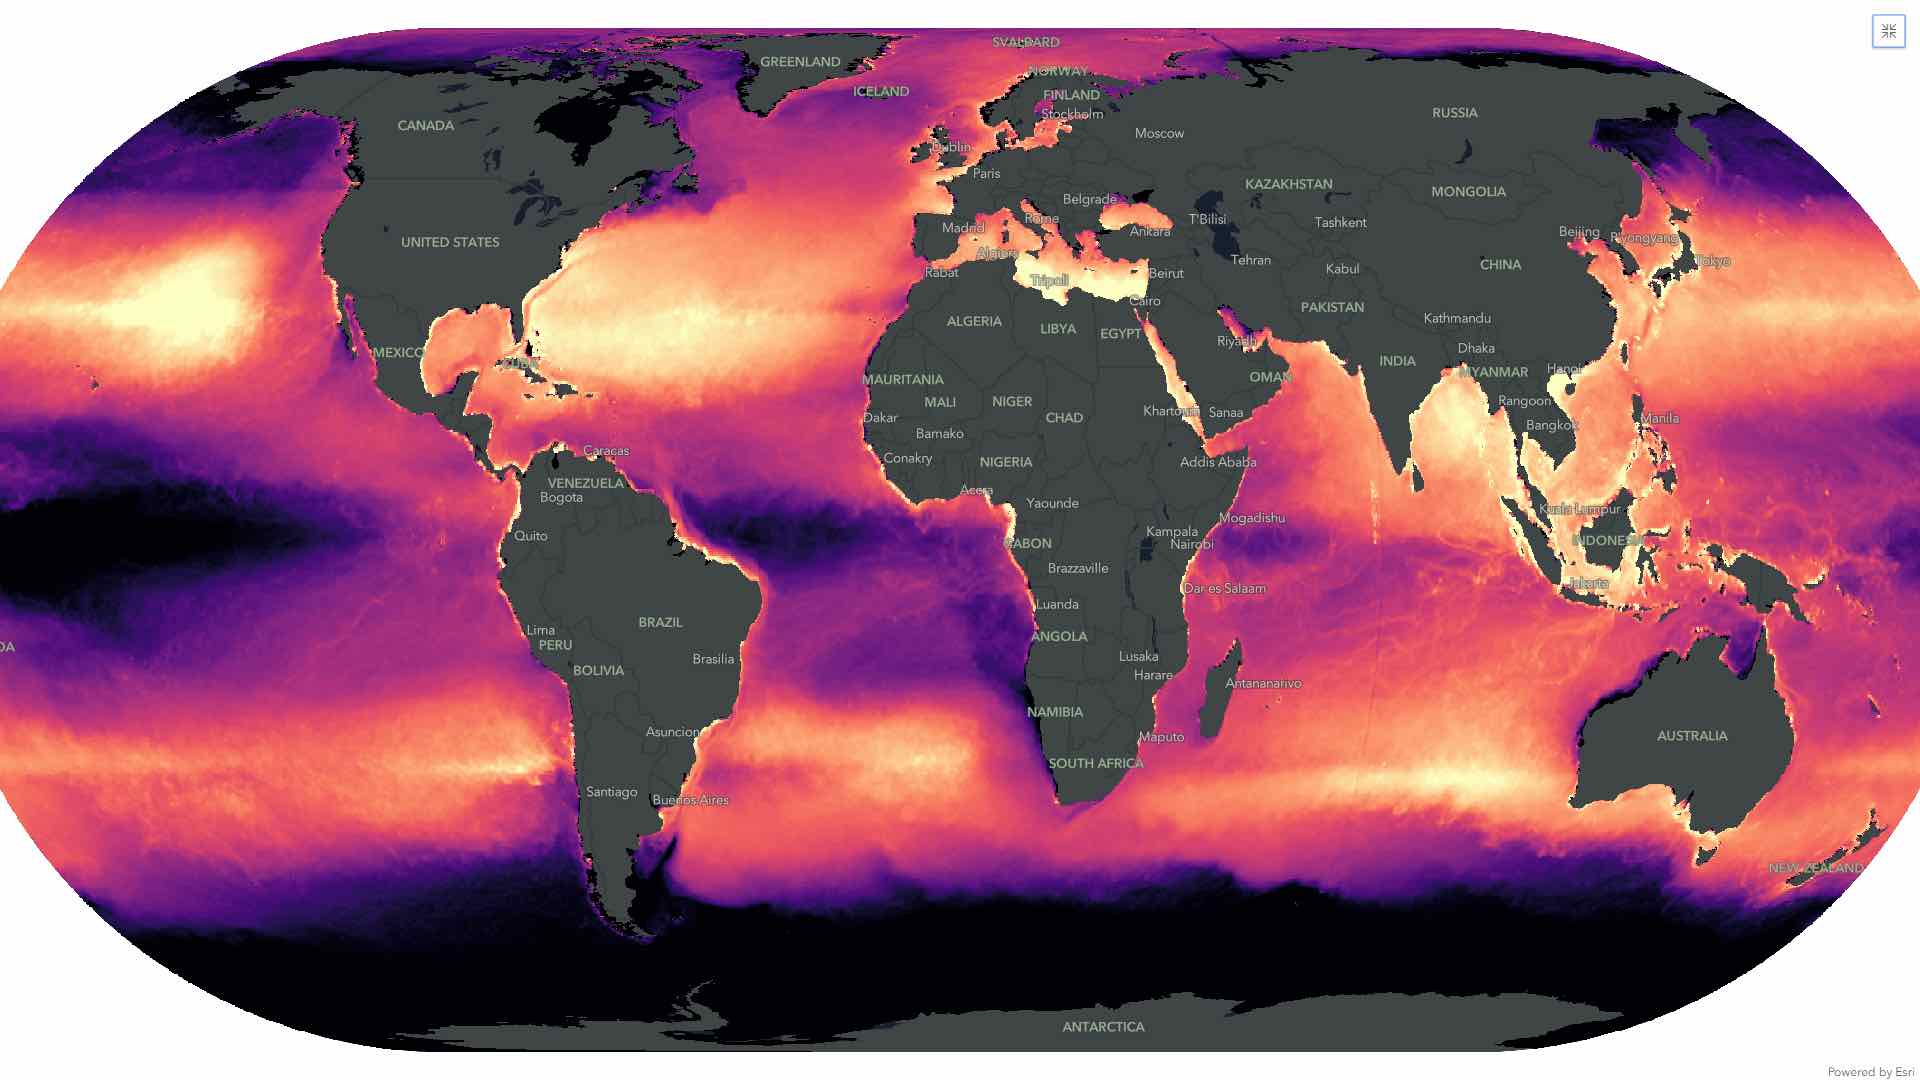
Now that you have data (otherwise known as geographic information)…
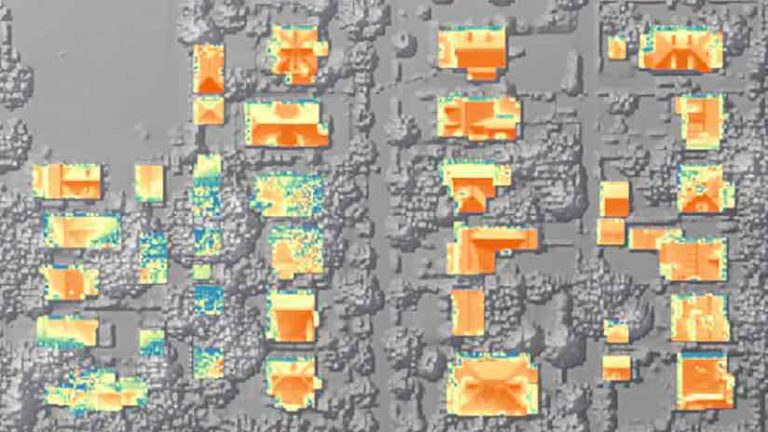
This work can take many forms, and can also be called GIS analysis:
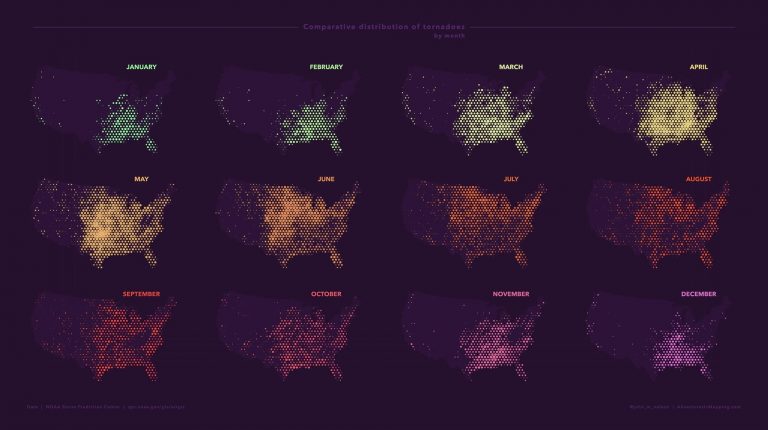
Overall, the process of making a map is all about how you communicate (#3) the things that you discovered (#2) from the geographic information that you collected (#1).
Historically, this entire process was called cartography. Today, most people in the GIS community are only referring to step #3 (presentation) when they use the word cartography. This is because the development of GIS technologies has allowed step #2 (analysis) to become far more powerful and prominent. We’re able to do things with geographic data today far beyond just drawing it on a map.
The answer: to make informed decisions. Decisions like:
• Where should we focus efforts within a city to prevent homelessness?
• What is the safest method to conduct a cave rescue?
• How many sandbags do we need to prevent flooding?
Every day maps are made to support and communicate a vast range of decisions in the real world. Some are simple, some are complex, and almost all of them are made by combining the work of many different people. The Living Atlas is an ever-growing collection of curated data and maps provided by geographers all over the world, and is a great place to start making maps of your own.
And all of this is closely related to another big question: What is GIS?