
September 9, 2025 |
Ryan Lanclos | Public Safety
September 10, 2021
After voting in the New York City primary election on the morning of September 11, 2001, Alan Leidner, then the director of Citywide Geographic Information Systems (GIS) at the New York City Department of Information Technology & Telecommunications (DoITT), entered the subway near his polling place. He exited into a different world.
The train stopped just short of the Chambers Street-World Trade Center station, near Leidner’s office, and began to inexplicably move in reverse, finally discharging passengers at 14th Street, a few miles uptown.
“I walked out and saw the billowing smoke from the site, and realized I couldn’t see the towers,” he recalled. “Somebody said they’d come down, and I thought ‘Nah, that can’t be.’ But when I looked closer, it was clear they were no longer there.”
He began the long walk home to the Upper West Side of Manhattan. Soon after he reached his apartment, he took an incoming call on his cell phone. It was Larry Knafo, director of the New York City Office of Emergency Management (OEM).
At the moment of the city’s most dire emergency, OEM was an agency without an office. The 7 World Trade Center building it had occupied stood in the shadow of the Twin Towers. OEM staff had made it out a few hours before their building collapsed, but they had to leave data and computers behind.
While Knafo struggled to reconstitute OEM at an alternate location, he had a request for Leidner.
“We need maps,” he said. “Can you make some?”
Leidner was not himself a mapmaker. An urban planner by training, he oversaw the city’s advanced GIS. Throughout the 1990s, he led a dedicated interagency team that created a singular map of America’s largest city.
One way to conceive of a city is as a series of informational layers, each represented by unique sets of locations on a common canvas. Some layers represent tangible information such as addresses, sidewalks, and power lines. Others provide data that is less immediately apparent, like air quality, demographics, and crime statistics. What all the layers share is a location component.
Leidner and a small team of GIS acolytes—including Wendy Dorf, a manager at the city’s Department of Environmental Protection who supervised the creation of an extensive GIS map of the city’s water supply system—understood that no typical map could represent all the city’s data layers. A digital map built with GIS, however, could include all layers in a way that balanced complexity with the clarity of visualization.
Influenced by similar projects in San Diego and Seattle, Leidner’s group consisting of consultant Jim Hall and local City GIS experts including Dan McHugh (Metro Transit Authority), David Litvin (DoITT), and Paul Katzer (Parks), began to build NYCMAP, a basemap of New York City. The map incorporated more than 7,500 aerial photographs and vector layers derived from the imagery that included city streets, properties, building footprints, transportation networks, rivers, and other waterways. It would always be a work in progress—with new data sets added as they became available—but by 1999, NYCMAP had reached a stage of tentative completion. With 50 available layers, it was one of the more advanced city maps in the world.
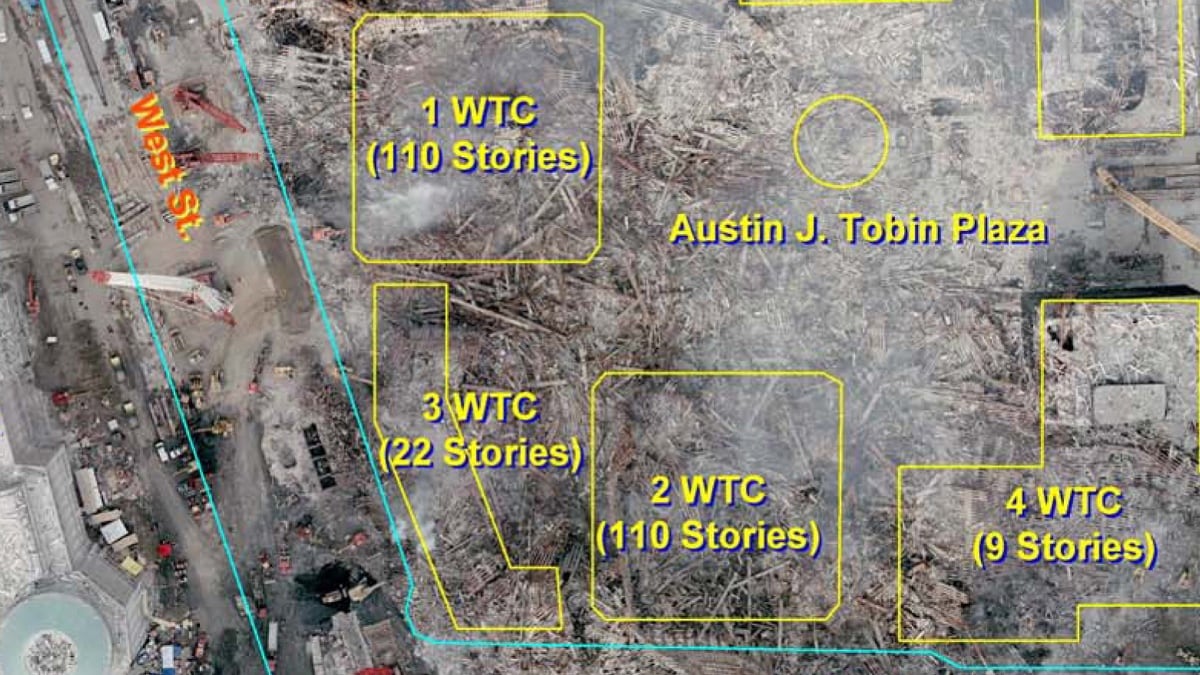
Two years before the attack, every city agency had received access to NYCMAP, including the Phoenix Unit, the Fire Department of the City of New York’s (FDNY) GIS division. Within an hour of the towers’ collapse on September 11, 2001, the FDNY used it to create a grid of the disaster site, to help orient first responders.
OEM leadership now needed Leidner and his team to quickly produce more detailed maps of the World Trade Center complex, generated from the basemap. Leidner connected with Sean Ahearn, a geography professor and GIS expert at the City University of New York’s Hunter College who was the steward of the basemap, having designed it alongside experts at PlanGraphics and managed the aerial imagery and photogrammetric work of Sanborn. Ahearn had done much of the technical work on the basemap at his lab, the Center for Advanced Research of Spatial Information (CARSI), and had the definitive and only accessible copy on computer disks in his office.
Leidner, Ahearn, and a few others worked until midnight that same day generating maps of the area soon to be known throughout the world as Ground Zero. At 6:30 the next morning, with the smoke still rising from the rubble, they loaded three large computers into two police cruisers, which ferried them to OEM’s temporary home at the New York City Police Academy. Wendy Dorf and Jack Eichenbaum, another local GIS expert, began calling and emailing anyone they could think of in the local GIS community to lend their expertise and mapping skills.
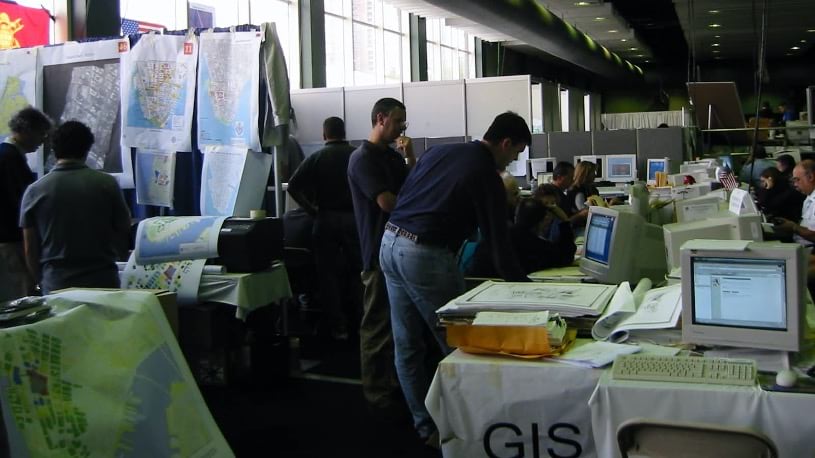
“We brought in a lot of volunteers,” said James McConnell, OEM’s GIS director. “We’d give them assignments, like adding new field data to maps and customizing data layers to fulfill specific mapping requests that supported field operations.”
By the end of the week, the group had coalesced into the Emergency Mapping and Data Center (EMDC), part of an emergency response center occupying Pier 92 on the Hudson River, five miles up the West Side Highway from Ground Zero. Every day, at all hours, as many as 100 GIS professionals and volunteers passed through EMDC, liaising with city, state, and federal response personnel who needed maps and data for everything from logistics to debris removal.
It was a profoundly unsettling time, with rumors spreading of further terrorist attacks. Because the center was considered a prime target, soldiers with automatic weapons guarded the doors while armed patrol boats stood ready on the river.
In the early days of the recovery effort, Leidner and his team expended considerable effort spreading the word, demonstrating the value of maps with city agencies. As more data was gathered, the maps grew in complexity, with layers from city agencies added to the existing basemap.
“Pretty soon, we were churning out hundreds of maps a day plus analyses, all dependent on being able to register data to the basemap and integrate it with other layers,” Leidner said.
Wendy Dorf’s team focused on underground infrastructure, a difficult proposition that involved importing utility company blueprints and detailed building plans, synchronizing conflicting data formats, and filling in gaps caused by missing or incomplete data. Making sense of underground connections became crucial to public safety and to those repairing the damage.
“Thank goodness that basemap was created in the ’90s,” Ahearn said. “Otherwise, we would’ve been severely hampered.”
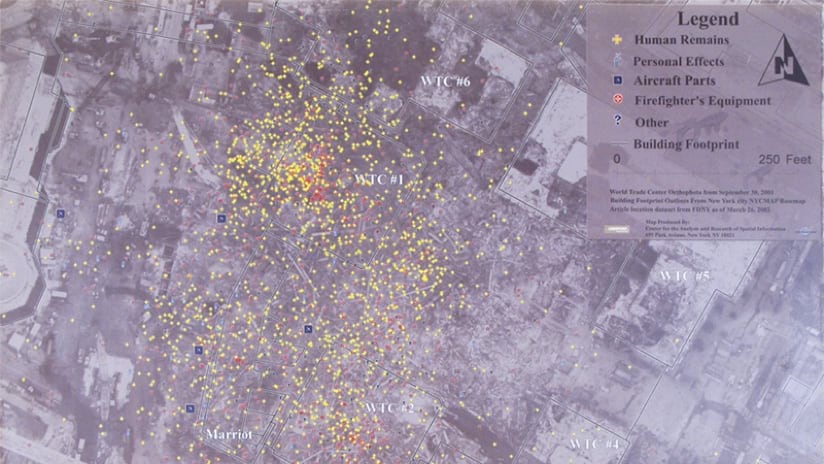
The circumstances of 9/11 forced the GIS teams to test technology’s limits. Everyone understood the importance of quickly capturing data and providing updates to responders and the thousands of families who had lost loved ones. GIS tools were used to collect near real-time updates, logging locations of debris and human remains.
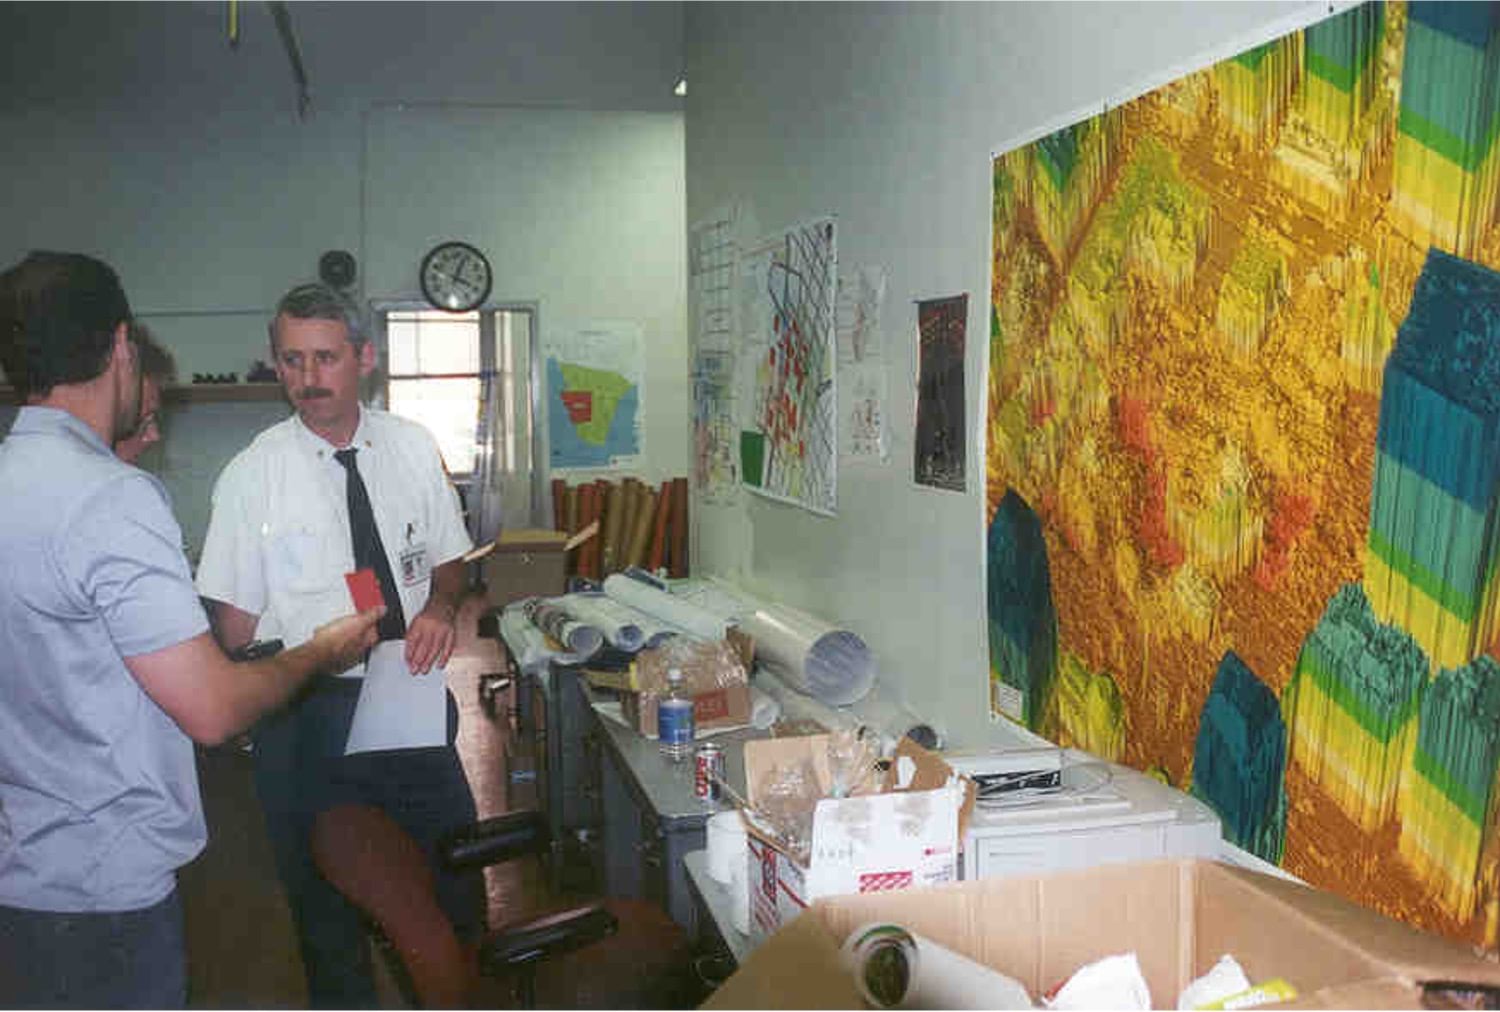
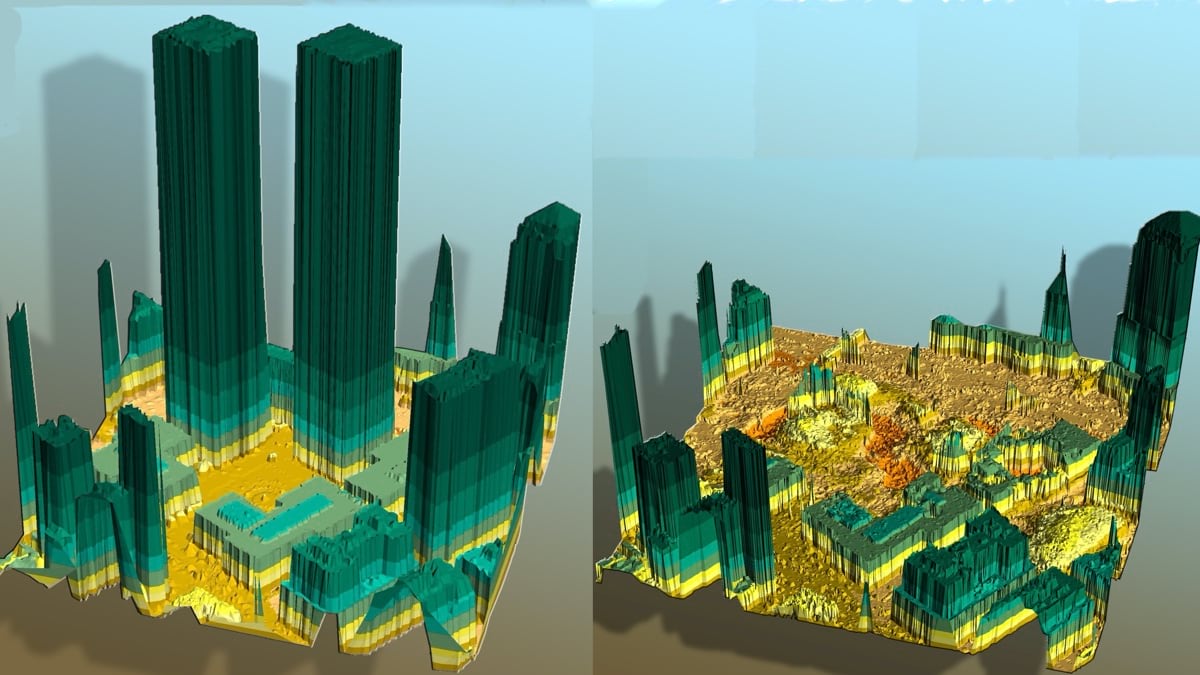
In prior years, the California Governor’s Office of Emergency Services (Cal OES) had emerged as a national leader in handling disasters. The agency had gained special notice for its groundbreaking work in 3D modeling in the days following the 1995 bombing of the Alfred P. Murrah Federal Building in Oklahoma City.
On the day after the 9/11 attacks, Dave Kehrlein, Cal OES’s GIS manager, flew from Sacramento to Washington, DC, to help federal investigators apply similar methods to the Pentagon crash site. He then traveled to New York to assist the Federal Emergency Management Agency (FEMA) with the growing GIS effort at Ground Zero.
Within days of the formation of the Pier 92 center, FEMA’s urban search-and-rescue team had established a staging area at the nearby Jacob K. Javits Convention Center.
In the 1995 Oklahoma City bombing, FEMA’s urban search and rescue team had mapped the immediate blast site, while city officials handled the area beyond the perimeter. Under the guidance of Kehrlein and Ron Langhelm, FEMA’s GIS coordinator, a similar division of labor developed in New York City after 9/11.
“We mapped Ground Zero, including all the operations and logistics,” Kehrlein explained. “Leidner’s team mapped everything outside the area, helping to get those buildings inhabitable and open for business, because a lot of them were damaged by things like window blowouts and flying debris.”
The World Trade Center was a symbolic target for a terrorist attack, but as the anchor of one of the world’s major financial districts, it was also a strategic one. Each day that was unsafe for people to move through the financial district represented a damaging impact to the city, nation, and world economies.
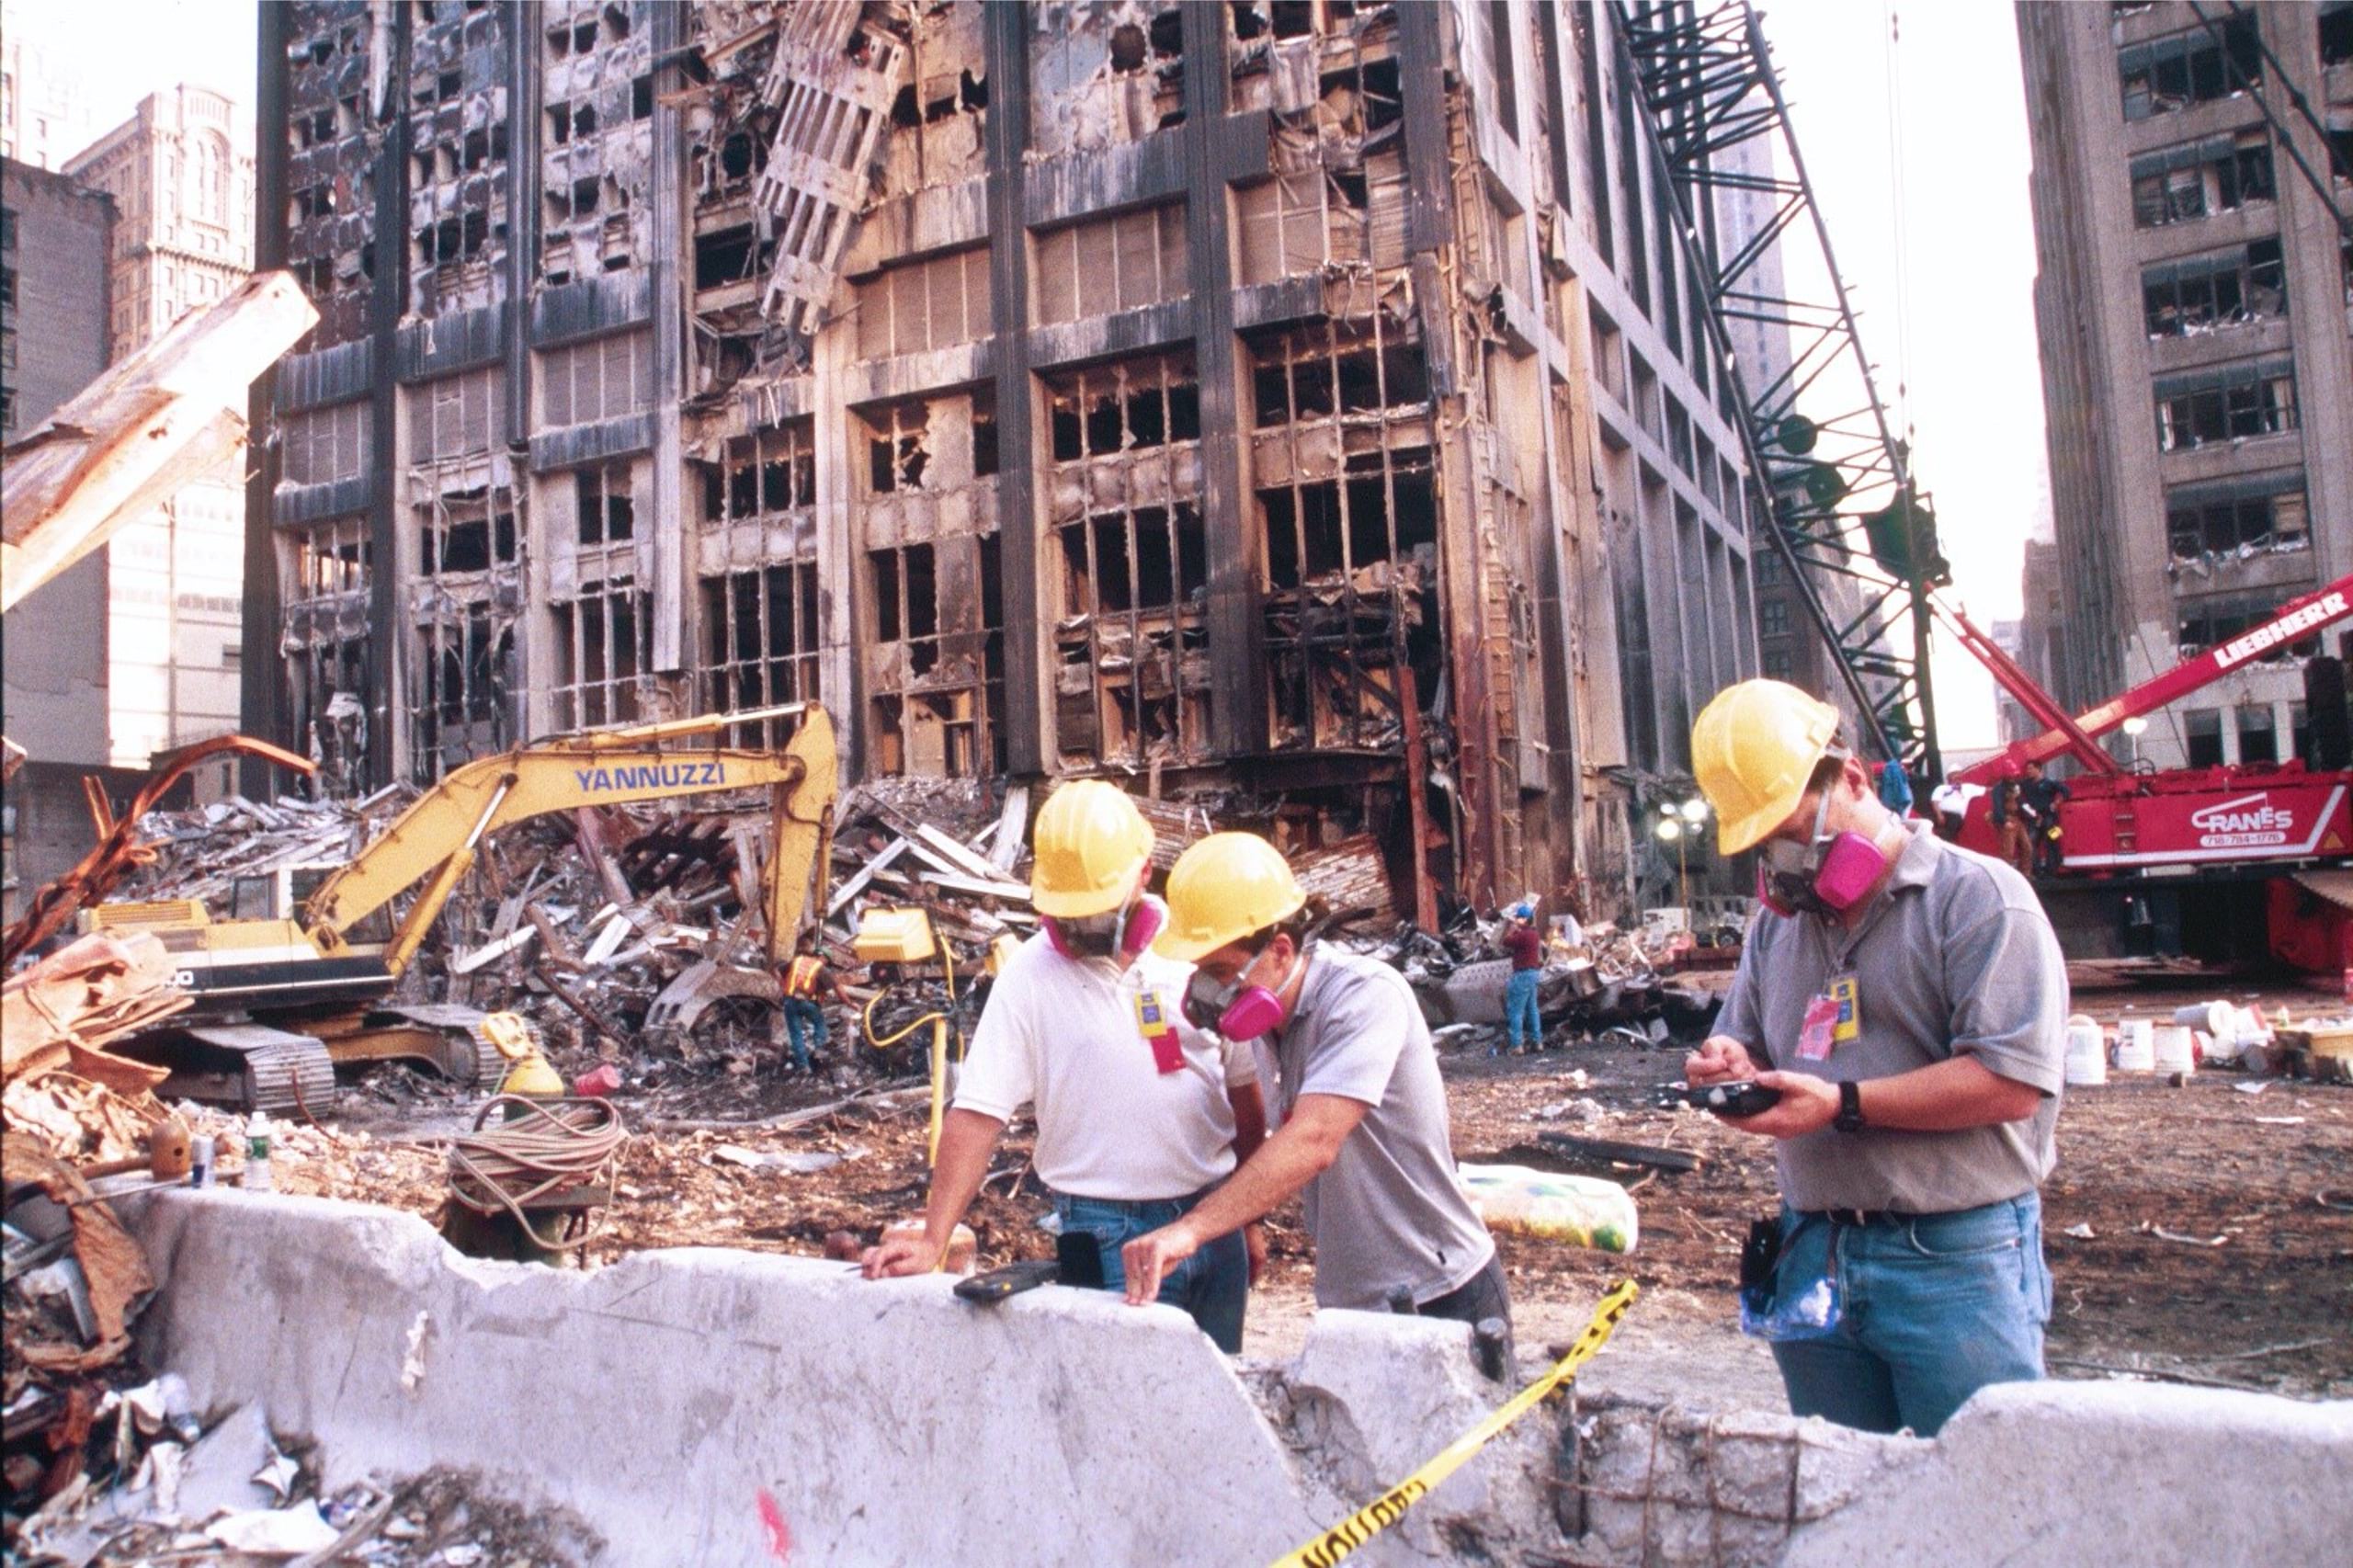
Using GIS tools, the team helped speed a building inspection process that would otherwise have proceeded slowly—investigators filling out and filing paper forms as they moved from building to building, examining the damages. Instead, Ahearn collaborated with the geospatial company LinksPoint to develop one of the earliest mobile GIS apps, accessed via PDAs (the precursor to today’s smartphones). “It went from a two-day lag to our being able to do an assessment of all the buildings in an area and sending that map to the mayor by noon,” he said.
In addition to their work making maps for first responders, the GIS experts at Pier 92 provided a portfolio of maps for media outlets and public distribution. Many of the map outputs were first-of-their-kind products—including constantly updated digital maps—that helped illustrate the aftermath of the attacks. New York City mayor Rudy Giuliani also used maps to communicate the changing conditions at Ground Zero to the public.
As the days passed, GIS experts kept finding new uses for the technology to support critical inquiries. A request came in to map all suitable buildings in the vicinity within 10,000 feet from Ground Zero that could be used as temporary morgues. Another response team needed maps of the subway tunnels flooded by water main breaks, as structural engineers began to worry that Hudson River water could spread through the basements of destroyed buildings.
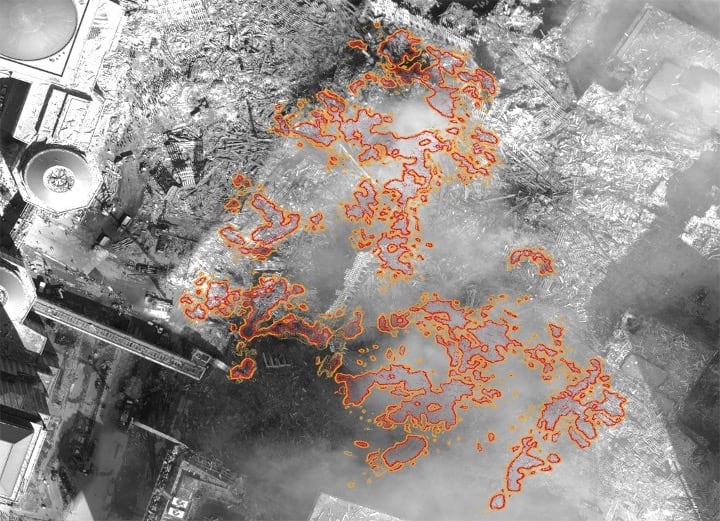
Perhaps the most harrowing moments came when someone on Pier 92 mentioned there might be a tank under the site containing 100,000 gallons of Freon, the colorless and odorless gas used in the World Trade Center’s air conditioning systems. Ongoing underground fires, fed by oil and gas from the buildings’ emergency power systems, threatened to reach the Freon tank.
Ahearn and others were able to map the fires’ locations using thermal imagery from sensors aboard helicopters flown above the site. But they needed to locate the tank in relation to the fires. Freon, when exposed to heat, creates phosgene, a gas that was the fatal agent in most of the chemical weapons used in World War I. Word spread, and eventually GIS consultant George Davis located building plans that showed the location of the tank. Imported into GIS, that information allowed firefighters to hose down the area between the flames and the Freon, preventing further catastrophe.
Above ground, as recovery efforts continued, GIS maps and aerial imagery guided daily work. Working with engineers and GIS specialists, Wendy Dorf assembled and collated underground infrastructure location data that showed operators of cranes and other heavy machinery—and others working on the pile—where the earth may have become unstable due to nearby fires.
New York City’s GIS teams provided crucial insights in response to the 9/11 attacks, and their applications of the technology have grown more advanced since. At the World Trade Center site in 2001, teams assessing and recording response progress relied on fixed-wing airplanes with thermal imaging and other sensors to collect data daily under the supervision of New York State GIS officials—which was processed in Albany (150 miles away). The disk drives were then driven back each morning to the EMDC by state troopers. FDNY firefighters from the Phoenix Unit also shot digital photos while hanging from a helicopter’s landing gear.
“It was one of those moments where the technology went from being something used by a small group of geospatial scientists to being an integral part of how to manage a city—and, in this case, how to respond to an emergency,” Ahearn said.
Today, disaster relief includes drones and cloud computing for image gathering and processing. High-speed networks preclude the cumbersome tapes and drives of the past. Many response teams are using drones to gather imagery in a way that’s cheaper, safer, and more flexible than helicopters. Drone images, as well as lidar and other remotely sensed data, can be swiftly and securely processed in the cloud and synced to a GIS map or application.
Looking back, McConnell recalls the emergency response to 9/11 and the work of many teams using GIS to bring key data points together. “I think for many people, it was their first real exposure to GIS,” he said. “Everybody was used to static maps. The fact that we could have updated maps every day—focusing on exactly what people needed to focus on—was a new experience for a lot of responders and recovery people.”
The Pier 92 group finally dispersed after three months. “I can remember one of the last times I went to the site,” Ahearn said. “I was standing with a firefighter on top of a building overlooking the World Trade Center. We spotted a plane flying toward us, and we held our breath.”
Learn more about how GIS is used to safeguard public safety.