ArcGIS Living Atlas of the World is the foremost collection of geographic information from around the globe. It includes curated maps, apps, and data layers from Esri and the global GIS user community that support your work. Living Atlas also includes analysis-ready layers and tools that work across the ArcGIS System. Visit the ArcGIS Living Atlas of the World website where you can browse content, view the blog, and learn how you can contribute.
Here’s what’s new since the last ArcGIS Living Atlas News (June2021).
Quick links
Use the links below to jump to sections of interest. Use your browser back arrow to return.
- Living Atlas apps
- Basemaps
- World elevation
- Imagery
- Environment
- Open access national datasets
- Policy Maps
- Analysis tools
- Other updates
- Community Maps
Living Atlas Apps
Content from ArcGIS Living Atlas of the World is used to make valuable apps for visualization and analysis. These apps can be found under the apps tab at the Living Atlas website or via search at the browse tab.
Esri Drought Aware
Leveraging data and information from NOAA, U.S. Dept. of Agriculture, and the U.S. Census Bureau, Esri has released an update to the former Drought Tracker application. Drought Aware improves awareness of drought in the U.S. and its potential impacts on population and agriculture through the integration of historical drought data, current drought status, drought outlooks, and agricultural impacts.
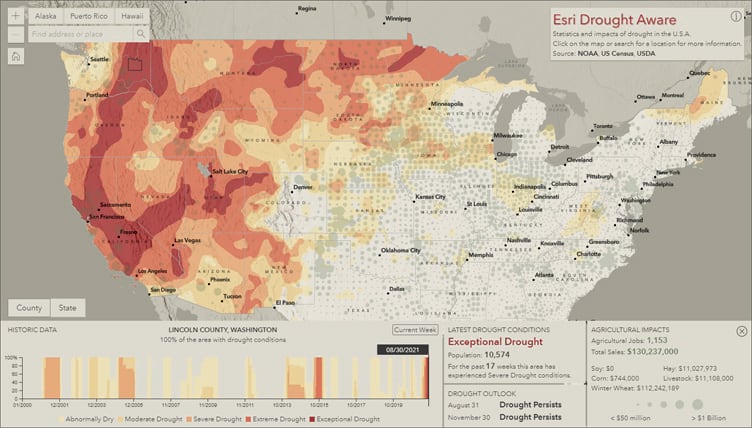
For more information, see the Drought Aware item overview and Track U.S. drought conditions using Drought Aware.
World Imagery Wayback
Wayback imagery is a digital archive of the World Imagery basemap with more than 120 different versions of imagery captured over the last 6+ years. World Imagery Wayback app lets you browse for changes in your area of interest and lets you make a map with versions of interest. Animate mode is a newly added capability that makes it easy to view selected imagery using playback animation.
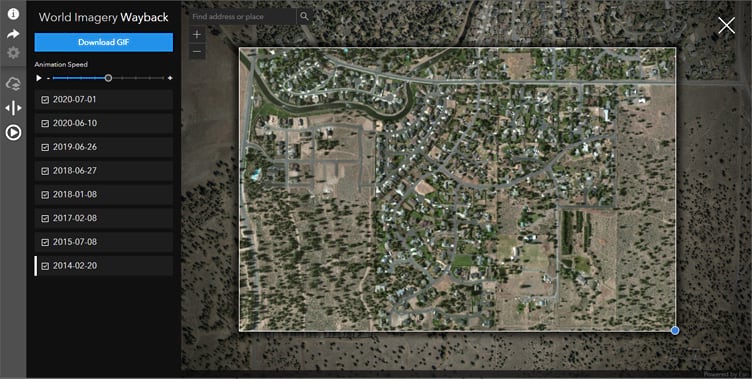
When in animate mode, click the share button to save the animation, selected imagery, and geographic location with others. Click the links below to see shared animations:
You can optionally download the animation as an as an animated GIF. For more information, see Playback your Wayback.
USA Wildfires
USA Wildfires presents a live feed of current wildfire locations in the United States along with acreage and containment. When zoomed in, the app also displays current fire perimeters from the Integrated Reporting of Wildland-Fire Information (IRWIN) service. Smoke forecasts can also be viewed and are from the National Weather Service showing a 24-hour forecast window in 1-hour increments.
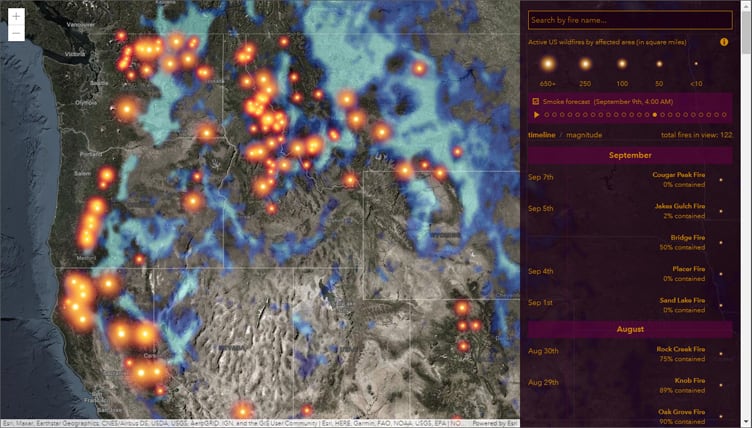
Several important enhancements have been made to the smoke forecast layer, including a new stepped time display interface and enhanced smoke visualization. Fire perimeter visibility has also been enhanced. The app now automatically refreshes hourly.
For more information, see the item details or Improvements to the USA Wildfires app.
ArcGIS Living Atlas Live Feeds Status
Living Atlas Live Feeds Status is a simple to navigate page displaying the current service status for Esri live feeds. The page displays a summarized view of each service, showing the current status and usage trend, along with an RSS link.
The RSS link has recently been enhanced to trigger when status information from the system administrator appears which might contain additional details related to the status or planned events that may impact service availability or performance.

The drop-down displays additional details such as the time of the last update, usage trend, 1-hour and 6-hour usage rates, feature counts, and time of next update check. The Live Feeds Status page is refreshed every 15 minutes on the quarter hour. For more information, see Introducing ArcGIS Living Atlas Live Feeds Status.
Basemaps
Esri basemaps are updated regularly with data from commercial, open, and community sources. All vector basemaps have been updated using data from HERE, SafeGraph Places, and content contributed to the Community Maps Program. For more information on recent updates, see the latest vector basemaps blog articles. You can view all vector basemaps by browsing Living Atlas.
OpenStreetMap (OSM)
OpenStreetMap (OSM) is an open, collaborative project to create a free editable map of the world. Esri has produced and hosted an OSM vector tile basemap for several years, and recently add the Daylight Distribution.
Esri recently incorporated the Daylight Map Distribution of OSM data, which is enhanced with additional data quality and integrity checks and supplemented with additional open data. Daylight is supported by Facebook and supplemented with buildings data from Microsoft. The OSM Daylight map is updated every month with the latest OSM Daylight data.

The OpenStreetMap Vector Basemap is available in multiple styles, with the default rendered using OSM cartography. Additional styles match the cartography of Esri Vector Basemap styles. To view the collection, open the OpenStreetMap Vector Basemap group or view all OSM content in Living Atlas.
Raster basemaps moved to mature support
A reminder that the non-imagery raster basemaps are now in mature support. For more information on which services are no longer updated and suggested vector basemap alternatives, see Raster basemaps moved to mature support.
World Elevation
Living Atlas provides foundation elevation layers and tools to support analysis and visualization across the ArcGIS platform. These layers are updated quarterly with high-resolution elevation data from various sources and the Community Maps Program.

World Hillshade layers (World Hillshade, World Hillshade (Dark)) and elevation layers (Terrain 3D and TopoBathy 3D) have been enhanced with LiDAR derived 1-meter elevation data for Latvia, Lithuania, Salzburg (Austria), and 10-meter elevation data for Slovakia.
World Hillshade is the default background for various basemaps, such as World Topographic, Streets (with Relief), and Terrain with Labels. Terrain 3D is the default elevation ground surface in scenes. To see more elevation content, see the ArcGIS Online Elevation Layers group.
Imagery
World imagery
World imagery has been updated with 30 to 50 cm resolution imagery and community contributions for major portions of the U.S. and major metropolitan areas. Worldwide, imagery has been updated across Europe with 50 cm imagery, India has been upgraded from 1.2 m resolution imagery to 60 cm resolution imagery from Maxar.
VIIRS Nighttime Lights Monthly Cloud-Free Composite (beta)
The VIIRS Nighttime Lights Monthly Cloud-Free Composite provides an opportunity for visualizing, measuring, monitoring, and analyzing human activities, at both a regional and global scale.

The content is useful to pinpoint urbanized areas and begin to detect patterns of change related to urbanization, population growth, economic activity, access to electricity, and more. For more information, see the item details or Earth by Night.
Environment
Ecologic Coastal Units (ECUs)
A new set of resources is now available that describe global shoreline characteristics. Ecological Coastal Units (ECUs) were developed by the U.S. Geological Survey (USGS) in partnership with Esri and the Marine Biodiversity Observation Network (MBON).

The data allows for the visualization and query of any stretch of coastline on Earth, except for Antarctica. The underlying data are 4 million 1km or shorter coastal segments, each of which is attributed with values from ten ecological settings variables representing the adjacent ocean, the adjacent land, and the coastline itself. The content include both a feature layer and an ArcGIS Pro package.
For more information, see Ecological Coastal Units (ECUs) available in Living Atlas.
Standardized Precipitation Index (SPI) Recent Conditions
The Standardized Precipitation Index (SPI) is a live feed used to analyze meteorological droughts. SPI estimates the deviation of precipitation from the long-term probability function at different temporal periods.

The layer shows the SPI index at different temporal periods calculated using the SPEI library in R and precipitation data from CHIRPS data set. For more information about this layer, and other Living Atlas drought layers, see Mapping drought trends in the U.S.
Representative Concentration Pathways (RCP) for understanding climate change
Representative Concentration Pathways (RCP) are a way to understand how climate may change based on human behavior, capturing future trends to enable predictions of greenhouse gas concentrations in the atmosphere. RCPs range from very high, worst-case scenario (RCP 8.5) to very low, best-case scenario (RCP 2.6) concentrations.

Several layers representing the RCP 8.5 scenario have been added to Living Atlas:
- Days Above 90 degrees F RCP 8.5
- Daily Max Temperature above 99th Percentile RCP 8.5
- LOCA County Climate Summaries RCP 8.5 2050
- Cooling Degree Days RCP 8.5
U.S. Urban Heat Island Mapping Campaign
NOAA has been engaged in a nationwide effort to use a combination of Sentinel-2 satellite data along with temperature readings recorded from car and bike-mounted sensors to generate detailed maps of the urban areas most impacted by heat.

This feature layer shows the current campaign results summarized by neighborhood and includes temperature, environmental, and demographic information. For more information, see Urban Heat Island mapping campaign cities or view the item details.
First Street Foundation Flood Factor
First Street Foundation, an Esri non-profit partner, has contributed several layers and maps to support understanding flood risk in the United Sates. Their Flood Factor data is meant to extend FEMA’s flood mapping, and includes all forms of flood risk, from heavy rains to coastal storms, sea level rise, river flooding, and future climate modeling.

Other environment content updates
USA Storm Reports is a live feed service with all layers updated every 15 minutes from data provided by NOAA’s National Weather Service Storm Prediction Center. The feed has been updated to include a new layer summarizing all NOAA reported storm incidents in the past week. The layer symbology has also been updated to include standard incident symbology.

California Fire Perimeters 1878-2020 has been updated with fire perimeters from 2020. Perimeters are sourced from the Fire and Resource Assessment Program (FRAP) and are updated shortly after the end of each calendar year. A 2020 only feature layer view and vector tile layer are also newly added.

USA Cropland is a time-enabled imagery layer showing the crops grown during every growing season in the U.S. since 2008. A total of 15 different predefined renderers can be applied to focus on specific aspects of the imagery. The layer has been updated with 2020 data.
NLCD Land Cover has been updated with 2019 data. The layer displays a time series of land cover for the U.S. from the National Land Cover Database (NLCD). The layer groups land cover into 20 classes, which include vegetation type, development density, and agricultural use.
USA Federal Lands layers have been updated. These layers show U.S. lands managed by six federal agencies and views are used to derive individual layers for each agency. View the item details for each layer type to access derived view layers.
- USA Federal Lands (feature layer)
- USA Federal Lands (imagery layer)
Open access national datasets
Federal datasets have been added to the Living Atlas to better serve the ArcGIS and broader geospatial communities by providing access to a collection of curated, ready-to-use layers that are cached and updated from federal sources.
This collection, from the National Geospatial Data Asset (NGDA) Portfolio Datasets, provides national geospatial data that supports decision-making activities and can also be used as valuable resources in maps and apps.

The layers are updated regularly and support access through Esri and modern OGC standards, delivering direct and easy access of the latest content for maps, analysis, and by developers. The layers can also be exported to a variety of common formats for offline use.
The content is licensed under open terms of use to facilitate and encourage widespread use, and references the source federal agency metadata. For more information, see Esri Provides Open Access to Key Federal Geospatial Data.
Policy maps
Census redistricting data and maps
The U.S. Census Bureau is required to provide states tabulations of population, which were released on August 12th, 2021. This data is now available in ArcGIS Living Atlas of the World for the entire country, for individual states, including the District of Columbia and Puerto Rico. The data is aggregated from state down to block level and includes an additional six levels of geography: state legislative districts (upper and lower), congressional districts, Core Based Statistical Areas (CBSA), incorporated places, and Census Designated Places (CDP).

The entire collection of Living Atlas Census 2020 maps, layers, and apps can be viewed in:
Decennial 2020 Census Map and App Examples (group)
Decennial 2020 Census Data Layers (group)
Atlas of Census 2020 Redistricting Data
This Atlas contains a set of ready-to-use thematic maps of some of the more popular redistricting attributes. These include predominant race and ethnicity, housing vacancy rates, total population, and more.
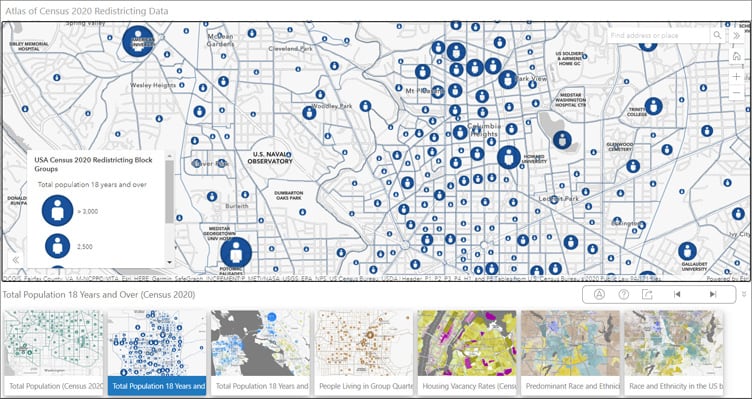
Census 2020 Atlas: Race Alone or in Combination
This mini-atlas features the new way the Census tabulates population by race, alone or in combination with any other race. This collection of maps shows the percentage of each race category in according to the 2020 decennial Census.
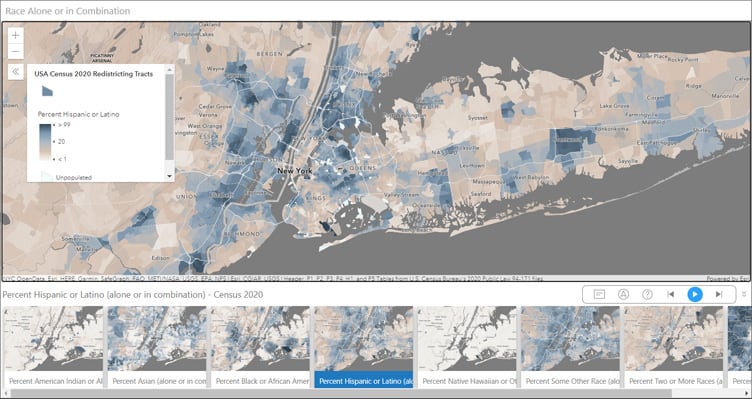
The patterns are shown by states, counties, tracts, block groups, and blocks. Zoom or search anywhere in the US to see a local pattern and click on an area to learn more.
Browse Living Atlas to view all Census 2020 content. For more information, see Census redistricting data and maps available in ArcGIS Living Atlas.
Predominant Cause of Death per 100,000
This map shows the predominant cause of death per 100,000 people in the U.S. using data from the County Health Rankings dataset, a collaboration between the Robert Wood Johnson Foundation and the University of Wisconsin Population Health Institute.

The map shows five causes of death: drug poisonings, suicides, motor vehicle crashes, firearm fatalities, and homicides. The layer used to create the map is the County Health Rankings 2021.
Ratio of population to primary care physicians
Health professionals, especially primary care physicians, are in high demand in many parts of the U.S. Some areas are experiencing health professional shortages. This map shows the ratio of population to primary care physicians in the U.S. using the County Health Rankings dataset.

Where are areas with violent crime offenses?
Violent crimes are defined as offenses that involve face-to-face confrontation between a victim and a perpetrator, including homicide, rape, robbery, and aggravated assault. This map shows where there are violent crime offenses per 100,000 population in the U.S. and is based on the County Health Rankings dataset.

American Community Survey
The Living Atlas Policy Maps team maintains a collection of 104 layers containing a wealth of data from U.S. Census Bureau’s American Community Survey (ACS). ACS is an ongoing survey by the U.S. Census Bureau that provides vital information on a yearly basis about our nation and its people.
New maps and apps based on ACS data have been recently published and are available in Living Atlas with maps available in Esri Maps for Public Policy. These include:
What region did the population who lived in a different state live in?
Where are households with satellite internet?
Where are households with cellular internet?
Households with cellular as their only internet subscription
Non-white population in the US (Current ACS)
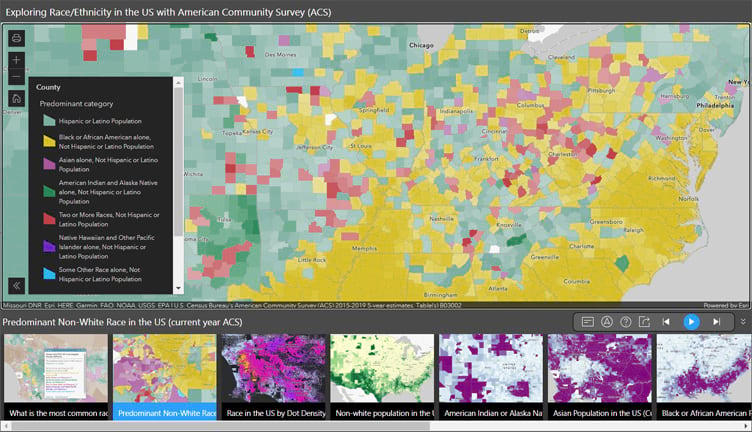
Predominant Non-White Race in the US (current year ACS)
Where are housing units likely to have lead paint (built before 1950)?
Atlases
Atlas of Internet Connectivity
Exploring Race/Ethnicity in the US with American Community Survey (ACS)
Esri Maps for Public Policy
Policy maps clearly show where there is an opportunity to intervene. Esri Maps for Public Policy provides instant access to useful maps that illuminate areas where your work can make a difference. Free to the public to view and use, these policy maps give your team a head start understanding the people, organizations and issues in your community.
To get the most out of Policy Maps, resources are available for education, training, best practices, and industry perspectives that help raise your data literacy, provide you with models, and connect you with the work of your peers. See Esri Maps for Public Policy Resources.
Policy Maps Collections
Policy Maps collections gather stories and resources from the Esri Maps for Public Policy website to help you learn more about specific topics. The collections include forms for you to submit your own maps to expand understanding.
Analysis tools
Deep learning models
Ready-to-use deep learning models are now available via ArcGIS Living Atlas. These models have been trained on data from a variety of geographies, you no longer have to invest time and energy into manually extracting features or training your own deep learning model. As new imagery comes in, you can readily extract features at the click of a button and produce layers for mapping, visualization and analysis.

New pre-trained geospatial deep learning models have been added:
Building Footprint Extraction (Africa)
To learn more about the deep learning packages and how they are used, view the item details above. Browse Living Atlas to view all deep learning packages, rule packages, and raster function templates. For more information, see Pre-trained deep learning models update.
Other updates
USA Parks
The USA parks layer presents the boundaries of thousands of named parks and forests at national and state levels, symbolized by park/forest type. The layer has been recently updated with the latest information.

Community Maps
The Community Maps Program enables community contributions of authoritative data to help build the ArcGIS Living Atlas. You can provide feedback, create detailed features, and share data layers and services, and contribute to Esri basemaps that anyone can use.

For more information on updates, see Basemap and imagery updates include over 120 communities around the world.
More information
For more information, see the following:

Commenting is not enabled for this article.