Since 2018, Esri’s Living Atlas Policy Mapping team provides to the GIS community a set of free layers that contain a wealth of data from the U.S. Census Bureau’s American Community Survey (ACS). These are five-year estimates, available in both boundary and centroid form, and updated annually when Census releases its newest estimates.
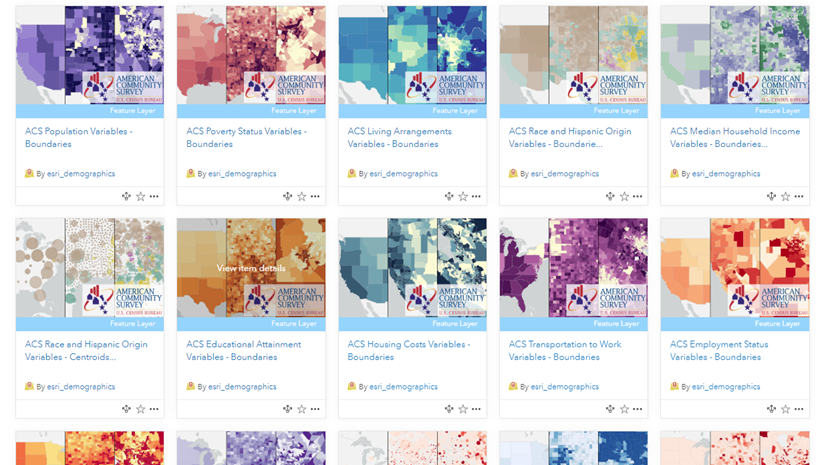
The Census ACS layers in Living Atlas cover a wide range of topics on housing, income, internet access, education, disability, health insurance, and more. These layers contain data for states, counties, and census tracts. More than 100 layers are available, each focusing on a specific topic, with a pre-configured informative pop-up and symbology.
We also receive requests to add additional Census tables and layers throughout the year and do our best to accommodate these requests. The Policy Map team is excited to announce two new topics now available in ArcGIS Living Atlas!
ACS Educational Attainment by Race by Sex (boundaries & centroids)
ACS Specific Language by English Ability (boundaries & centroids)

Educational Attainment by Race by Sex
Educational Attainment by Race and Sex has been highly requested for its relevance to racial equity programs such as the Southern Communities Initiative. This layer has count estimates for the following groups:
Education: less than high school and bachelor’s degree or higher
Race/ethnicity:
- Black or African American alone
- American Indian and Alaska Native alone
- Asian alone
- Native Hawaiian and Other Pacific Islander alone
- Some other race
- Two or more
- White alone, not Hispanic or Latino
- Hispanic or Latino
Sex: male or female
These groupings mean there are estimates for all the group intersections, or cross tabs. For example, Black or African American females who hold a bachelor’s degree or higher.
Additionally, there are estimates of more detailed educational attainment breakdowns by sex for the entire adult population:
- high school graduate
- some college, less than 1 year
- some college, 1 or more years, no degree
- Associate’s degree
- Bachelor’s degree
- Master’s degree
- Professional degree beyond bachelor’s
- Doctorate degree
 of adults age 25+ hold a bachelor's degree, an estimated 2,216,349 (+/- 11,163) people. Bar graph of percent of adults (25+) who hold a bachelor's degree by race/ethnicity. Cursor is hovering over the bar for Percent of Hispanic or Latino population 25 years and over with a bachelor's degree or higher: 21.6%.")
This level of detail can answer specific questions such as:
Which communities or school districts would benefit from education funding programs?
How do education levels differ between females and males?
How do education levels differ between different race/ethnicity groups?

Educational Attainment by Race by Sex adds to the existing available Education topics currently in Living Atlas, which include additional breakdowns by veteran status, housing tenure, and internet access.
Specific Language by English Ability
Specific Language by English Ability shows language or language groups spoken at home by English ability. This can be useful for emergency response scenarios enabling organizations such as the Red Cross to communicate effectively with both English and non-English speakers.
This layer has seven specific languages:
- Spanish
- French, Haitian, or Cajun
- Korean
- Chinese (including Mandarin and Cantonese)
- Vietnamese
- Tagalog (including Filipino)
- Arabic
In addition to these seven, there are five other language groupings:
- German or other West Germanic
- Russian, Polish, or other Slavic
- Other Indo-European (such as Italian or Portuguese)
- Other Asian and Pacific Island (such as Japanese or Hmong)
- Other and unspecified (such as Navajo or Hebrew)
All language and language groupings also have estimates of those who speak English very well vs. those who speak English less than very well. We have included additional Esri calculated counts and percentages of those who speak English very well (Bilingual in English and another language) and those who speak English less than very well (have limited English ability).
 are bilingual in English and another language, an estimated 9,894,273 (+/- 31,331) individuals. The top groups here are: Spanish, Chinese (including Mandarin, Cantonese), other Indo-European languages. Another 17.2% have limited English ability, and 56.1% speak English only. (pie chart).")
This layer can help answer questions such as:
How many people need emergency warnings in a language other than English?
What is the most common language spoken in an area by those who speak English less than very well?
Where are areas where select languages must be included for voting materials?
.")
Specific Language by English Ability adds to the existing available Language topics currently in Living Atlas, which include additional breakdowns by language spoken at home, linguistic isolation, and emergency response. It also replaces an older version of this data from 2011-2015.
We love to hear from you!
If you have questions about the layers, visit our FAQ, or post on Esri Community’s Living Atlas space. You can also learn more about the layers in this blog. And as always, let us know what additional Census tables or topics you would like to see in ArcGIS Living Atlas.


Article Discussion: