The 2017-2021 American Community Survey (ACS) five-year estimates are now available within ArcGIS Living Atlas. These ready-to-use layers save GIS users many hours of download and data processing time, and empower people to instantly begin to explore, map and analyze the data at state, county and tract levels. The layers can also be downloaded if needed.
The Census ACS enables local officials, businesses, and researchers to understand what’s taking place in their communities and helps community programs allocate resources. This data determines how $675 billion dollars in federal and state spending are spent each year, so access to the latest available data is critical. Census ACS data is used by everyone from regional planners and program administrators to entrepreneurs and big companies looking for their next location to set up shop, something that can lead to more local jobs.
Since 2018, Esri’s Living Atlas Policy Mapping team provides to the GIS community a set of free layers that contain a wealth of data from the U.S. Census Bureau’s American Community Survey (ACS). On December 8th, 2022, Census released its updated five-year estimates (2017-2021). Within days of that release, the Policy Mapping team updated the ACS layers already available in Living Atlas with the newest figures. Maps and apps that already use these layers will automatically reflect the most recent Census ACS data.
Access the Latest Census ACS Data
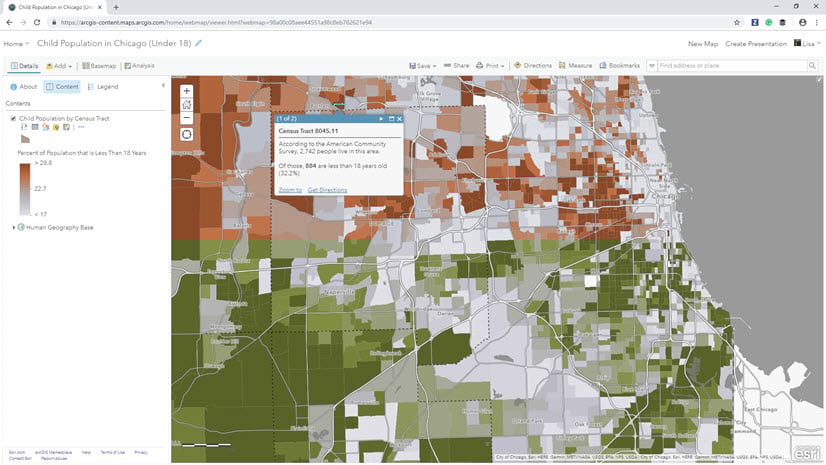
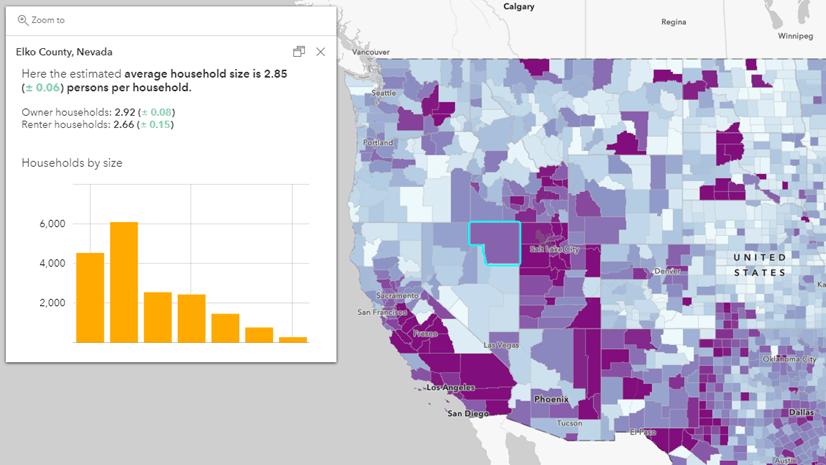
The Census ACS layers in Living Atlas cover a wide range of topics on housing, income, internet access, education, disability, health insurance, and more. These layers contain data for states, counties, and census tracts. More than 100 layers are available, each focusing on a specific topic. Each layer already shows an interesting subject on the map, with an informative pop-up so that you can immediately see important patterns anywhere within the U.S. or Puerto Rico. You can also easily use the layers to create your own customized web maps and applications to tell an endless number of stories about the population or housing in your area.
Additional benefits to these layers:
- They are free to use and require no login or credits.
- They are sourced directly from the U.S. Census Bureau API.
- Source table names are indicated.
- The original Census field names are used throughout.
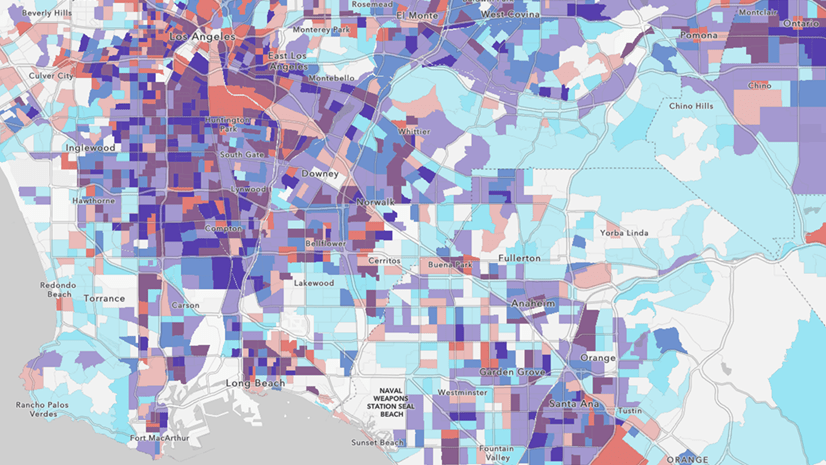
- The boundaries are trimmed along coastlines, lakes and major rivers to enable cartographically pleasing maps of Census data.
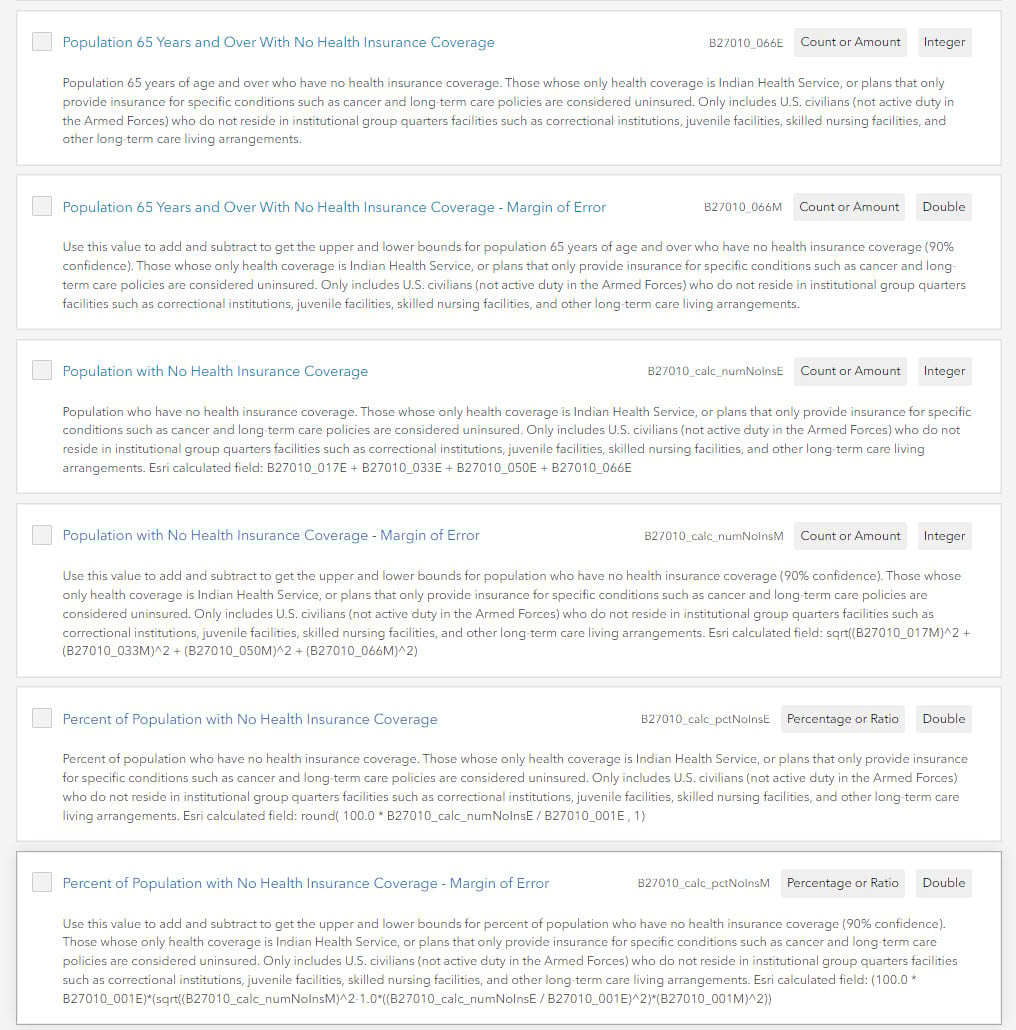
- Additional attributes are already calculated for your convenience, such as percentages and their related margins of error.
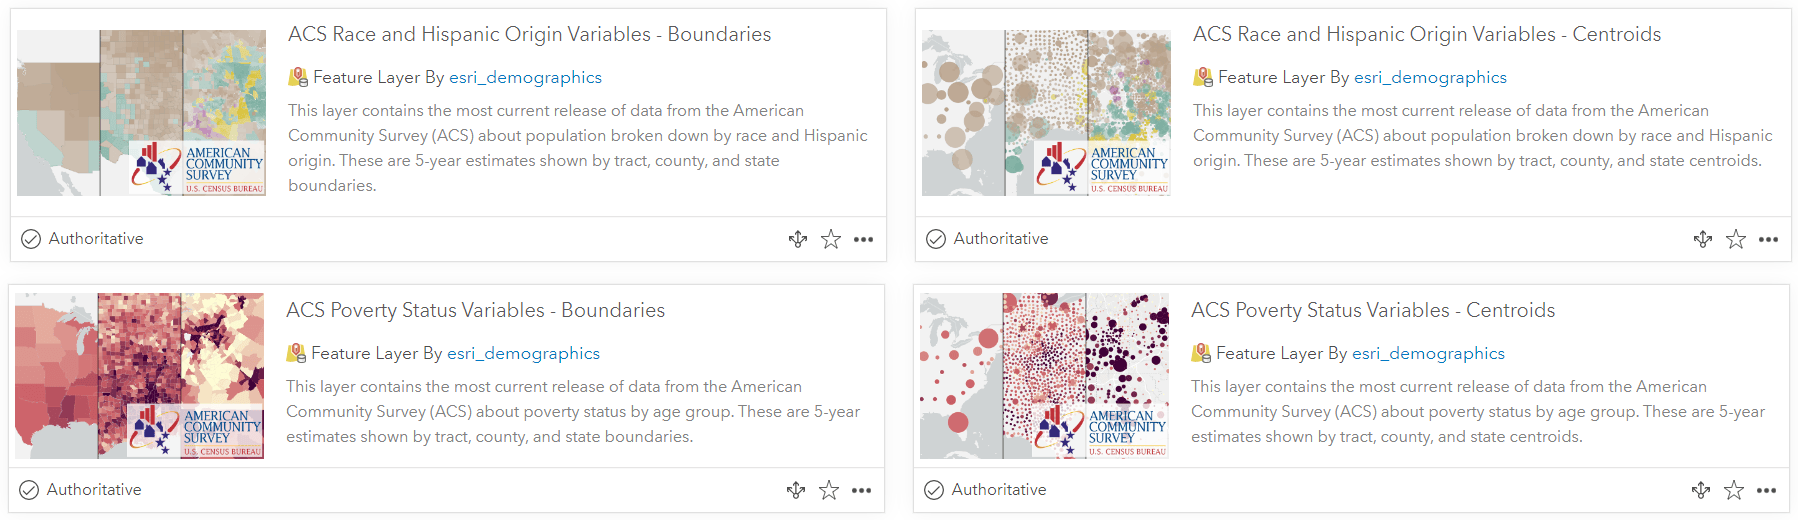
- Each layer is provided two ways: as a polygon layer as well as a centroids layer so that GIS users can choose two ways to map and query the demographic data.
- Each field is fully documented with a human-readable field alias and a long field description that explains what the field is. This information is sourced directly from Census metadata documents. By adding this information directly into the service, all GIS users have access to it from within ArcGIS products and can know what a field means without having to go find up a metadata document.
Additional Tables Added
To meet customer needs, additional tables were added to the Race and Hispanic Origin layers and Poverty Status layers. These include highly requested fields such as Hispanic Black and individuals with income that is 200% of poverty level. These fields provide a more detailed look at Hispanic or Latino populations. Poverty ratios are useful in high-cost areas where federal poverty levels do not accurately reflect actual cost of living.
Enhancements Just Released
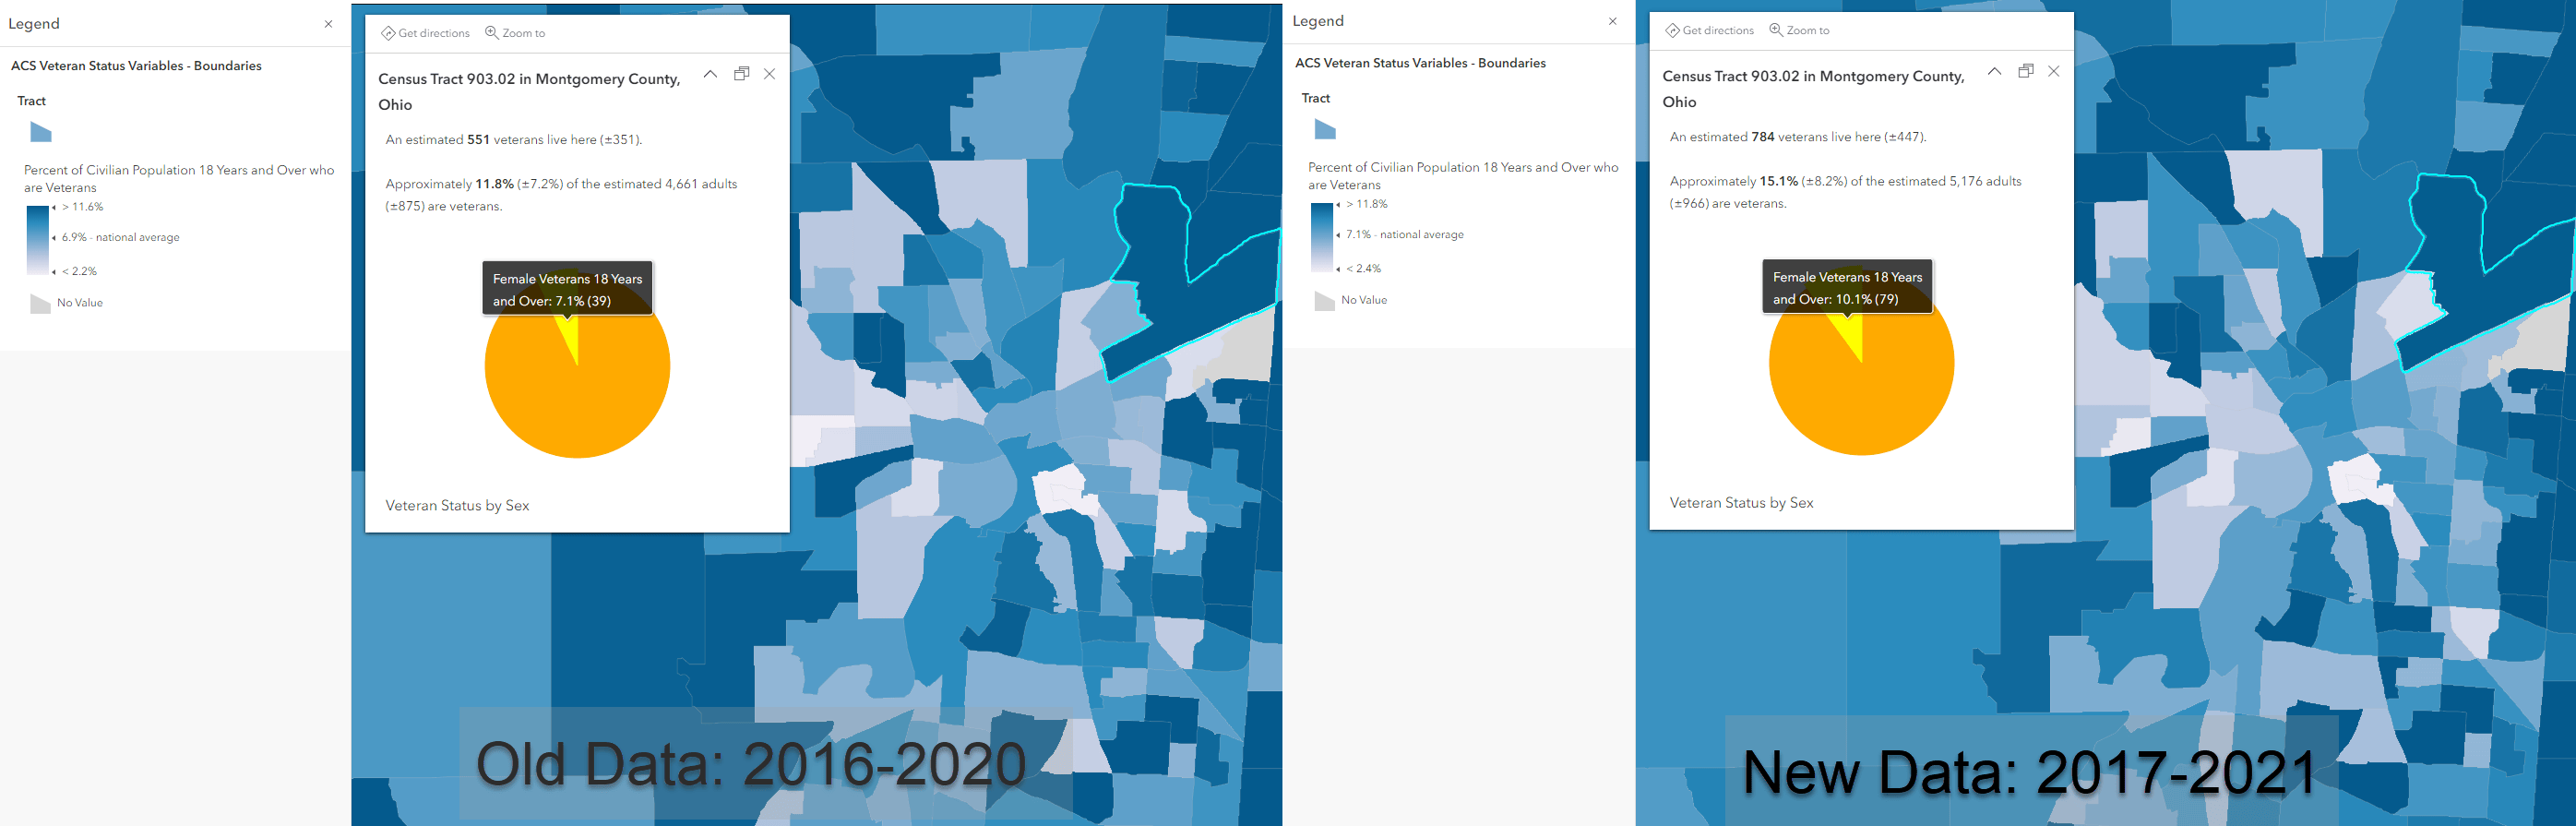
- New data – The layers now contain the most current 5-year estimates offered by the U.S. Census Bureau. They now show 2017-2021 vintage estimates.
- Updated cartography – Many of the layers had their cartography adjusted to highlight the newest national rate of the attribute being mapped. For layers with this update, the legend clearly states the national figure, helping create reference for the map reader.
- New boundaries – The boundaries layers always reflect the current TIGER boundaries that match the newest Census ACS figures. In this update, the 2021 TIGER boundaries are used in the layers. 2020 areal hydrography sourced from Census was used to shoreline polygons near the ocean, Great Lakes and selected other water bodies.
- Updated margins of error (MOEs) – All layers show MOEs in the pop-ups. By putting the MOEs subtly in the pop-ups, anyone can see the MOEs when needed, while those who are only interested in the estimates still see the layers’ symbology and pop-up as they’ve come to expect. For more information on MOEs, we created a Learn Path full of resources that walk through different ways to incorporate margins of error (MOEs) into maps.
Get started using these layers today
The American Community Survey (ACS) helps local officials, community leaders, and businesses understand the changes taking place in their communities. The ACS layers in Living Atlas provide many of the popular variables directly within the ArcGIS platform. Being able to access these brand-new data values directly within Living Atlas makes it easy to start understanding the changes taking place in your community or areas of interest through maps and further analysis.
Find the layers in ArcGIS Online:
Learn where to find these layers and start using them within your mapping and analysis workflows. Check out this story map to learn how.
Get started:
Learn how to make a map about your community in four easy steps in this blog. You’ll have your own web map of your area in minutes!
Update your existing ACS maps:
When the new ACS figures are released by the Census and updated in Living Atlas, it’s time for you to check your web maps that use one of these ACS layers to see where you need to make updates to your map’s symbology and pop-ups. If you are using an ACS layer from Living Atlas and have not modified it at all, then you will appreciate knowing that your layer has already been updated, with new data, updated symbology, and updated pop-ups.
If you are using an ACS layer from Living Atlas and have modified its symbology, pop-ups, etc., you’ll appreciate that the data has been updated, but your symbology and pop-ups kept your modifications. To confirm, check out the layer properties in Map Viewer to see what properties are stored in the source layer or stored in the web map. The attribute data in the latest five-year ACS layers changes each December and is automatically reflected in existing maps. After this release, verify that your map’s symbology breakpoints and pop-ups still make sense with the updated data.
Important Changes to Note in Your Maps:
Changes may be particularly noticeable for any currency values such as earnings, income, median contract rent, and median home value maps. See this blog on inflation to understand how your maps may be affected.
For maps that use the Housing Units by Year Built layers, there are six attribute fields with updated categories of year built at the top end of the distribution. For example, the field that was previously “Housing units built 2014 or later” is now “Housing units built 2020 or later.” Aliases have been updated to reflect the new categories for these six fields and their associated MOE fields. Read more about this change at census.gov.
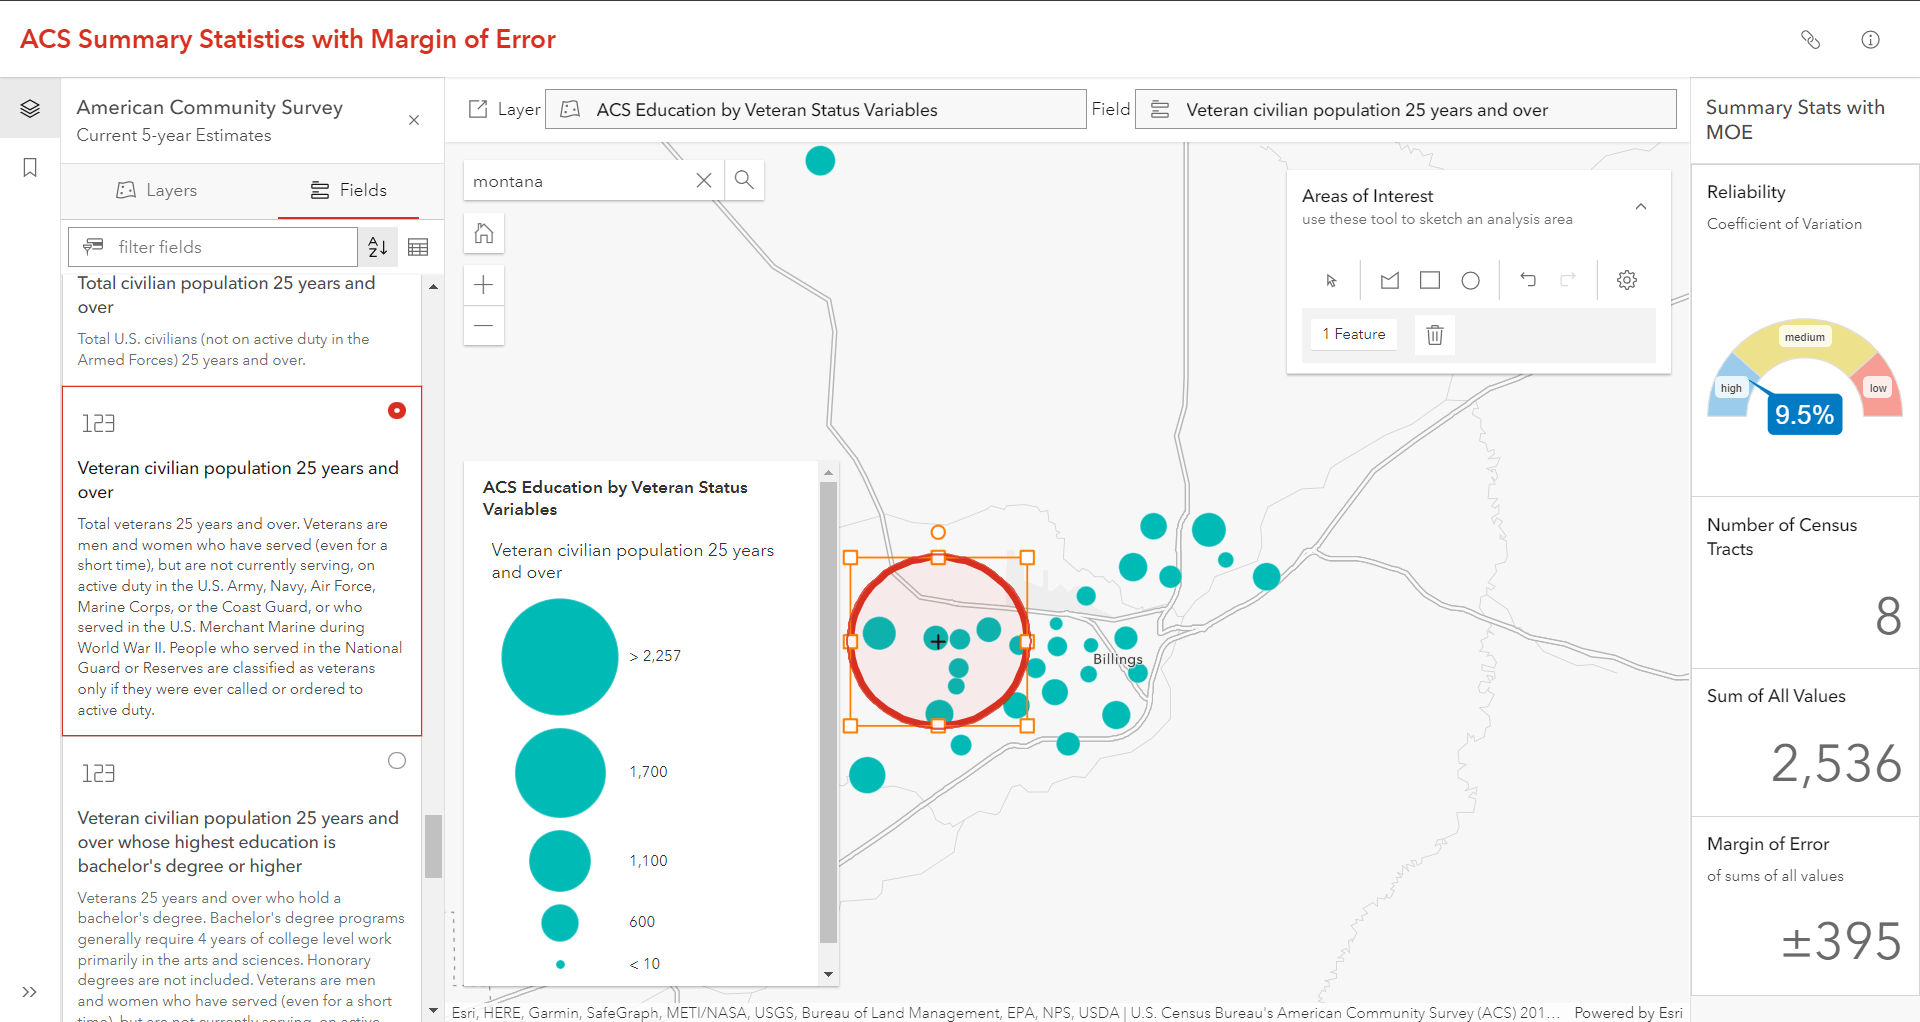
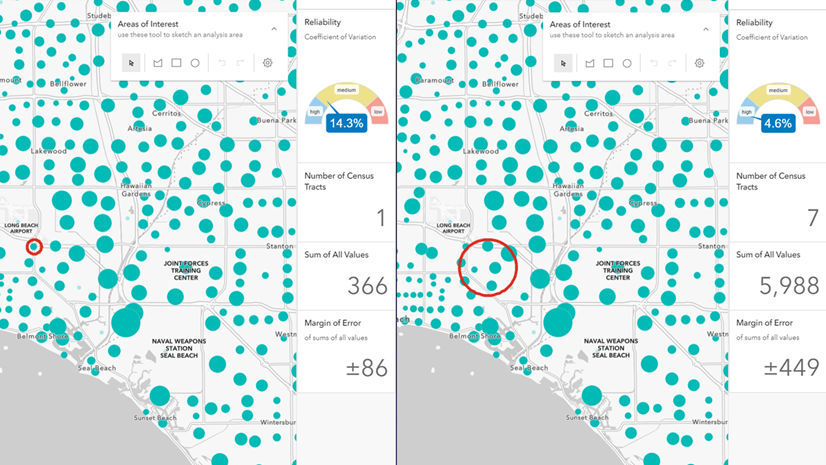
Understand and use Margins of Error:
We created a Learn Path full of resources that walk through different ways to incorporate margins of error (MOEs) into maps. Recently released, this lightweight app helps you get a quick sense of how reliable estimates are for each tract, and how they become more reliable as you aggregate tracts using the boundary of a neighborhood or other shape. Check out this blog to learn more.
Questions?
If you have questions about the layers, visit our FAQ, or post on Esri Community’s Living Atlas space. You can also learn more about the layers in this blog.


Article Discussion: