Often times you will find that layers you own, and especially layers you don’t own, don’t meet all of your mapping needs. You may want to calculate your own fields, spruce up the pop-ups with data from additional layers, or summarize your data based on geometry. You could copy datasets and then join them, producing a third dataset you now have to manage. Instead, you could use ArcGIS Arcade, a scripting language that allows you to calculate new data values on-the-fly.
ArcGIS Living Atlas of the World contains U.S. Census Bureau American Community Survey (ACS) layers that are quick and easy to use when mapping demographic topics in the U.S. Combining Arcade and ACS layers can save time, and enhances the potential of your maps.
This blog will go over five ways Arcade enhances your American Community Survey maps.
Jump to a section:
- What exactly is Arcade?
- Construct New Values to Map
- Spruce Up Your Pop-ups
- Writing Conditional Statements
- Bring In Data From Other Layers
- Using Geometry Functions to Provide Spatial Context
More about ACS Living Atlas Layers
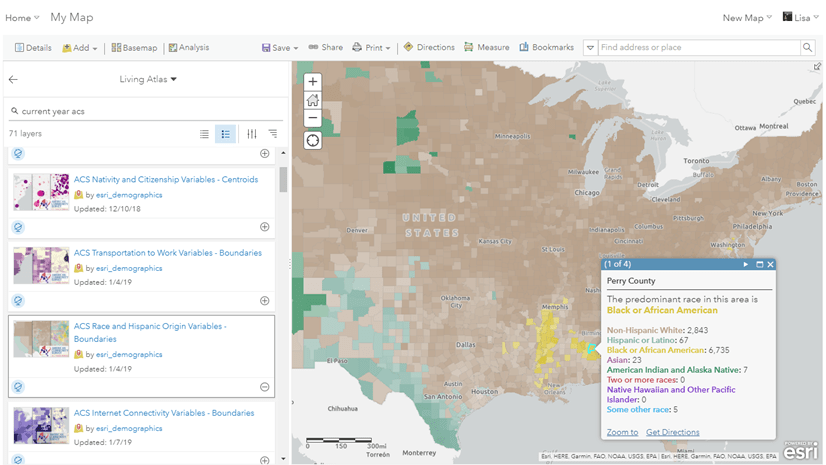
The US Census Bureau provides a lot of interesting data points in their American Community Survey (ACS) from social, economic, housing, and demographic characteristics about our nation’s population every year. This data can be used to make important public and business decisions to more clearly identify issues and opportunities and more effectively allocate scarce resources to address them.
- ArcGIS Living Atlas of the World contains layers of the most current ACS 5-year estimates that are curated, free to use, and ready to go.
- The layers are updated annually to reflect the most current data values and geographical boundaries.
- The layers contain data for state, county, and census tract geographies.
- Each layer contains single or multiple ACS tables, grouped by topic. Each topic is available as boundaries and centroids.
- Many layers include pre-calculated fields such as sums and percentages.
- Coastlines and water features are clipped out for your cartographic needs.
- Field aliases and long descriptions bring metadata directly into the user experience.
What exactly is Arcade?
Arcade is a portable, lightweight, and secure expression language written for use in the ArcGIS platform. Like other expression languages, it can perform mathematical calculations, manipulate text, and evaluate logical statements. It also supports multi-statement expressions, variables, and flow control statements. Arcade was designed specifically for creating custom visualizations and labeling expressions in the ArcGIS Platform. It allows users to write, share, and execute custom expressions in ArcGIS Pro, ArcGIS Runtime, ArcGIS Online, and the ArcGIS API for JavaScript.
Arcade allows you to access feature geometry, store constants and variables, and provide access to attribute values. You can utilize Arcade and its wide functionality to calculate new data-driven values. For example:
- Basic calculations (ex: calculating a percent)
- Use functions (ex: absolute value, round, logical statements, etc)
- Create an index or ratio (ex: land improvement layer)
- Text manipulation (ex: hurricane labels)
- Use geometry-based functions (ex: Population Density, buffer, how many things are within a distance of me)
- Data cleanup (ex: fixing incorrect values or mis-typed field values)
If you’re brand new to Arcade, follow this blog for a thorough FAQ on ArcGIS Arcade.
Construct New Values to Map
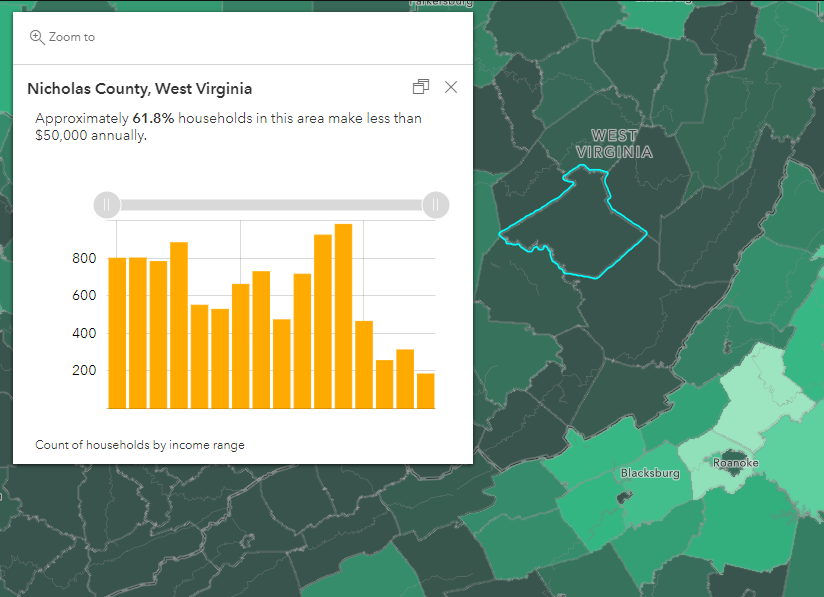
A lot of valuable fields are given in ACS data, but often times you may want to combine fields and construct new values to map. For instance, if you would like to map a percentage of households whose income was below $50,000, you could use the ACS Household Income Distribution Variables layer in Living Atlas of the World and Arcade to calculate this attribute on-the-fly.
The Census offers the count of households within different income ranges like 0 to $14,999, $15,000 to $20,000, and more. But if you want to combine those fields to learn about the households making under $50,000, Arcade allows you to combine the different attributes and normalize them into a percentage.
var Percent_Below_50k = round((($feature["B19001_002E"] +
$feature["B19001_003E"] + $feature["B19001_004E"] +
$feature["B19001_004E"] + $feature["B19001_005E"] +
$feature["B19001_006E"] + $feature["B19001_007E"] +
$feature["B19001_008E"] + $feature["B19001_009E"]) +
$feature["B19001_010E"]) / ($feature["B19001_001E"])*100,1)return Percent_Below_50k
Spruce Up Your Pop-ups
Arcade allows you to quickly add new information to your pop-ups, such as any new calculated fields, like the one above, as well as writing conditional statements to make statements about your data. Additionally, Arcade allows you to bring in information from another layer, using FeatureSets, without having to run any join function.
From the calculated field above, we can simply copy/paste the Arcade expression into a new expressions in the pop-up panel, and re-create the percentage of households whose income was below $50,000.
Writing Conditional Statements
There are many ways to write if/else logic (conditional statements) in Arcade. Writing logic methods are useful for checking for empty values, using if-else logic, and implementing switch-case statements among others.
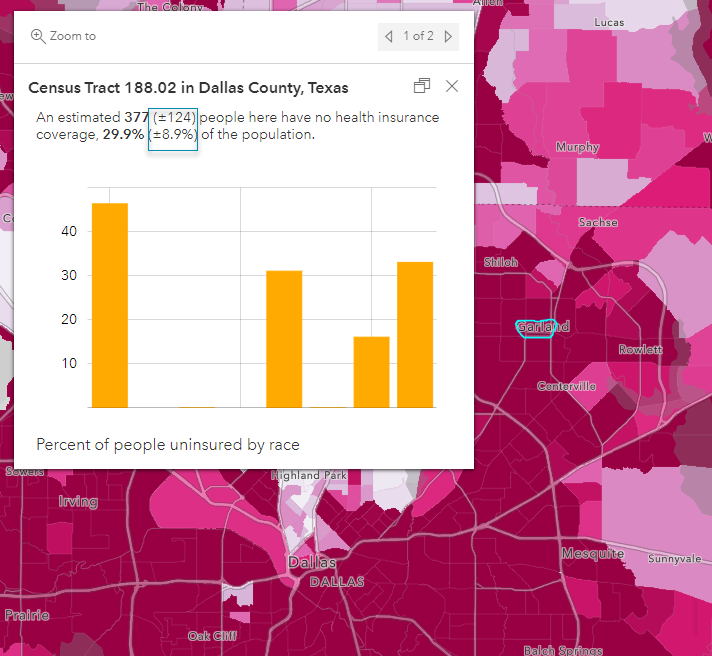
All of the ACS layers in Living Atlas of the World contain margins of error fields and are displayed in their pop-ups. For example, this pop-up from the ACS Health Insurance by Age by Race Variables layer shows the margin of error for those without health insurance.
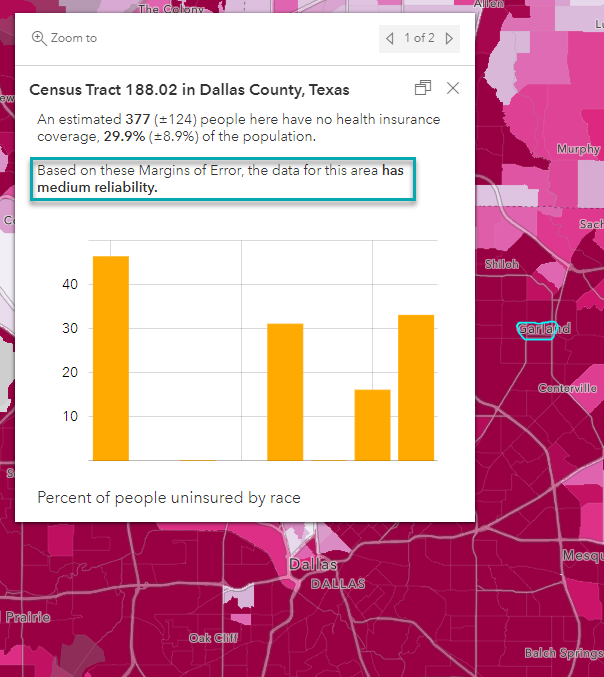
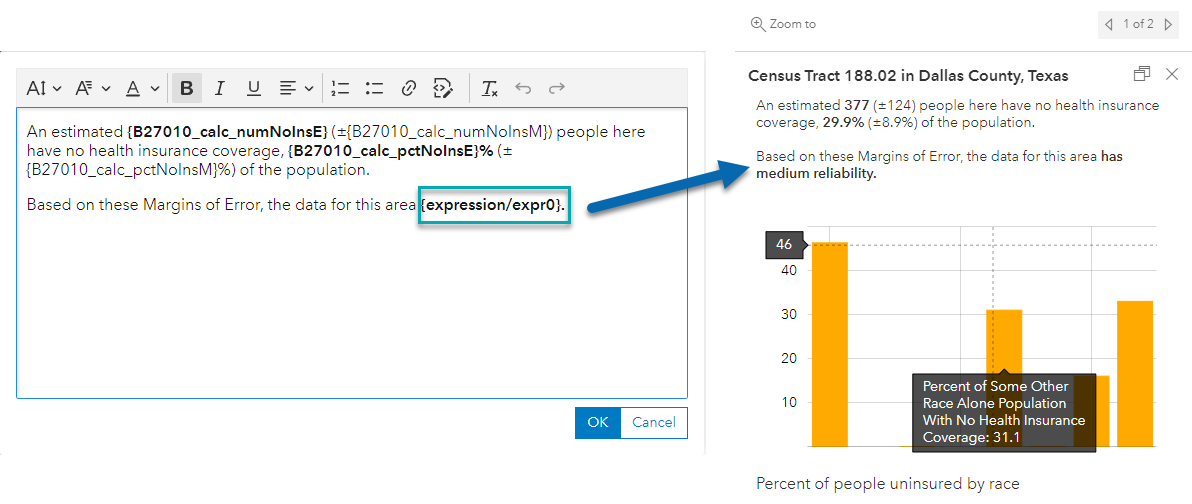
You can write logical statements in Arcade to determine whether or not a given census geography has reliable estimates for any given attribute by using the associated margin of error. The images below show the final pop-up, as well as the accompanying expression used to create this statement. The example below uses a When () function, which evaluates a series of conditional expressions until one evaluates to true.
For and in-depth walkthrough on using Arcade to write statements for margins of error, view this blog.
//Margin of Error Reliability Statement
var estimate = $feature.B27010_calc_numNoInsE
var moe = $feature.B27010_calc_numNoInsM
var cv = ((moe/1.645)/estimate)*100When(cv 12 && cv = 40, "has low reliability",
IsEmpty(moe) || estimate == 0, "does not have enough information to determine reliability", "")
Bring In Data From Other Layers
Often times you’ll want to add additional information into your pop-up that resides in another layer. You could join the layers of interest together, but that requires additional time, credits, and some additional work. That’s where the FeatureSets capability comes in with Arcade.
FeatureSets are a set of Arcade data functions you can use with feature layers. FeatureSets let you work with multiple features in a layer and can be used when authoring a pop-up or when calculating fields.
For a more detailed walkthrough of FeatureSets, visit this blog.
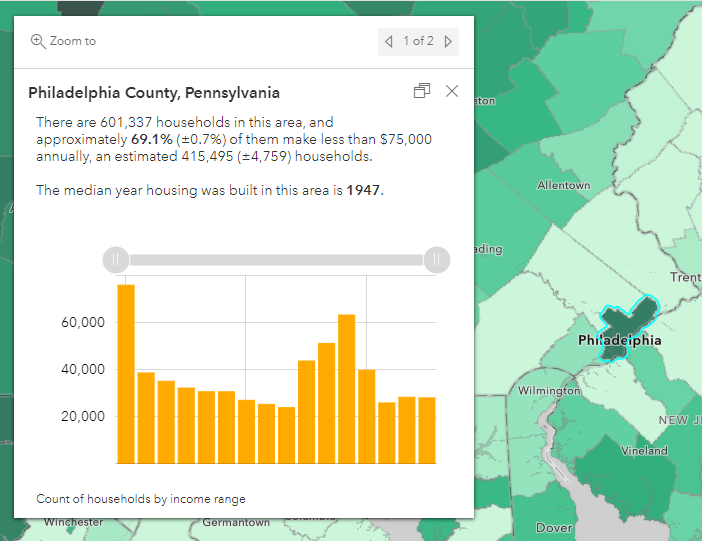
In the example below, we are using FeatureSets to bring in data from one ACS layer to another. Namely, we’re bringing in data from the ACS Housing Units by Year Built Variables layer to the ACS Housing Costs Variables layer to bring in context about the median age of housing to our households by income map.
The example below uses the FIPS/GEOID field to find the matching record from the similar layer. This is an attribute-driven approach that is a lot like a join, where the two tables have a corresponding value. Once the FeatureSet knows which record to access from the other layer, you are retrieving a data value from that table and adding it into your pop-up. When retrieving data from a layer within your web map, you use use the FeatureSet function and access data with $map. If you’re retrieving data when the layer isn’t in your map, you the use FeatureSetbyPortalItem function instead.
For further explanation on how FeaturSets work, follow the following resources:
- FeatureSets
- Pump up Your Pop-ups With Arcade FeatureSets and the Living Atlas
- Pump up Your Pop-ups With Arcade FeatureSets and Living Atlas (Part 2)
- Can Layers Talk to Each Other?
//Featureset expression for Housing Built Year
var fips = $feature.GEOID
var ACS = FeatureSetId($map, /* ACS Housing Units by Year Built Variables - Boundaries - County */ "17da5533f74-layer-55")
var filterStatement = "GEOID = @fips"
var county = First(Filter(ACS, filterStatement))
return county.B20535_001E
Using Geometry Functions to Provide Spatial Context
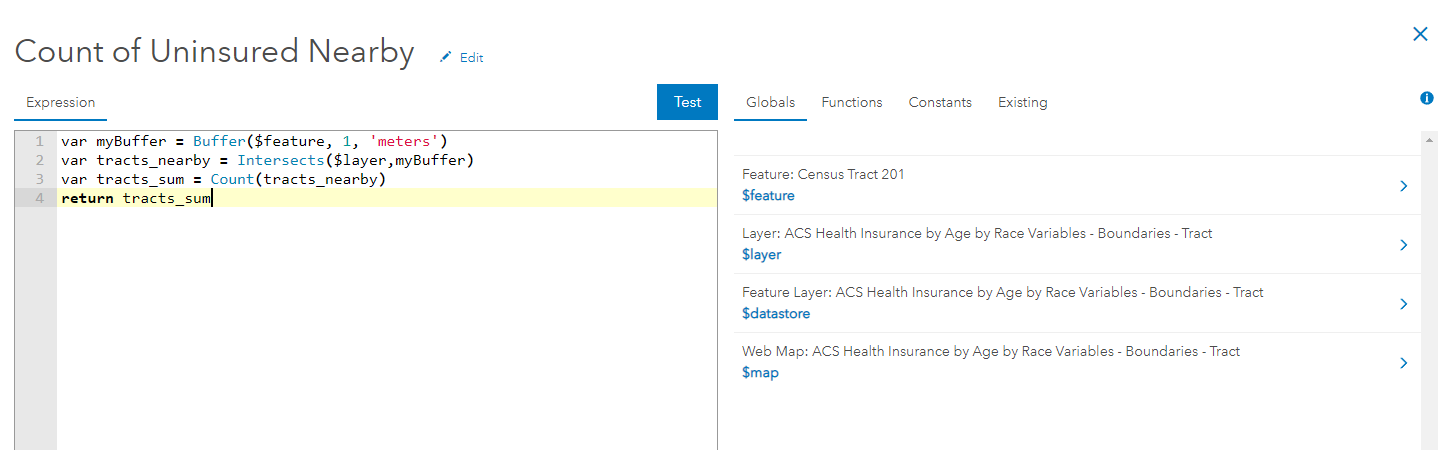
All of the above uses of Arcade are pretty awesome, but where’s the spatial in geospatial with using Arcade? Well fear not, as Arcade allows you to use geometry functions such as Spatial Union, Intersection, Clip, Buffer, Overlaps, and more of your favorite spatial relationships.
For a more detailed walkthrough of geometry functions using Arcade, visit this blog.
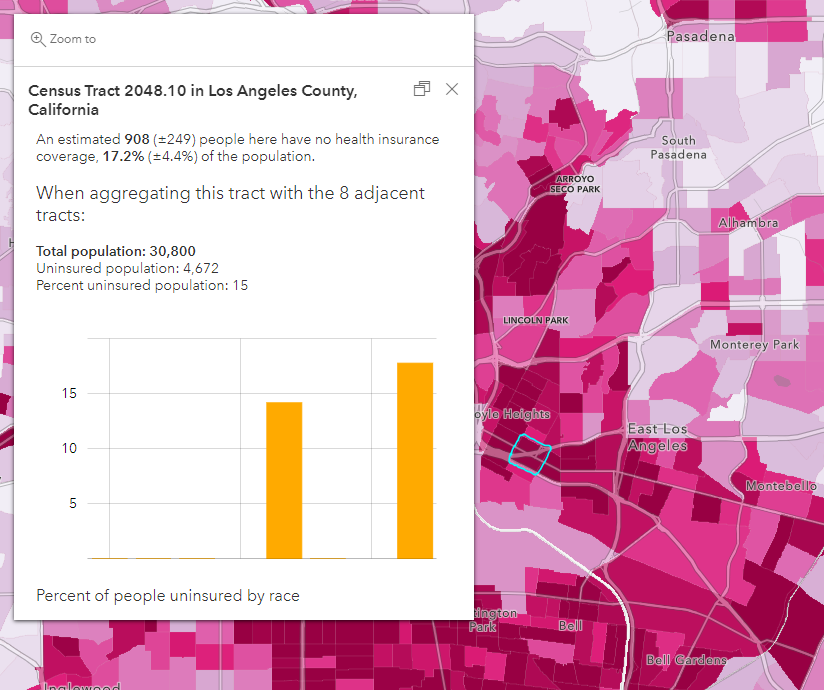
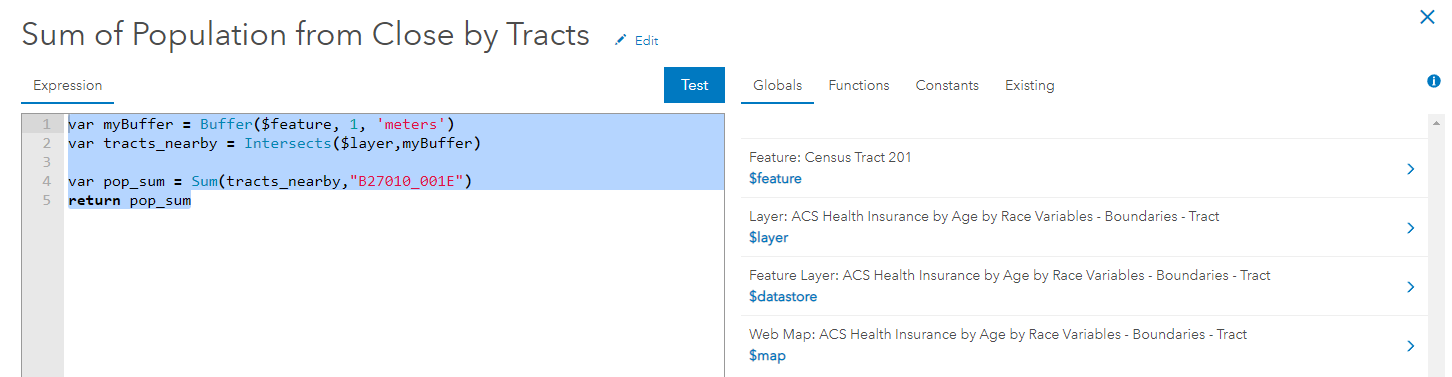
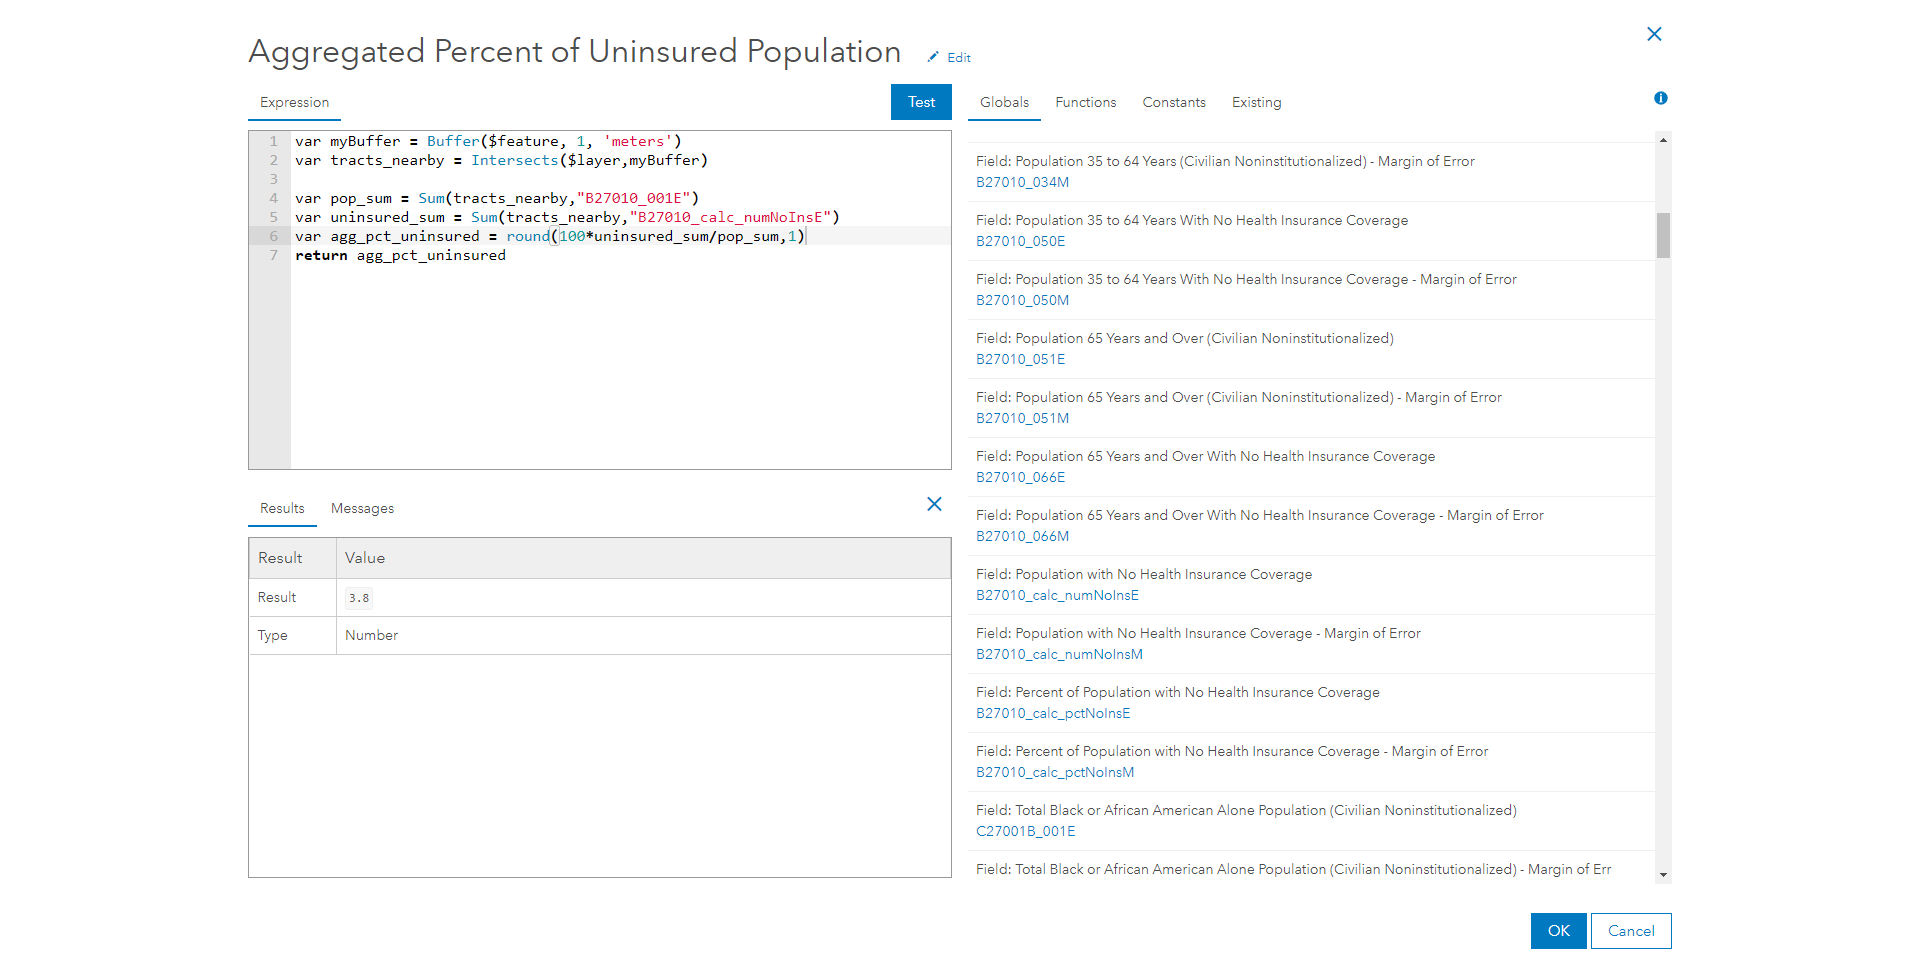
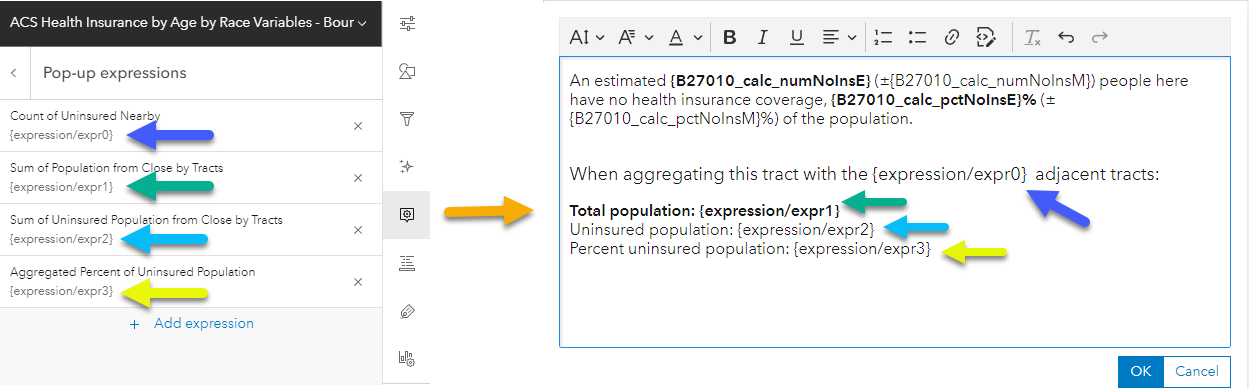
For instance, we often want to aggregate areas based off of an area of interest, such as a buffered area. When dealing with margins of errors in ACS, we may want to aggregate surrounding census tracts with one another in order to get values that are more reliable. The images below show the final pop-up, as well as the accompanying expression used to create this statement.
These are just some of the many ways that Arcade can elevate your ACS layers, as well as any feature layer. Whether its calculating a new field to map your attribute of interest, sprucing up your pop-up with newly calculated fields and conditional statements, or bring in additional layers and displaying spatial relationships, using Arcade for your ACS data makes working with ArcGIS Online, Pro, Dashboards, and all of the different web applications easier than ever.
View the related content at the bottom to further expand your knowledge of Arcade.


Article Discussion: