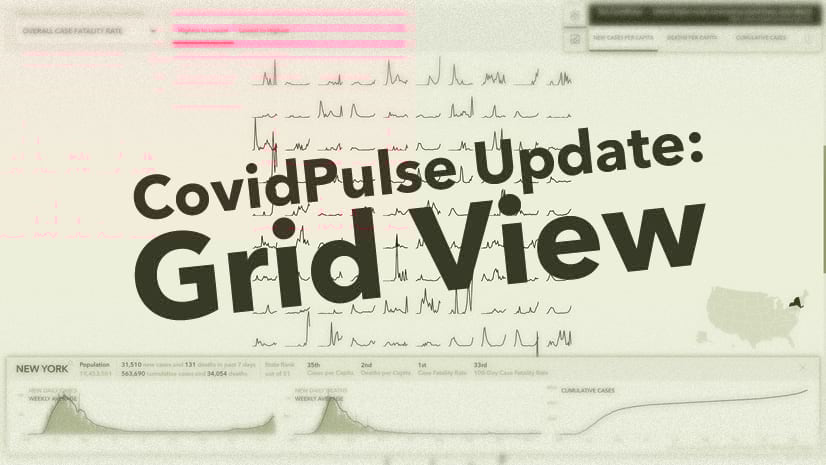
Introducing UnemploymentPulse!

Modeled after CovidPulse‘s use of sparkline map symbols, and using the regularly-updated Living Atlas layer of unemployment (sourced from the Bureau of Labor and Statistics monthly numbers), UnemploymentPulse visualizes a moving 14-month window of unemployment data at the state and county level, and shows them alongside national rates for comparison.
Unemployment is ever-changing, and it can be beneficial to see the meandering ups and downs as it shifts through time in addition to the latest rates. These rates are given much more meaning when viewed in light of the recent past, with trends of neighboring areas, and compared to a national baseline. All of this context provides a fuller terrain for understanding.
Click state or county to learn all kinds of other information. Compare this month’s rate to last month’s, this month’s rate last year, and the 14-month high and low. See how this area ranks compared to other states or counties.
Options
There are two options for visualizing these trends. The first shows local rates of unemployment alongside national rates, for context. Orange sparklines show the state and county unemployment trend, and the light blue trend reference line behind shows the national rate’s trend for reference:

The second option shows when local rates went above or below the national rate. Holding the national rate constant, see how much a particular area’s rate diverged from the national rate:

Charted details
Select any state or county to open a dashboard-like summary:


How is the unemployment rate measured here? This rate is not based on the weekly claims data, rather the monthly unemployment rate from Bureau of Labor Statistics (BLS), generally released with about a six-week lag. Some definitions:
Unemployed: Those who have actively looked for work during the past four weeks, and are available to start work (includes new graduates and other recent entrants into the labor force, those with informal jobs, those on temporary layoff/furlough).
Labor Force: All people age 16 and older who are either employed or unemployed (either working or actively looking for work).
Unemployment rate = (those unemployed / those in labor force) * 100.
These numbers are not seasonally adjusted. The figures for the latest month are preliminary when first released and are later revised.
Rankings
Any data-drive map is really a visualization of the question, “compared to what?” For any selected area, click the “ranks” statement to show a high level comparative listing of the 10 top and bottom states and counties by unemployment:

UnemploymentPulse is a collaboration of architect Jinnan Zhang, demographer Diana Lavery, and cartographer John Nelson, and other members of the Esri Living Atlas team. Data automation was created by Lisa Berry. ArcGIS Living Atlas is a repository of curated geographic data from all sectors of the mapping community.
Find more BLS-related resources in Living Atlas here.
If you are interested in creating your own app with data-dense sparkline symbology, check out this resource.
Note: this blog was updated on August 4, 2022.


Article Discussion: