Witten with Jinnan Zhang
CovidPulse presents a massive amount of data as a simple collection of wiggly local coronavirus trends. More recently, this symbology was used to visualize unemployment trends in UnemploymentPulse.
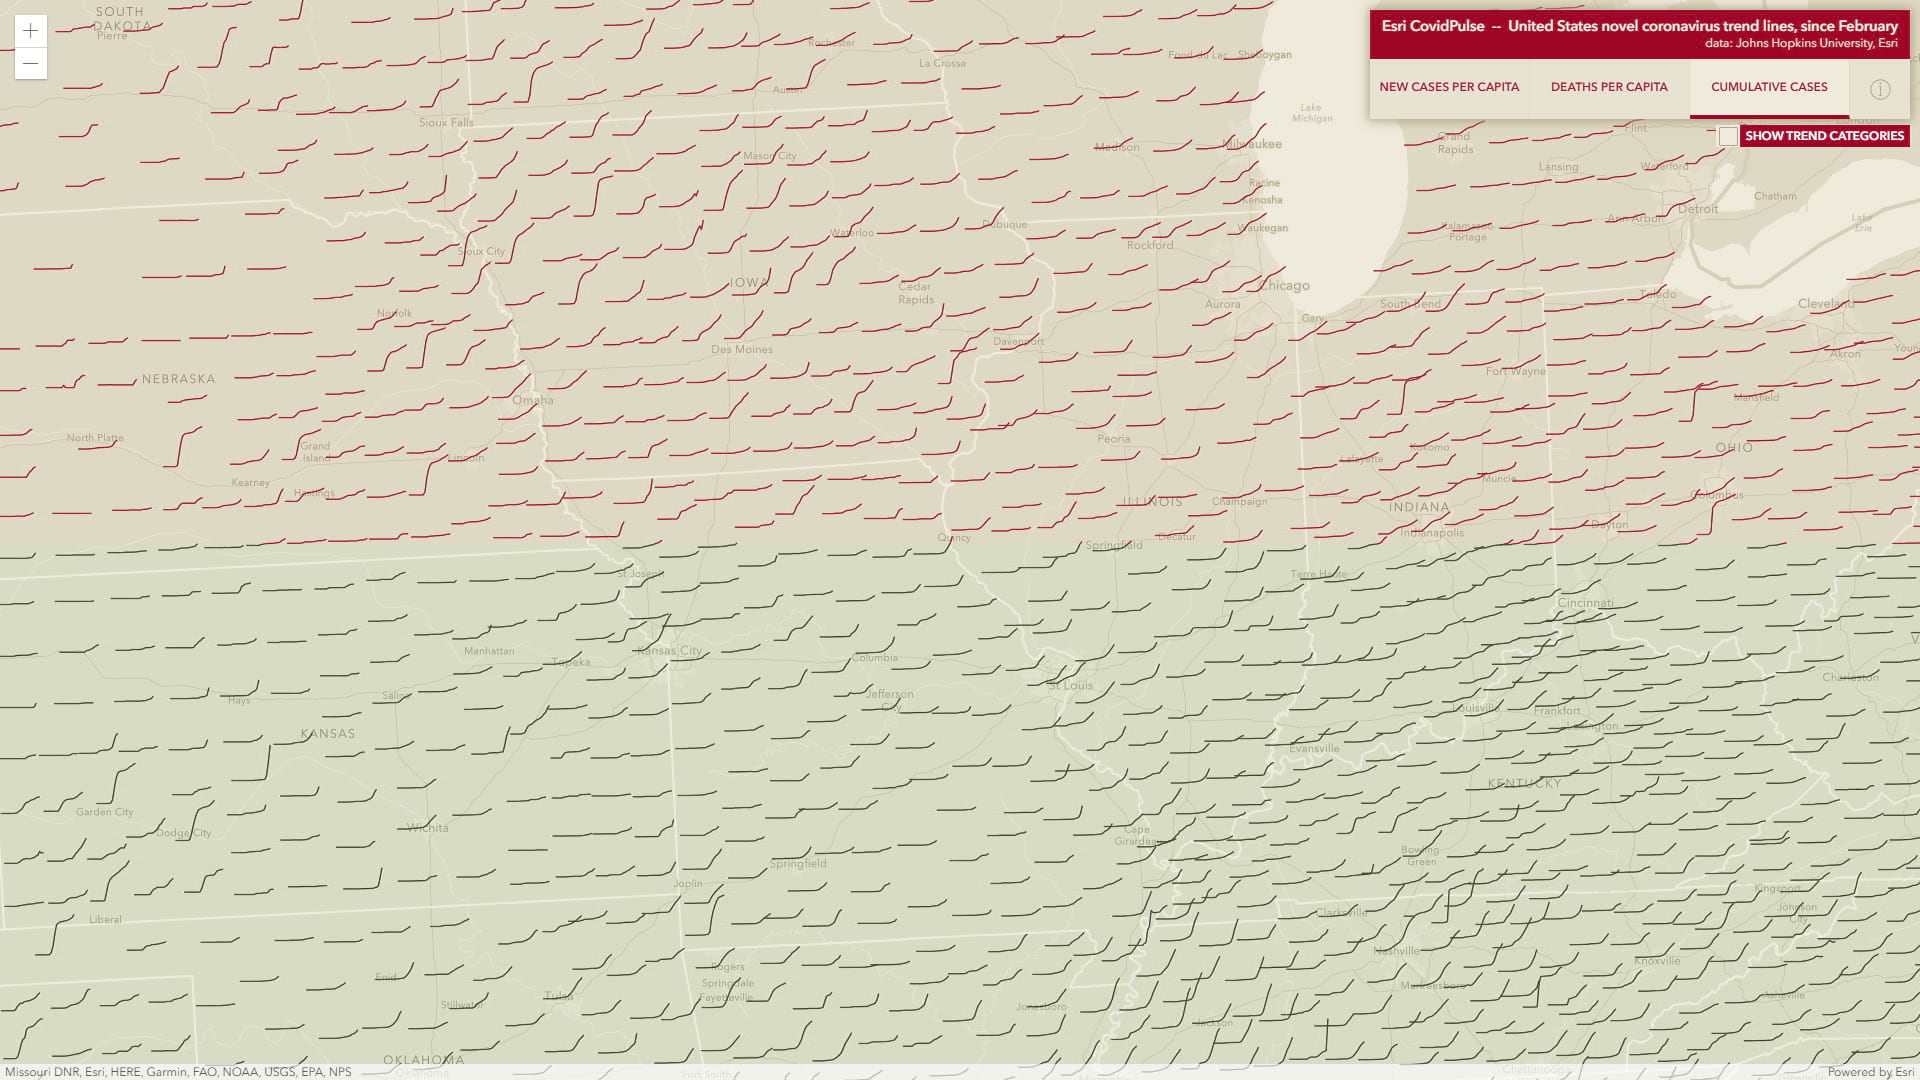

The sparkline symbol has many uses beyond this one, for sure, so we’ll share the steps taken to render the Johns Hopkins US County cases data as this interesting and data-dense visual mechanism. We hope that this will be a helpful resource for creating applications of your own with data of your own.

Here is how to render data as a sparkline in ArcGIS API for JavaScript. Specifically, we’ll be pouring sparklines into the CIMSymbol. Prepare yourself emotionally for a lot of links and snippets. But first, warm up the reverse-engineering part of your brain by disassembling and then reassembling the nearest handy Lego creation. Jinnan and I will wait. Ok, ready?
The CIMSymbol
Yes, the humble, unassuming, CIM. Never heard of it? It’s heard of you. CIM stands for Cartographic Information Model. That alone should give you shivers. But what is it?
The Cartographic Information Model is an energy field created by all living things. It surrounds us and penetrates us; it binds the galaxy together.
Originating as the model that accommodates ArcGIS Pro’s advanced symbology capabilities, the CIM is an open spec used for all sorts of mapping. It has recently been brought into the ArcGIS API for JavaScript to support mapping there.
Let’s start with this code snippet blatantly stolen from the generous CIMSymbol section of the JSAPI Doc. It shows an example of creating a triangle marker comprised of a CIMPointSymbol (a point symbol used to draw point features/graphics) containing a CIMVectorMarker (a vector marker which can represent vector graphics)…
Here’s a snapshot if you want to give your mental compiler a rest and just, like, see it.
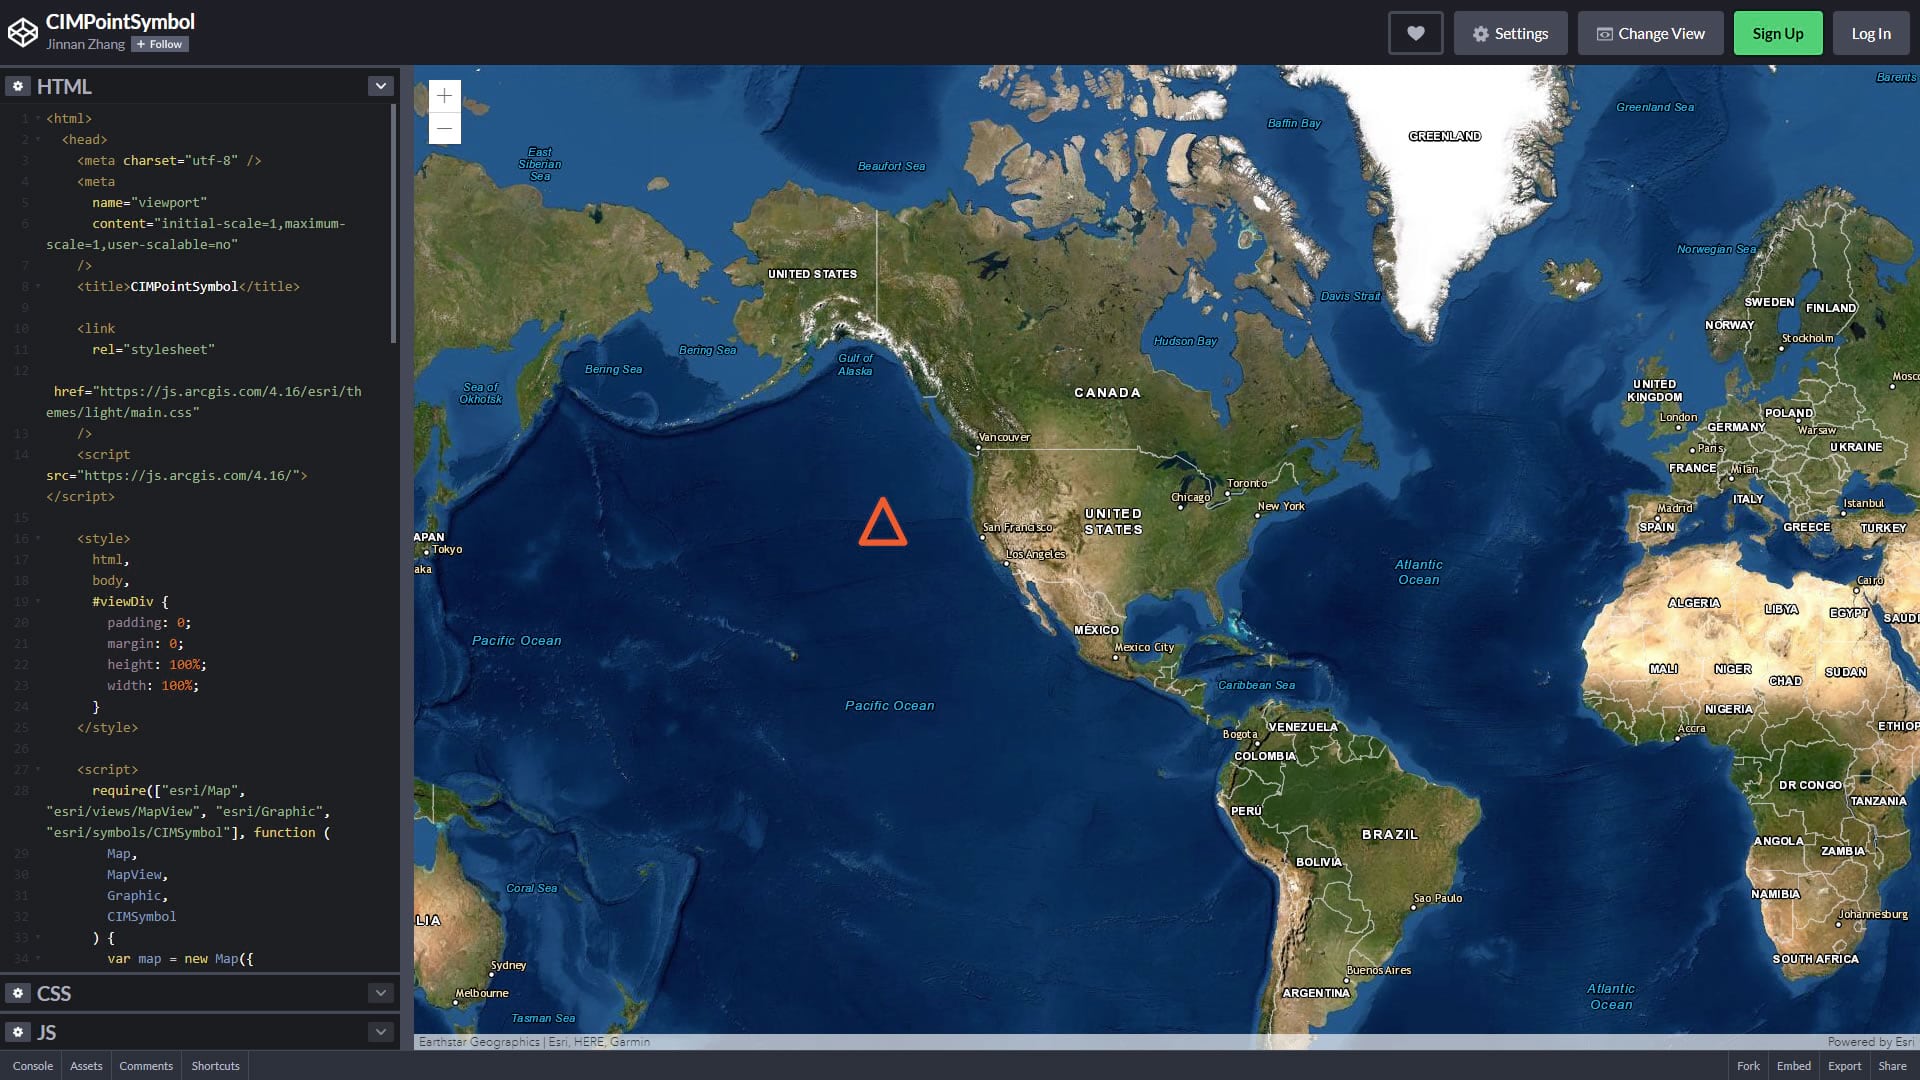
You can try it for yourself here, if you like.
Drawing Lines in a CIMSymbol
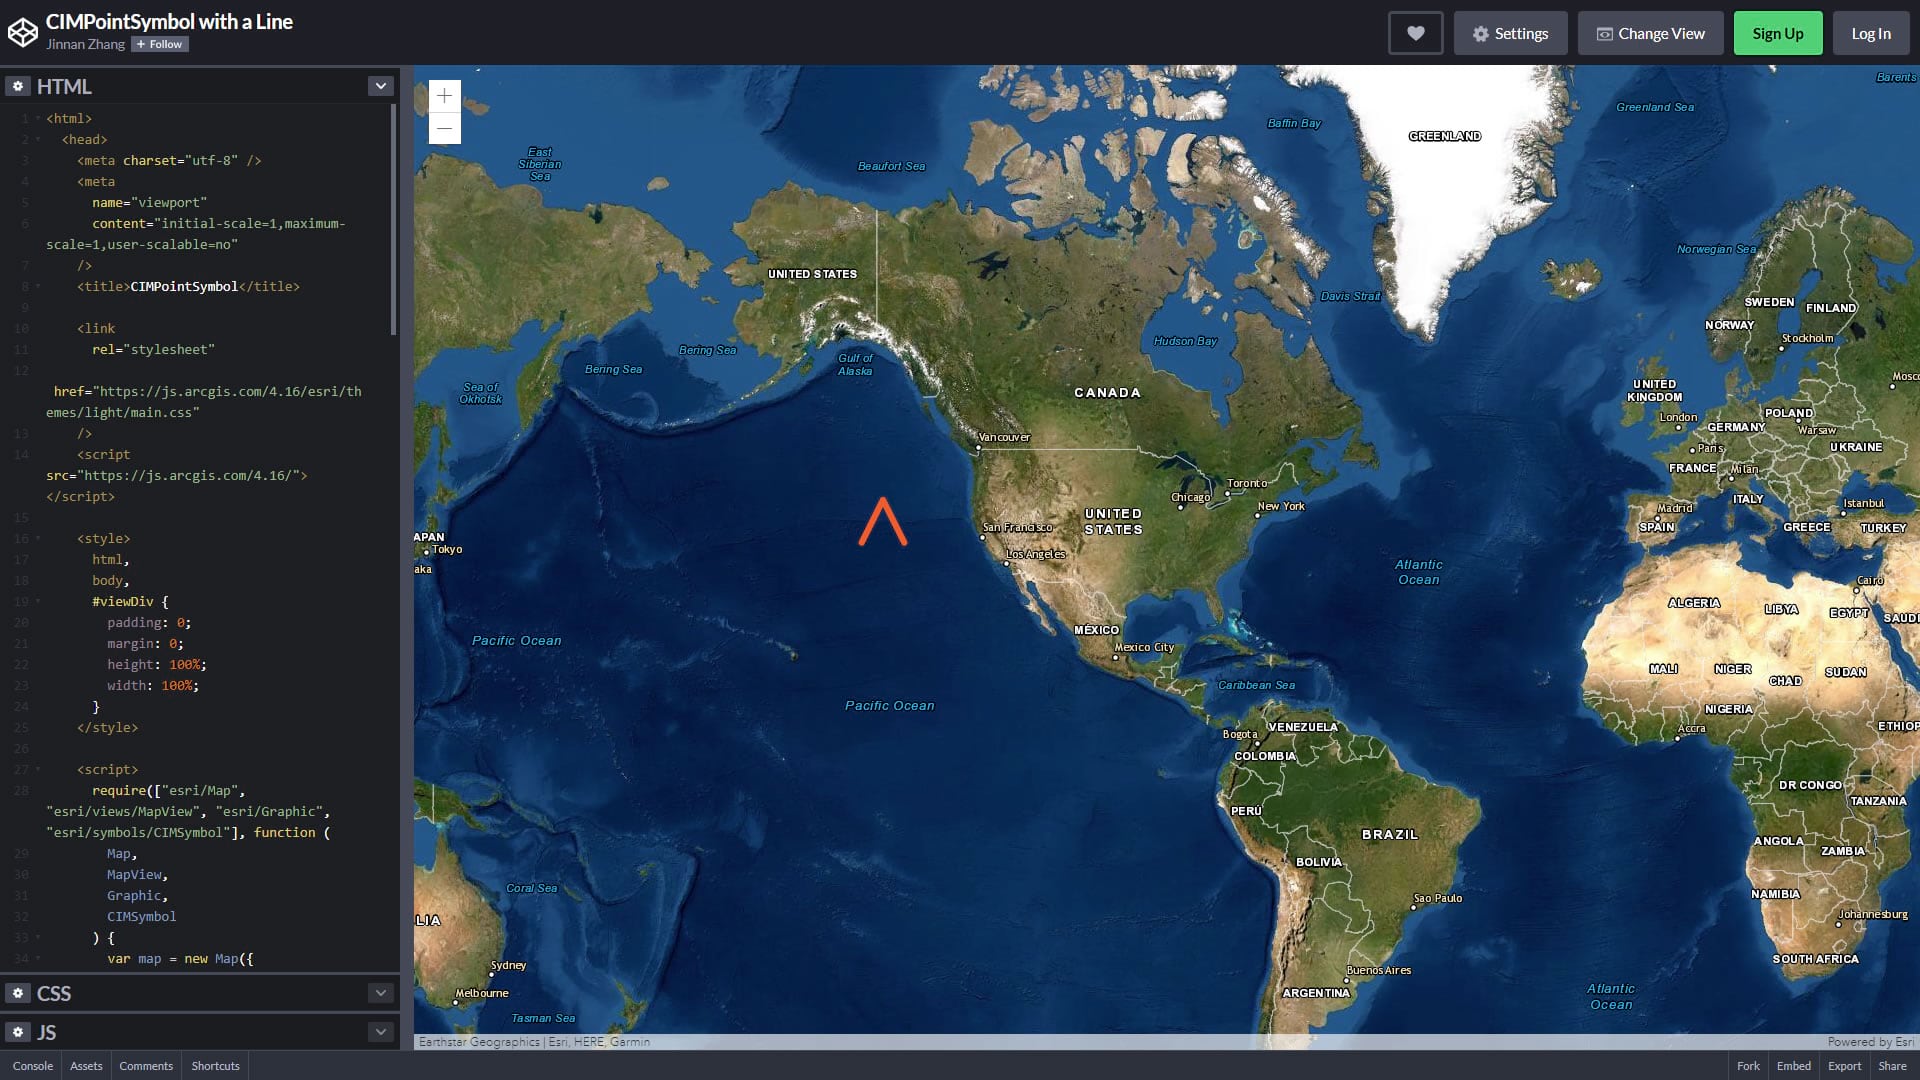
Now let’s turn that triangle into something a bit more sparkliney. We’ll tweak the code snippet above to show a polyline instead of polygon. It only takes a couple simple changes to the CIMMarkerGraphic; we can leave everything else the same. Instead of “rings” in the geometry, we’ll use “paths.” And we’ll change the symbol type from CIMPolygonSymbol to CIMLineSymbol.
Like so…
Alright, a line instead of a triangle. Here’s a codepen sandbox of you want to kick it around.
You have taken your first step into a larger world.
Formatting, and Fitting, a Custom Line
But how can we use it to plot our own data? Good question. Let’s further modify the code snippet, this time we’ll use a slightly more complex set of numbers representing some pretend data values:
5, 40, 15, 25, 10.
First, we’ll update the frame property with our new data in mind. for the sake of simplicity, we’ll just set the xmin and ymin to 0 for now. The maximum value in our data range is 40, so that can be the frame’s new ymax. We’ll also set the xmax to 40, which means we’re working in a 40×40 square frame —a little Cartesian coordinate space for the line geometry to live in.
The size property is the actual height into which the frame gets squeezed (or stretched, or whatever). Width is proportional.
Next we just create the path array with our data set up as coordinates. We’ll stick the data values in at the Y value and distribute the X values evenly across our 40 pixel frame. The API allows you to have multiple paths, but we only need one array of points for our sparkline paths.
Look, a sparkline!
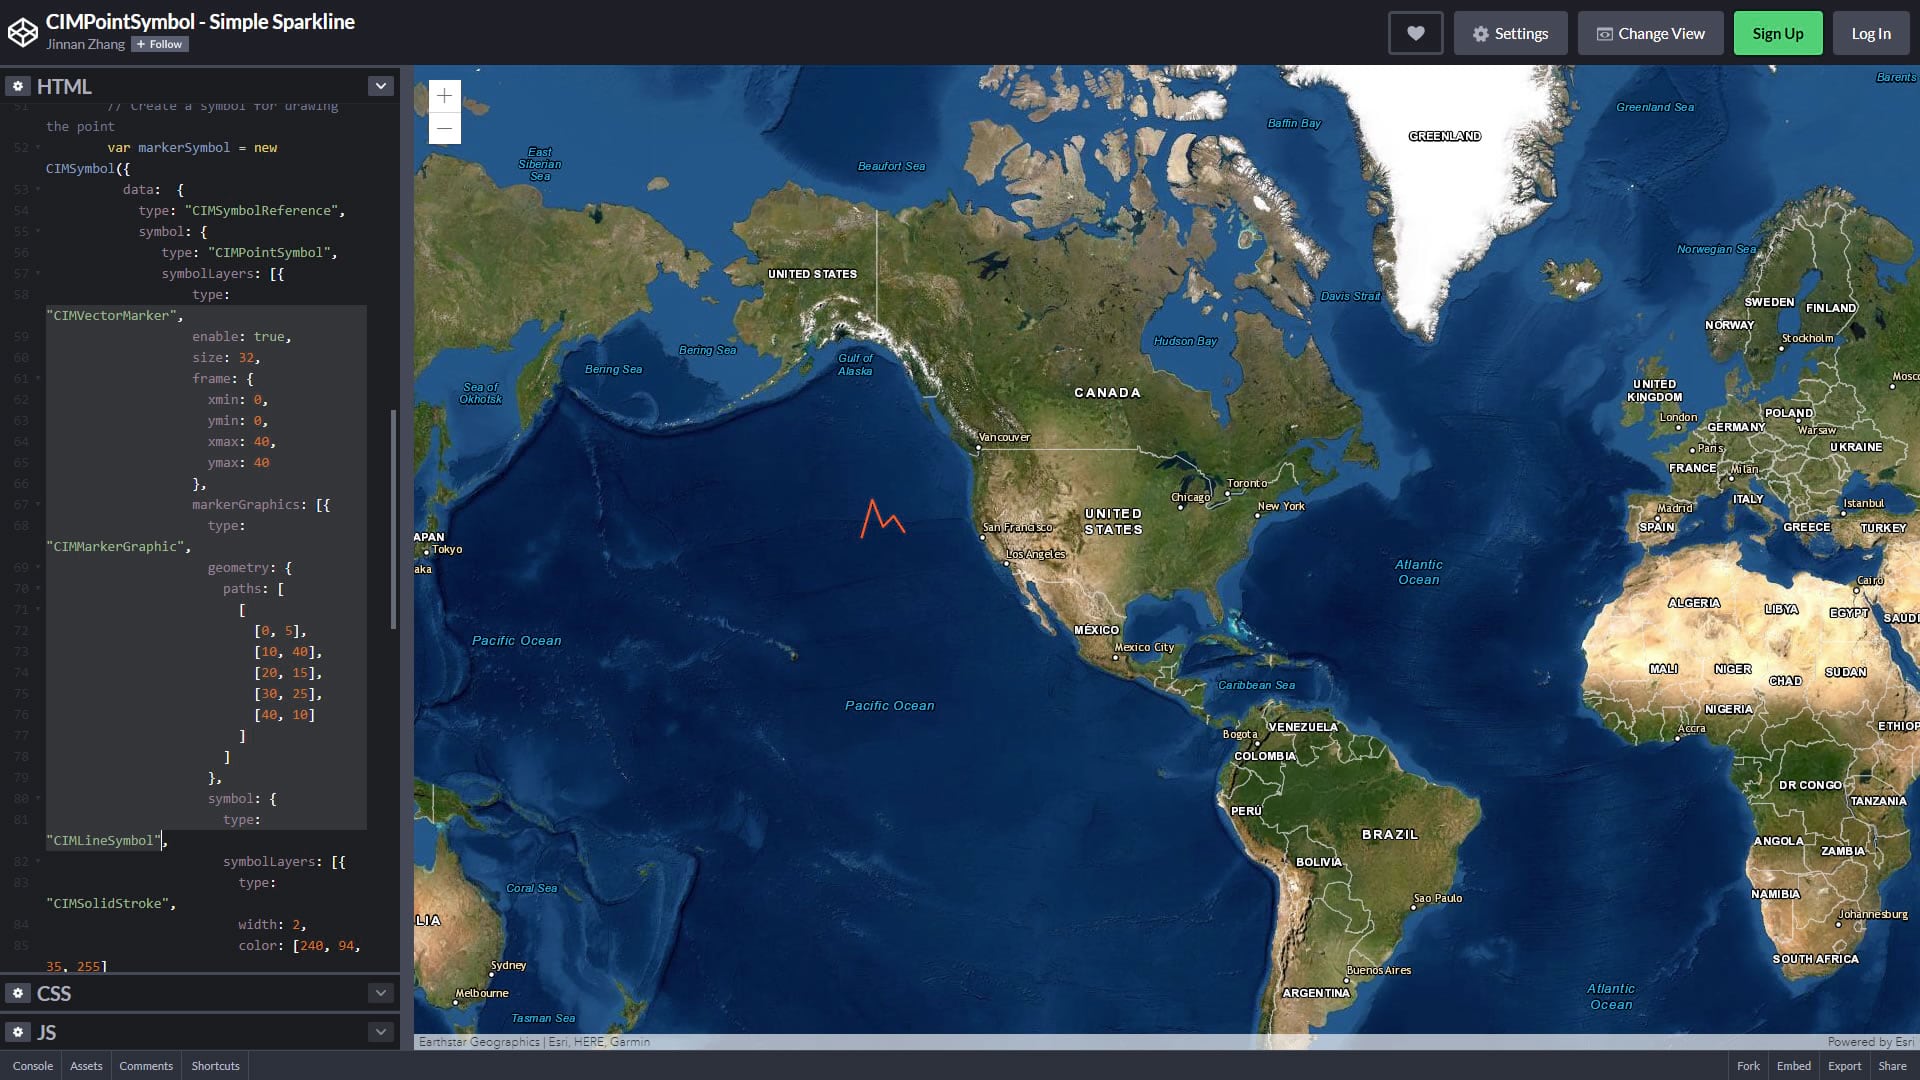
Check it out in the codepen editor. Play around with the size, frame, and data values to get a sense for the pushing and pulling that it does to the rendering. There’s a few moving parts and you might at first feel like Peter Griffin struggling to open the blinds, but hang in there.
Dynamic Sparkline Data
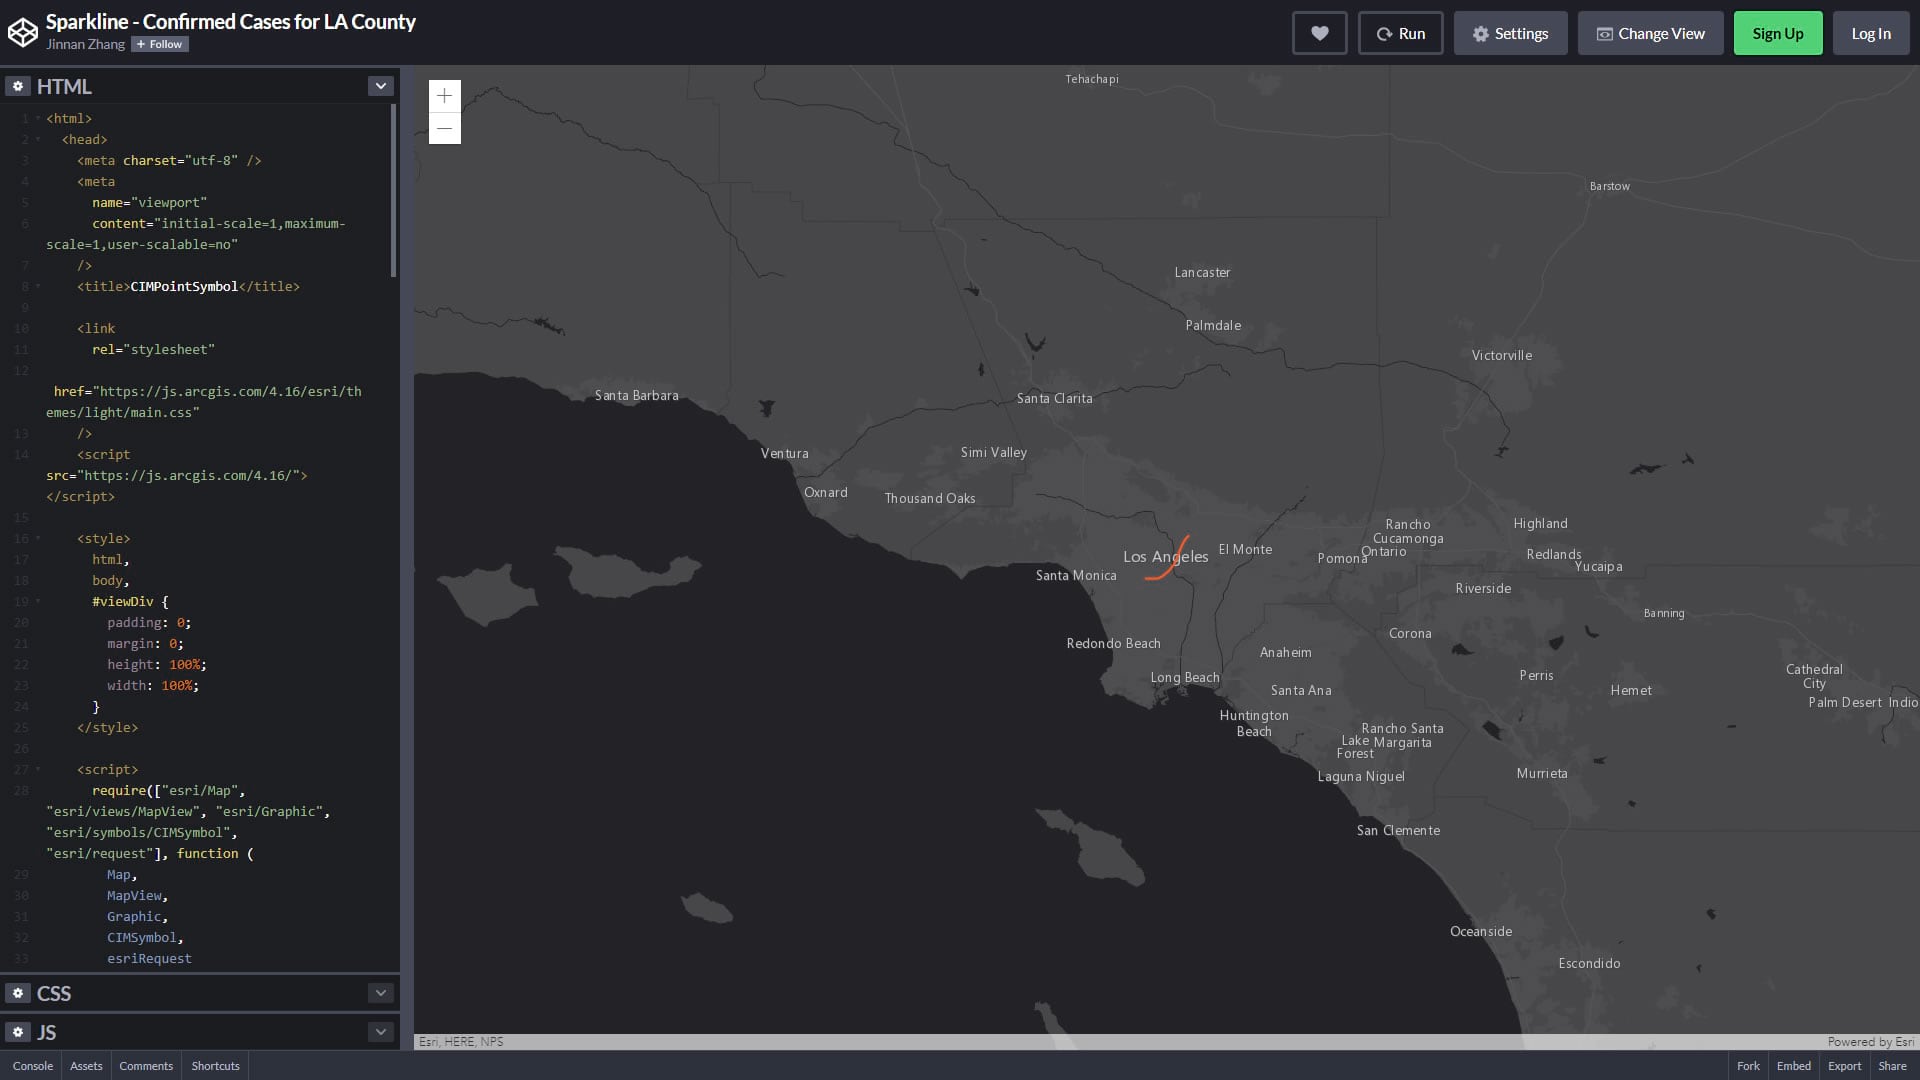
Now let’s see how we can feed this suspiciously sparkline-like thing actual dynamic data. We’ll draw a sparkline for Los Angeles County representing “Total Confirmed Cases.”
We can get the Covid-19 timeseries data for each US County from this Feature Layer. And here is an example query to fetch all features for Los Angeles county from this feature layer.
After fetching all the features, we will loop through them and get the value we want to visualize from each feature and save them into a new array (like the array of numbers we made manually in the previous example).
Now we have a long list of numbers corresponding to confirmed coronavirus cases in Los Angeles County. But this data has many more numbers than we were dealing with in the fake data example, so we need a better way to find the max number from this list instead of picking it manually. Here’s a little doodad that does that for us…
Construct the path coordinates, just like in the sample above, and you get an honest to goodness sparkline.
Play with it here in this codepen sample.
If you are interested in creating a version of CovidPulse for your area, the full code is available here on GitHub: https://github.com/vannizhang/covid19-trend-map
Hopefully this is sufficient to get you going on using CIMSymbols to render sparkline maps. There are so many applications for sparklines to represent time series data as compact distilled visualizations of a dynamic geographic phenomenon. We’re excited to see the maps of time and space that you make.
Visit CovidPulse for an ongoing visualization of the pandemic and this video describing it and sparklines.

“The Cartographic Information Model is an energy field created by all living things. It surrounds us and penetrates us; it binds the galaxy together.”
So we’re dealing with the “Force”… May the force be with you!