Visual comparisons are one of the most effective tools in the storytelling toolkit. They take competing information that might otherwise have been related through text or tables and deliver it in a way that is much easier and more intuitive to interpret and analyze at a glance. For place-based storytelling, cartographic comparisons can pack an even bigger punch, enabling the quick comprehension of trends or patterns within a geographic context, across multiple datasets.
One of the features added to ArcGIS StoryMaps in June, 2020 was the Swipe media block. Its presence changes the way visual comparisons can be used to tell a robust story. With the swipe block, storytellers can directly compare two synchronized images or web maps. This blog post will focus primarily on the workflow and use cases for maps.

The story so far
Prior to the swipe block, there were already a few map comparison solutions possible in ArcGIS StoryMaps. Authors can effect map choreography by orchestrating slideshow or sidecar slides to sequentially change the extent and visible layers of a given map. Another alternative is to use map actions to permit the reader to interact with and modify chosen aspects of a map.

However, those options have their limitations. For one thing, you’re not able to compare maps side-by-side at exactly the same time, and there is a limit to how much information the human brain can retain throughout the process of going back and forth between two or more maps. Map view extents and layers might change from slide to slide, further increasing the possibility of disorientation.
There are, of course, cases where you, as the author, will want or need your audience to be able to really dig into multiple layers of data over several geographic or temporal frames of reference. In such instances, those more complex resolutions are necessary, but for quick, streamlined, map-based comparisons, the simplicity of the swipe block offers an answer.
The swipe block: an elegant solution
The swipe media block enables readers to directly compare two maps simultaneously, using an interactive, draggable handle.
The result is a much simpler interface than those aforementioned solutions. By keeping both maps visible and their extents always synced up, the swipe block offers an immediate, one-to-one relation of whatever contrast—or similarity—you’re trying to convey.
Furthermore, the swipe block keeps the comparison contained to a single, tidy inline display. This reduces the potential for the reader to be overwhelmed by a mandatory overload of information and interpretation or to get fatigued from intensive scrolling or clicking.

The strengths of the swipe block
The swipe block really shines for punchy thematic comparisons with a clear visual distinction.
For instance, the swipe block shown below demonstrates how terrain in a region of central Mexico relates to satellite imagery of the same area, from which inferences about land use and vegetation can be gleaned quickly.

Another good use for the swipe block is to show change across time.
The modern landscape can be shown against the past, as demonstrated in the story Grace and Delight, which chronicles how select American cities have made room for public spaces as they have grown.
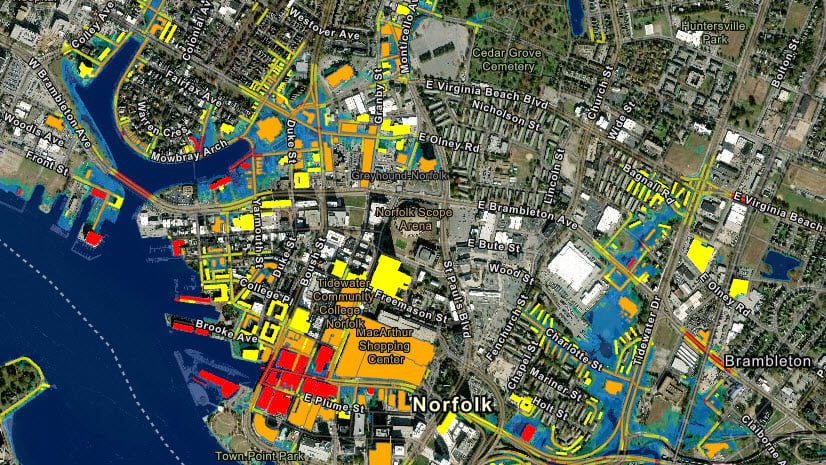
Or, a swipe block can show the potential for future changes, like this one from the brilliant Coastal Flooding story, warning of the effects of sea level rise around Norfolk, Virginia.

The swipe block can also be used for relating two different sets of data in one fell swoop.
In the screenshot here, a county-level look at confirmed COVID-19 cases per 100,000 people across the United States is stacked up against the case fatality rate in each county. Such comparisons can help to pinpoint regions where health services may be struggling to keep up with the demands that the spread of coronavirus has placed on them.

Add a swipe block to your story
The best part is how straightforward it is to implement a swipe block! Just select Swipe from the palette block you know and love, then add a map from your own library, your favorites, or the ArcGIS Living Atlas of the World to each side of the block. Toggle the maps’ layers on or off as needed, then edit either map to set the initial view, and presto! You’ve got an instant cartographic comparison.
(Note that you can’t edit a map itself from within the swipe block builder; you’ll need to have editing access to that map and open it in the Map Viewer to change its symbology, basemap, et cetera.)
Take a peek at the video below for a brief walkthrough of how to add a swipe block to your story.
And, to add to an already fun feature, authors also have the flexibility to disable map navigation in the swipe block, for cases where the ability of the reader to pan around and zoom in or out might distract from a specific comparison that’s being made.
Plus, a hover-over legend can be enabled for either or both of the maps in the block, and the entire block can be re-sized to three different options.

Finally, keep in mind that you can also add a swipe block to the media panel of a sidecar slide. This works in both docked and floating sidecar layouts; in a floating layout, the narrative panel will temporarily disappear while the swipe slider is being dragged.
So, if you think you’re ready to add some powerful map-based comparisons to your story using the swipe block, go ahead and jump into the story builder.
For a more in-depth look at the process of implementing a swipe block along with tips to get the most out of this tool, check out this comprehensive tutorial.
And, as always, we’d love to hear your feedback! Leave a comment on this post or give the StoryMaps team a shout on Twitter!


I really like this addition to Story Maps. If I had any constructive feedback I hope that you can make this and the zoom in/out Buttons (Or pinch) work together on portrait mobile phone layouts before it leaves beta.
Swipe is an excellent addition! Please consider adding a search function.