ArcGIS StoryMaps is the professional tool for harnessing the power of geospatial storytelling to communicate your work. The builder gives you flexible ways to bring together narrative, maps, and multimedia, helping you shape your ideas and information into interactive experiences that invite your audience to explore and engage.
Each month, we continue to improve ArcGIS StoryMaps with new features and enhancements informed by feedback from our community. Check out what’s new this month!
Quick links
- Linked charts in stories
- Web map enhancements
- Multiple text block selection
- Quiz enhancements
- Compact mode for tables
- And more…
Linked charts in stories
Maps and charts can offer different perspectives on the same data, and bringing them together can help readers make connections between where things happen and what the data reveals. Now, when you create charts from feature layer data in Map Viewer to accompany a web map, you can add those data visualizations to the narrative panel of a sidecar alongside your map using linked charts, available in beta.
In your story, these charts are dynamic, linked to the map, and filtered by extent. Readers can hover over chart elements for more detailed information, select them to highlight corresponding features on the map and in any other linked charts, and view only relevant data as they pan or zoom the map. Linked charts also automatically update whenever the underlying map data changes.
To add a linked chart to your Sidecar, add a Map configured with a chart (or charts) to the media panel and Save. From the narrative panel, select Linked chart from the block palette, then choose the chart you want to Customize. In Edit chart, you can adjust the Background and text colors, Chart title, X-axis title, Value axis title, or Show legend if applicable.
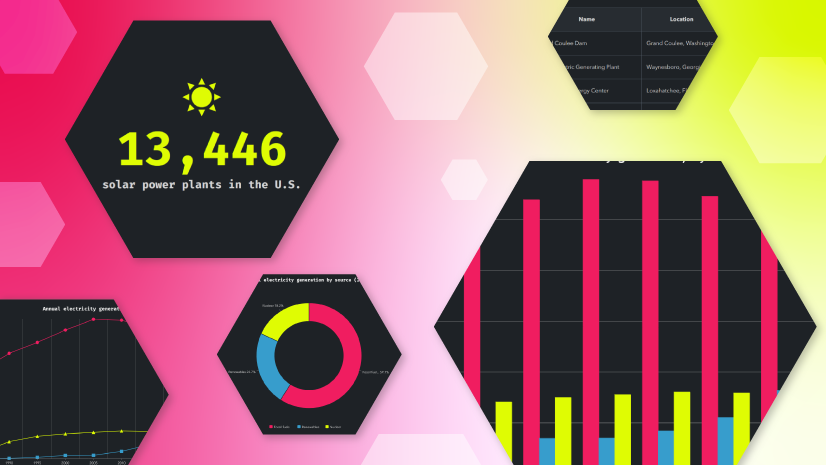
Charts and other data visualizations can bring clarity to complex information while providing a visual break from longer passages of text. Explore our StoryScape issue to find your rhythm in geospatial storytelling through intentional pacing, structure, and design choices.

Web map enhancements
To state the obvious, maps are at the heart of geospatial storytelling. So, we’re excited to introduce several enhancements that give you more ways to integrate them into the look, feel, and experience of your story.
Theming
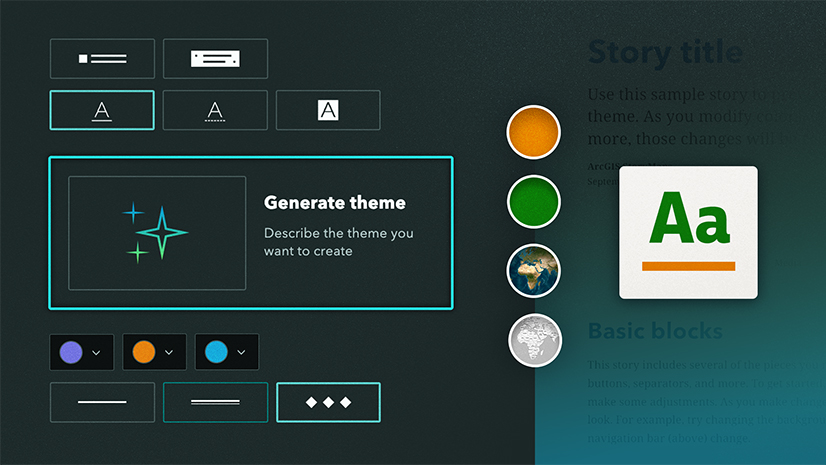
Creating a cohesive visual experience can help maps feel like a natural extension of your story. You can now apply your story theme to pop-ups and legends, bringing their fonts and colors in line with the rest of your design.
To bring your theme styling to a web map, toggle on Apply theme in Adjust map appearance.
Note: Maps previously added to a story retain their existing appearance unless you choose to apply the theme. Apply theme is enabled for newly added maps.
Bookmarks
Bookmarks can help readers explore specific locations and perspectives you’ve already configured in a 2D web map or 3D web scene, and now you can bring this navigation directly into your story, including bookmarks with time information.
To make bookmarks available in the maps and scenes in your story, turn on Bookmarks in Adjust map appearance.
Time-enabled maps
Time adds a new dimension to maps, helping you reveal patterns, communicate trends, and tell clearer stories about how your data changes over time. As new ways to visualize time-based layers in Map Viewer are introduced, those capabilities are also supported in your stories.
Whether your web map is configured with time series, time-based layer visibility, or time-enabled layers, the time bar will display the appropriate intervals and date labels. For sub-day intervals, the time of day appears, while maps with longer intervals display only the date.
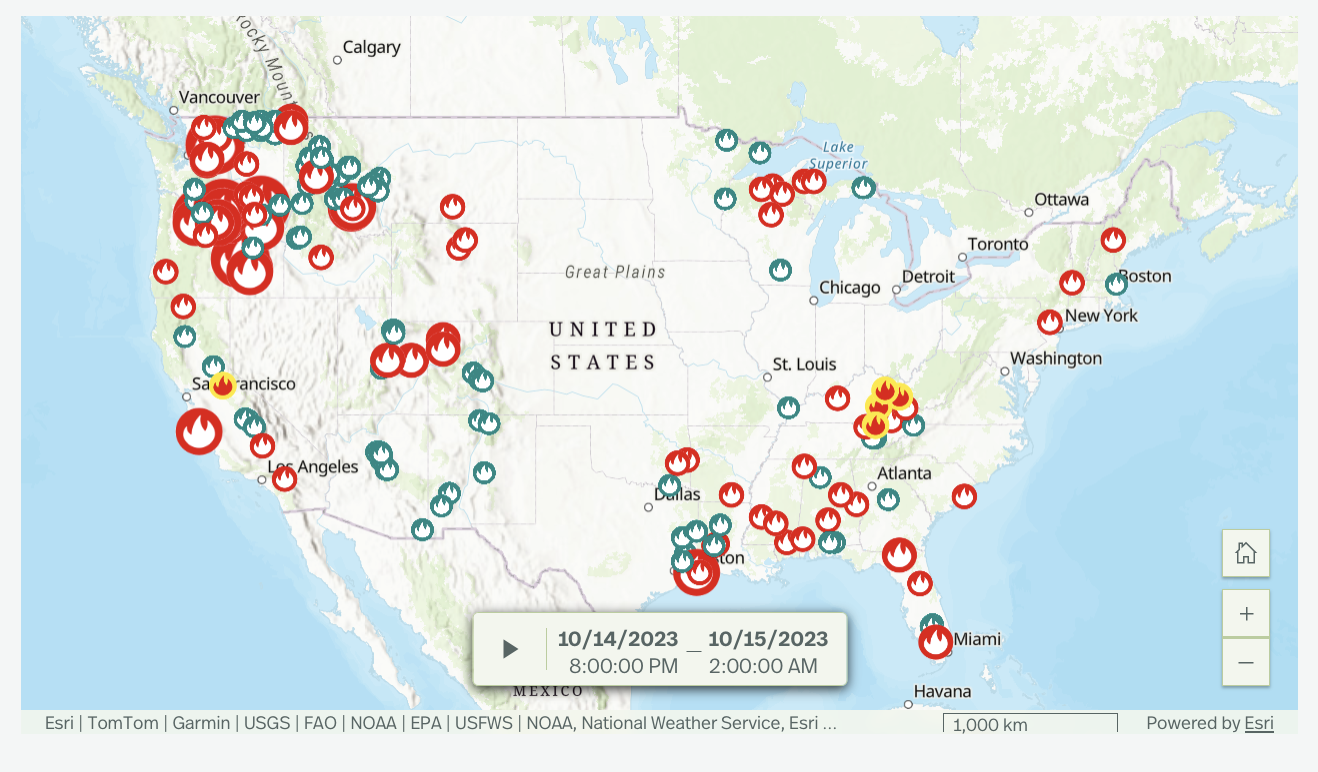
Sync maps in frames
Create a more connected mapping experience in your slides with synced maps, now available in frames. Like in briefings, two maps on a slide can be set to always show the same extent, helping maintain geographic continuity and allowing quick comparisons as readers move through your content.
To sync maps in a frame slide, add two maps to the slide and select Slide options from the slide panel, then Enable map sync.
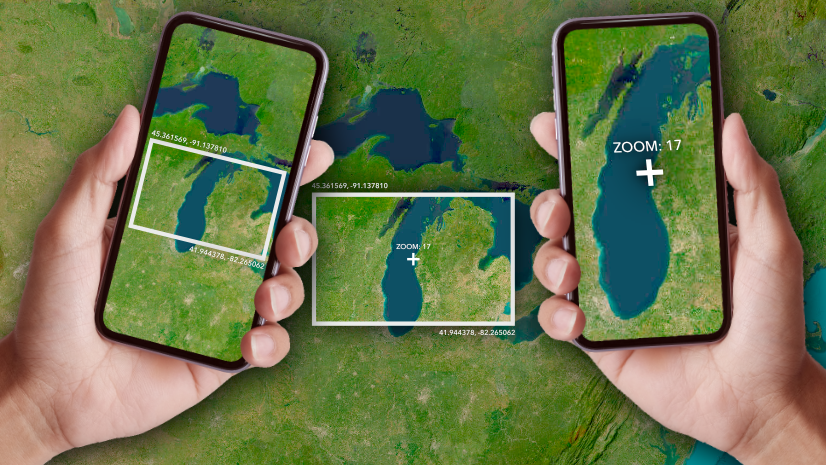
From clear visual cues that help readers orient themselves to configured pop-ups that reward exploration, small cartographic choices have a big impact on your reader’s experience. Discover how crafting maps for storytelling can transform them from supporting visuals into essential narrative tools.
Multiple text block selection
We know text blocks can start adding up as you craft a dynamic geospatial story, and making edits across them can be cumbersome. To make that process a little easier, you can now select text across multiple sequential text blocks, then copy and paste or format that text all at once.
Simply select the text you want to modify, then use the text editor to apply formatting changes or copy and paste your selection as usual.
Curious about keyboard shortcuts in ArcGIS StoryMaps? Explore the documentation to learn more.
Quiz enhancements
In August 2026, we introduced quizzes in stories and frames, making it easier to prompt readers to reflect on what they’ve learned and reinforce key concepts along the way. Now, you have even more ways to create a dynamic quiz with support for media and questions with multiple correct answers.
Add media
Add an image or map to the top of your quiz to provide additional context for a question or give readers a visual element to consider as they respond. To add media, open Edit quiz, select Show media, then select Add media and choose Map or Image.
Multiple answers
For questions with more than one correct answer, you can designate multiple options as correct. Readers can make their selections and then check their answer to see which choices were correct or incorrect, along with any correct answers they missed. To create a multiple answer question, select Quiz from the block palette, then choose Multiple answers.
Note: You can include both single and multiple answer questions within the same quiz block. When adding a new question, you can choose either question type, regardless of your initial selection.
Currently, quiz responses aren’t collected, though we’re actively exploring capabilities like that for the future. If you have feedback about quizzes or ideas for how they could evolve, we’d love to hear from you in Esri Community.
Compact mode for tables
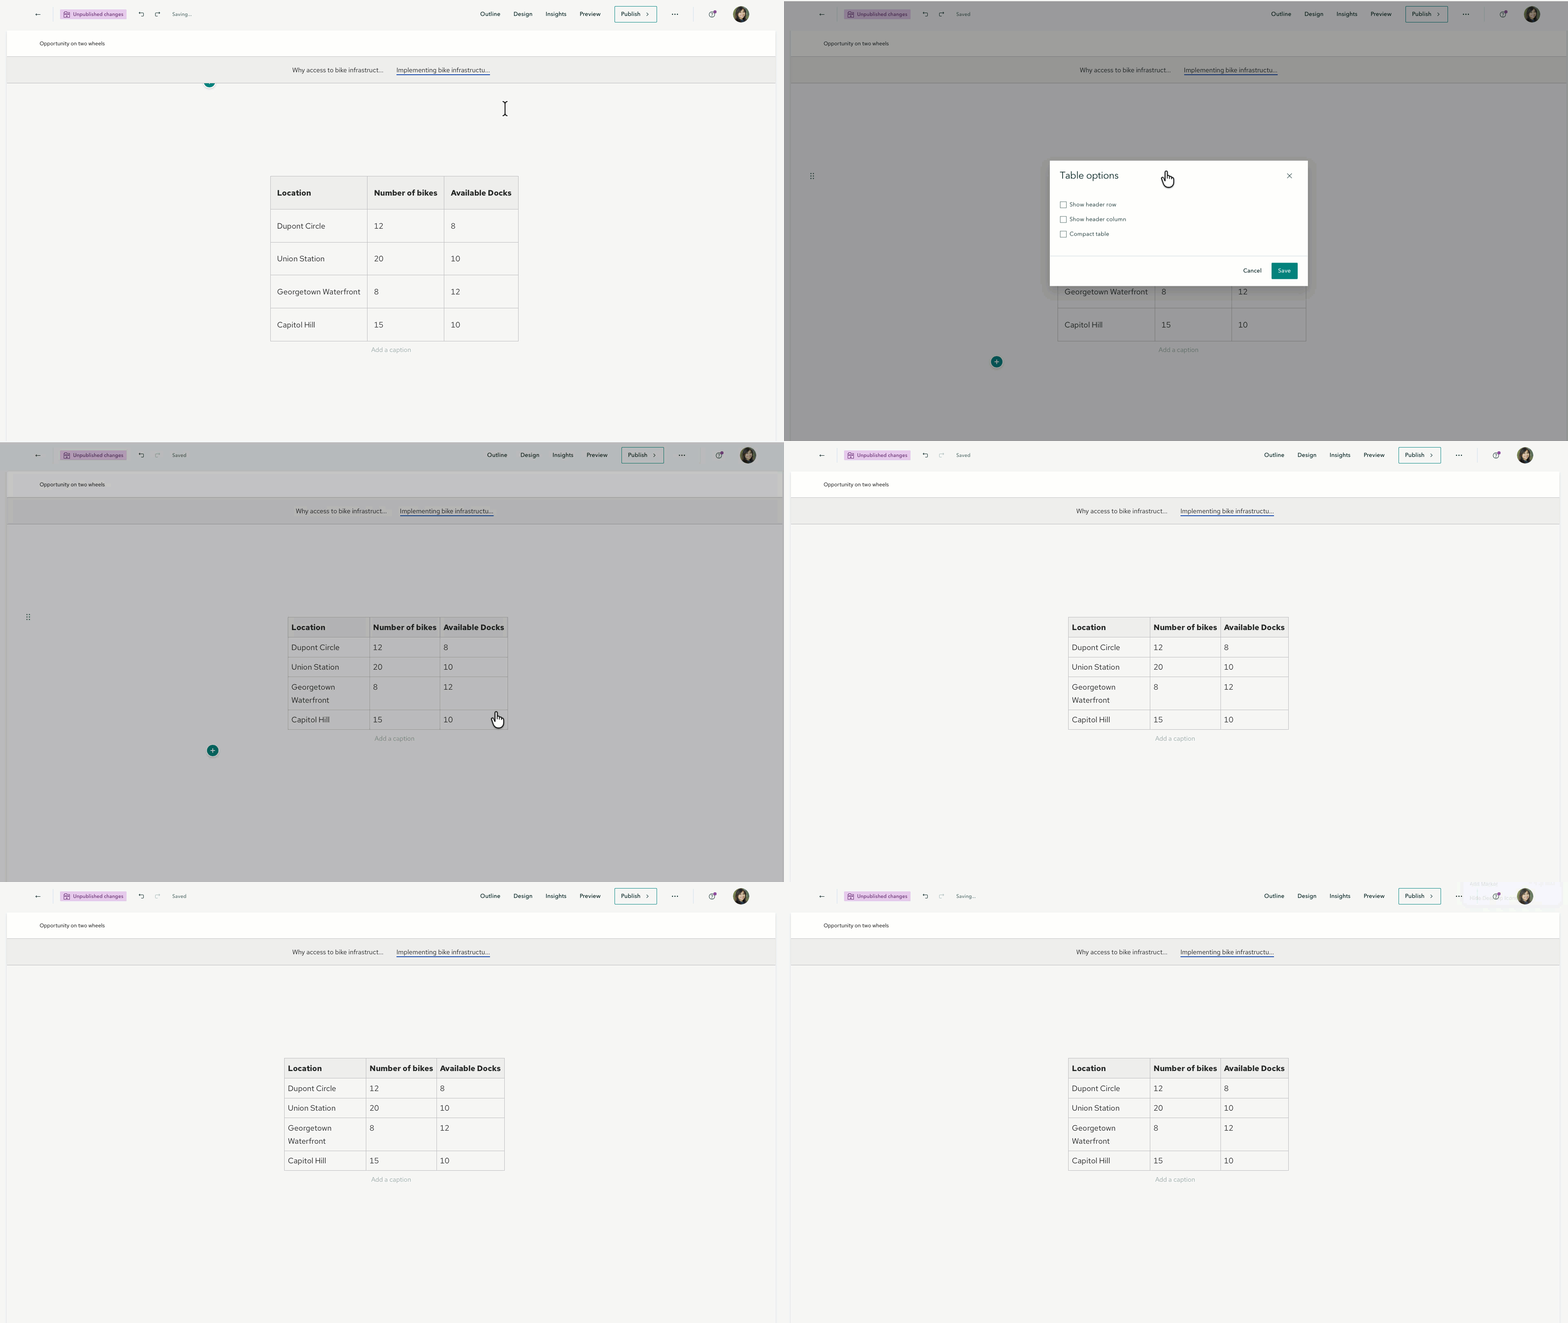
Tables provide a structured way to organize information in your story, but as you add more rows and columns, they can quickly take up valuable space on the page. Enter compact mode. By reducing the horizontal and vertical padding around table entries, you can keep your information organized while making more efficient use of space.
Open the table Options and select Compact table to switch to the more condensed layout.
Learn how to use charts, infographics, and tables effectively in ArcGIS StoryMaps.
And more…
- Bar charts now reflect the Shape (Sharp, Soft, or Curved) selected in the theme builder.
- The ArcGIS StoryMaps assistant has changed status from preview to general availability. Learn more about AI in ArcGIS StoryMaps.
- The option to Hide slide has been added in frames.
- ArcGIS Online item pages for themes now include an Item used section showing which stories use that theme.
- Media options are now available for attachments in briefings, including Fit/Fill, Alternative text, and Attribution for images and videos, and Adjust map appearance for maps.
Check out the release notes for more details about other small changes and fixes released this month.
Build a story with us. Find the recordings and recap blogs for 2026 ArcGIS StoryMaps Live, a chat series that walks through the key stages of crafting compelling geospatial stories.
How are you bold in the pursuit of better? Learn more about the 2026 ArcGIS StoryMaps Competition, open from September 8 through December 11.
Thank you to Ashley Du and Will Hackney for their contributions to this post.
All Adobe Stock images are © 2026 Adobe Stock. All rights reserved.


Article Discussion: