ArcGIS Business Analyst includes access to over 15,000 variables – that’s an incredible amount of data at your fingertips! But do you ever find yourself scrolling though the data browser and not finding that one specific variable you need? Did you know that you can easily create your own custom variables to use in mapping, analysis, and reports? Or maybe you already know about the Create Custom Variable tool but feel a bit unsure about how to go about creating your own variables. If so, this article is written just for you. We’ll provide instructions and some of our insider tips and tricks, so you feel comfortable in creating custom variables.
Business Analyst makes it simple to create some of the most popular custom variables for age, household income, home value, housing units, and race. The application also has a straightforward process to guide you through creating more advanced custom variables using mathematical operators and easy ways to add numbers and calculate sums and averages.

Creating a household income variable
We will start by creating a simple household income variable. Household income variables are some of the most popular created custom variables. For the U.S., the Household Income category contains Esri household income variables divided into nine predefined income ranges, beginning at income less than $15,000 and ranging to $200,000 or greater. However, those predefined ranges may not be exactly what you need for your analysis. Perhaps your targeted audience’s household income range is $75K and greater, but that specific range variable is not listed in the category. No worries, you can easily create the variable using the Create a custom variable option. Let’s walk through the process using the data browser in ArcGIS Business Analyst Web App.
The data browser is an in-app interface that categorizes and displays all the data variables available in Business Analyst and provides the option to create custom variables. You can access the data browser though many of the Business Analyst workflows, such as Color-Coded Maps, Smart Map Search, Suitability Analysis, Comparison Reports and Build Reports. For this example, we will create a comparison report.
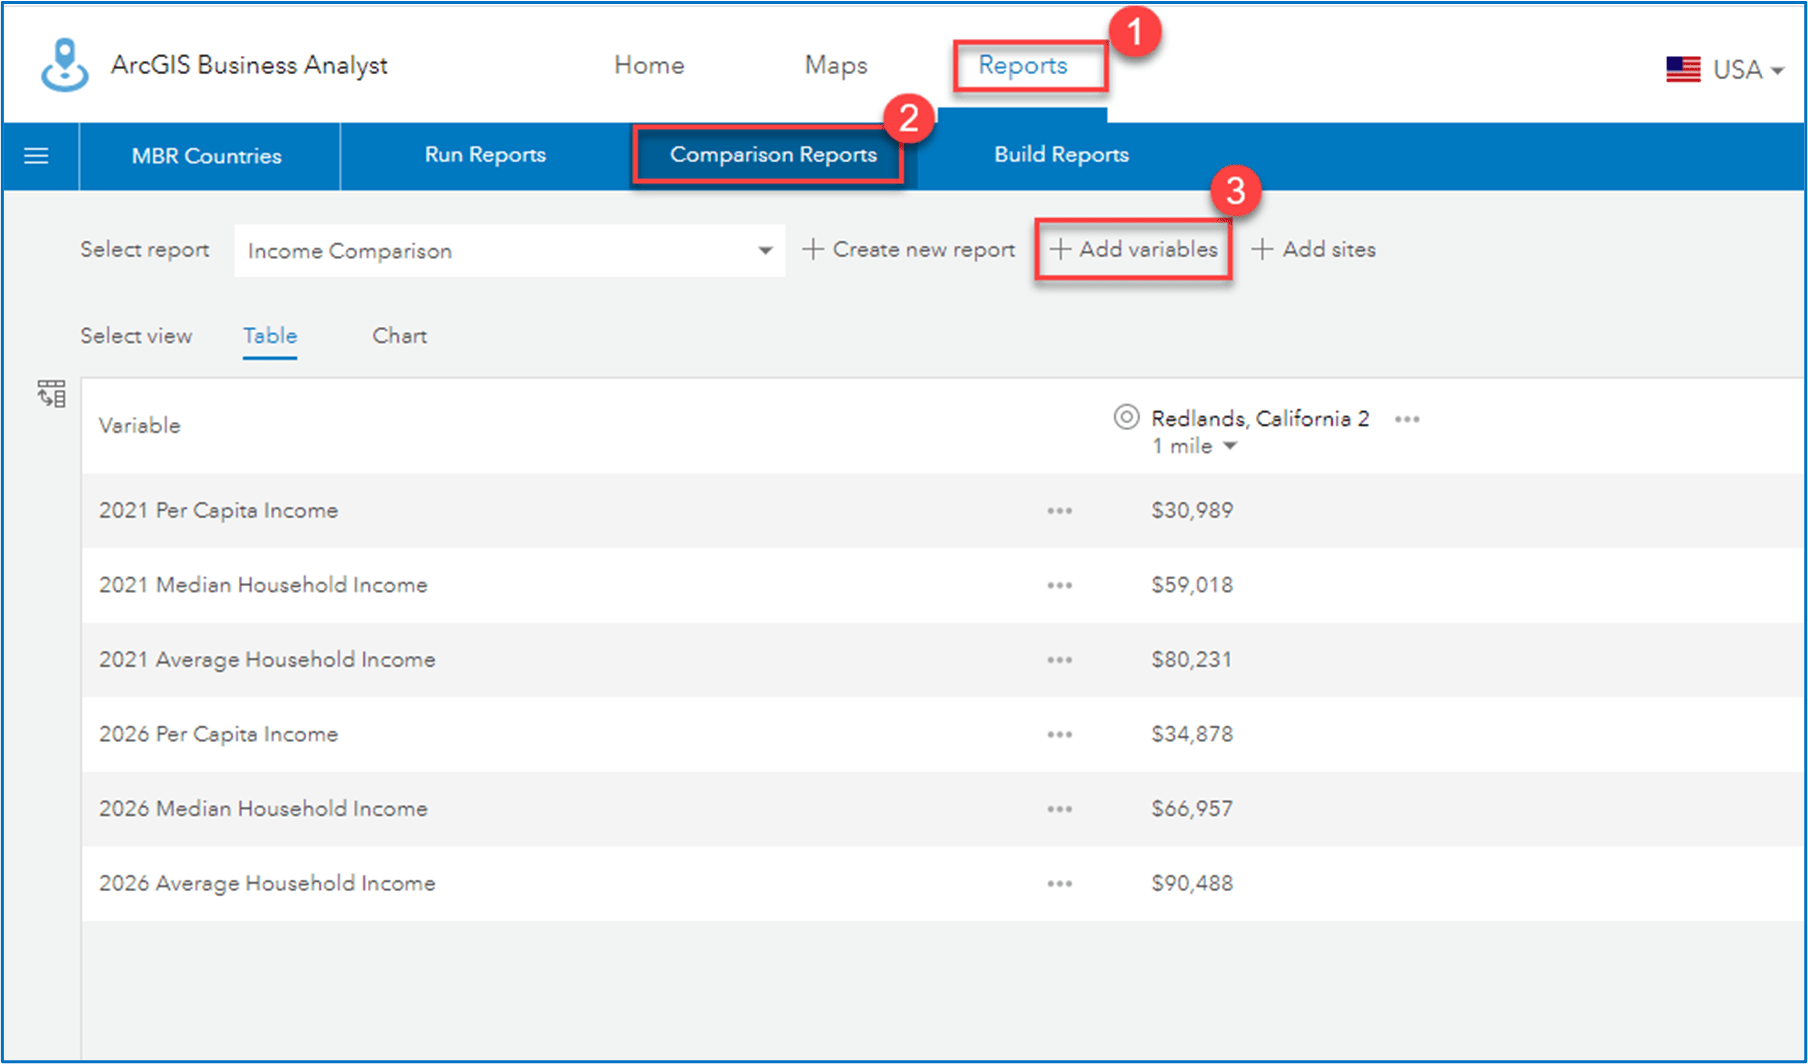
To begin, click the Reports tab and click Comparison Reports. The workflow opens to the last used report. You will need to add at least one site to make the workflow active. If no sites are displayed, click the Add Sites button to add a site. Click Add variables to open the data browser.

To create the custom household income variable in the Comparison Reports workflow, do the following:
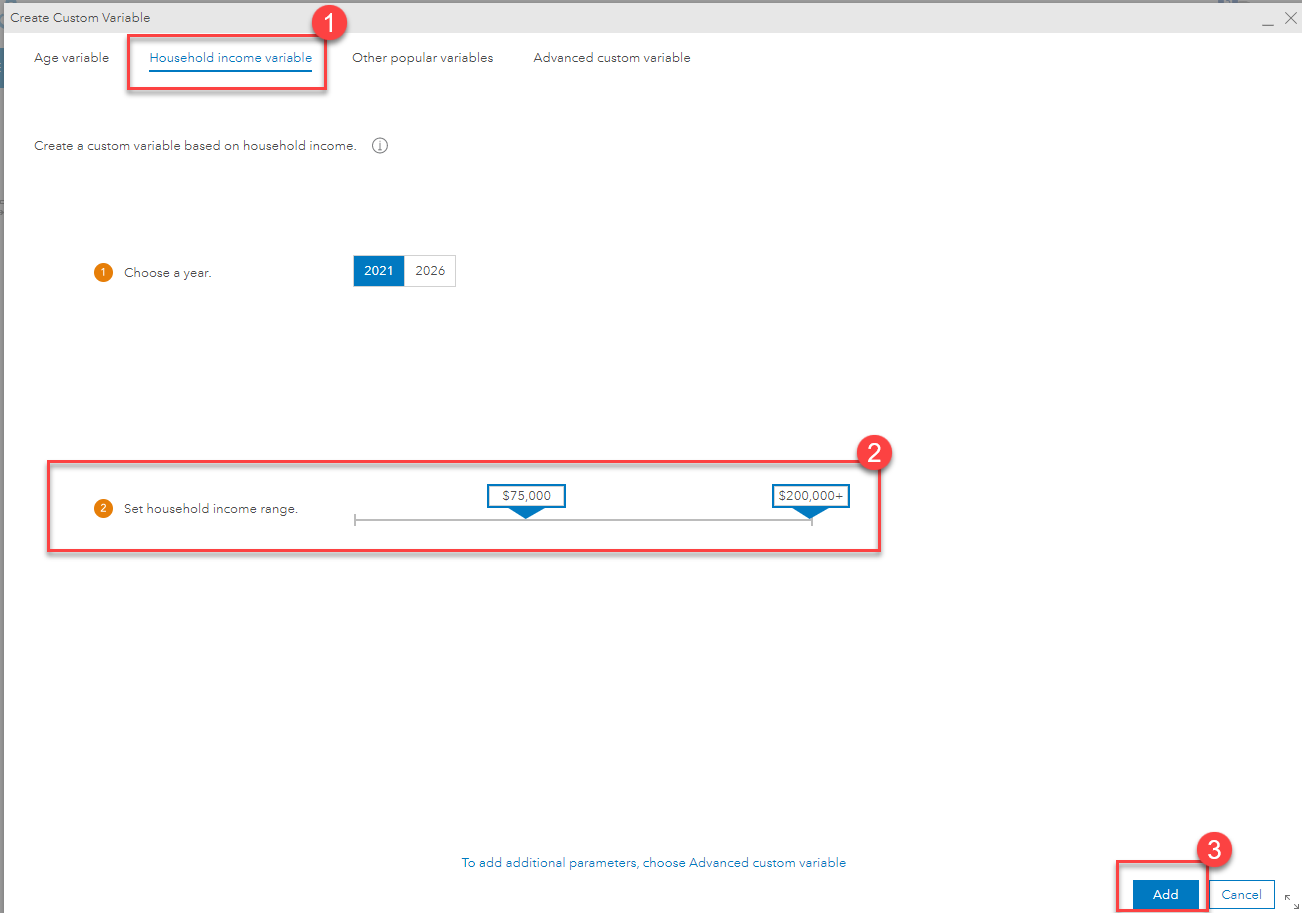
- Click Create a custom variable to open the Create Custom Variable

- Click Household income variable.
- Leave the default year selection.
- Set the household income range by either moving the slider or entering $75,000 for the minimum value in the text box.

- Once you have made your selections, click Add.
- Leave the default variable name, Household Incomes $75,000+ and click Save.

- The custom variable is added to the workflow and saved for future use. Click the Switch rows and columns option in the upper left of the table to view variables in rows as shown in this image.

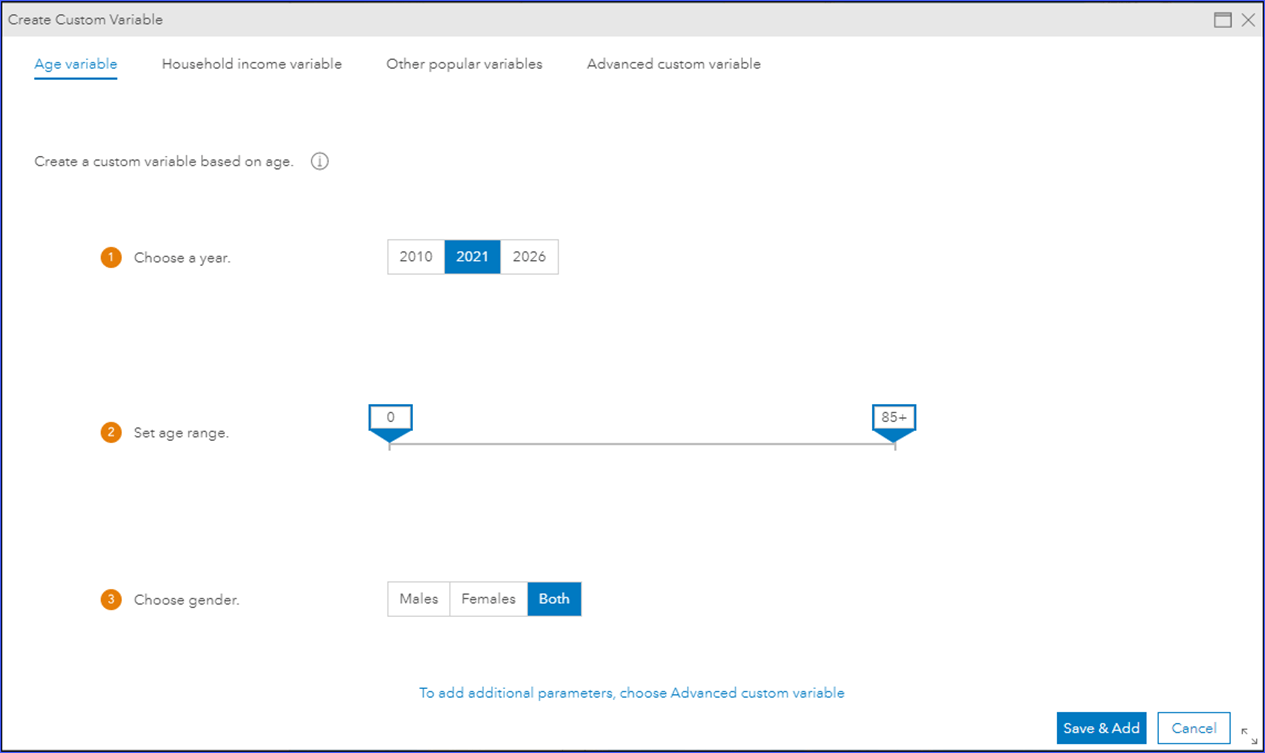
Tip: You can also create custom variables for age by clicking the Age variables tab or for home value, housing units and race by clicking on Other popular variables. The Create Custom Variable workflow walks you through the process of creating these variables.

Creating advanced custom variables
Now that you know how to create popular custom variables, we will take a deeper dive into creating advanced custom variables. You can build advanced custom variables from any of the data categories in the data browser and use mathematical operators to combine them. A variable can be displayed as a count, a percentage, an average, or an index value.
In this advanced custom variable example, we will create an index variable for household incomes greater than $75K compared to the household income for the United States. The Index compares the variable value for a selected area to the variable value for the country.
The following instructions will walk you through the steps. You can also watch this helpful video that guides you through creating custom variables.
To create the household income index variable, we first need the percentage of households with income greater than $75K for the whole USA. We’ll use this information in the custom calculation. To find this value, we can edit the custom variable we just created, “Household Incomes $75,000+”.
You can access the custom saved household income variable you just created in the data browser by clicking My data > Saved Variables.
- In your comparison report, click Add Variable.
- When the data browser opens, click Saved Variables.

- In the Refine results panel, under My Data, click on Custom Variables “only” to show only the custom variables you have created.

- Click on the arrow next to Custom Variables to expand the list and display all the variables. The most recent custom variable will be shown at the top of the variable list.
- Click Edit this variable (the pencil icon).

- The Create Custom Variable window opens, where the variable can be edited to display as a percent instead of the number value.
- Under Assemble your custom variable, each variable used to calculate your custom variable is displayed. Click the % button for each variable to change the calculation method from count to percentage. Click Add.

- Enter a name for the new variable, “Household Incomes $75,000 + Percent”.
- Enter “2” for the number of decimal places to display and click Save.

- The Selected variables pane opens with the new variable already selected. Click Apply to add the new custom percentage variable to the report.

- To create the household income index variable, we’ll use the new percentage variable to determine the percentage of households with income greater than $75K for the whole country. This is easily accomplished in the comparison reports workflow.
- In the comparison report, click Add sites > Neighboring geographies. Select the USA checkbox and click Apply.

- The USA is added in the comparison report. As you can see, 44.35% of households in the USA have income $75,000 or higher. Write down the number down “0.4435” because it is needed to create the index variable.

- Now that we have this important information, we can create the household income index variable.
- In the comparison report, click Add variables.
- Click Create a custom variable.
- Click Advanced custom variable and then click on the Income category.

- Click Household Income and select all the current year variables $75 K and greater by clicking the checkbox for each.
- Click Add Selected Variables.

- Click Add as Separate Variables.

- Click the “%” button for each variable.
- Click the “(” opened parenthesis to add to the expression and move it to the beginning of the variable calculation. Do this by dragging it to the front of the expression.
- Click the “)” closed parenthesis. By default, it should be placed at the end of the expression.
- Click the “/” Divide symbol.
- Click Add Number and enter “0.4435” in the number box. (The number from step 13.)
- Your expression should look as shown in the image below.

- Click Add.
- Enter a custom variable name, Household Income Greater than 75K Index.
- Leave the default “0” decimal places and click Save.

- Click Apply to add the variable to the comparison report.
Here you can see the Household Income Greater than $75K Index custom variable. This is expressed as an index of value where 100 represents the average for the United States. The index of value compares the variable value for a specific area to the variable value for the country. In this example, the index is calculated by taking the average household income in a 1-mile ring around my site, Redlands, divided by the average of the base, whereas the base in this case is the USA.

When creating advanced custom variables, it’s helpful to understand the variable calculations. From the ArcGIS Business Analyst help documentation, learn more about variable calculations.
Summary
In this article, we first created a count variable for household incomes above $75K, and then edited the count variable to create a percent variable and used that to find the household income percent for the USA so we could lastly create the index of percent value.
These examples, tips, and video should provide you with a better understanding of creating custom variables, so you can create your own simple and advanced custom variables. Please give us your feedback, because we would love to hear what other types of custom variables you would like to create.

Hi, Donna. Could you please email me and dat.nguyen@okcommerce.gov and let us know if we have businesses (hot house) values (properties’ values) in BA reports database. We are doing brownfields projects and would like to see 1998-year properties values comparing to current values. Can BA database showing values of businesses in 1998? Thank you!