It’s the most wonderful time of the year—to those of us on Esri’s StoryMaps team, at least—for our annual ArcGIS StoryMaps competition is well underway. As of the publication of this blog post, there are about five weeks to go; the deadline for entry is October 7. Storytellers who are 18 or older can submit their finest ArcGIS StoryMaps work emphasizing the visualization of data to help tell an impactful story about one of the following categories:
- Digital humanities and popular culture
- Health and safety
- Humanitarian and social justice
- Nature and physical science
- Planning and infrastructure
When entering any competition, it helps to know the criteria that will be used to determine the winners. If you’ve explored the 2022 ArcGIS StoryMaps competition home page, you may have found the Judging Criteria tab and seen the six aspects that will be assessed to select the very creamiest of this year’s crop of submissions. Our panel of brilliant guest judges will select first- and second-place entries from each of the five submission categories, based on their:
- Effective use of GIS and ArcGIS StoryMaps
- Overall design, impact, and originality
- Innovative data visualization
Additionally, the StoryMaps team will look at the stories across all the submission categories and select the three that we feel are superlative in these particular storytelling skills:
- Most effective visual language
- Most innovative use of data for storytelling
- Best map choreography
While some of these points may seem rather broad, that is largely by design. We want potential entrants to feel creative, not boxed in when it comes to topic, style, and storytelling and data visualization techniques. But the other side of that coin is that it can be hard to discern what the judges might actually be looking for.
To help in that regard, the rest of this blog post will walk through each of those six criteria in turn and unpack them a bit. I’ll offer real examples of stories that embody each point (including acclaimed stories from previous years’ competitions) and point to additional resources that will hopefully help spark your creativity.
Main judging criteria
Effective use of GIS and ArcGIS StoryMaps
Esri’s suite of GIS products provides some powerful tools to quantify anything and everything that happens in the world, meaningfully analyze it, and use the results to make a positive impact. That last step is where ArcGIS StoryMaps comes in, as a tailor-made platform for taking that geospatial data analysis and presenting it in ways that anyone can understand and learn from.
Naturally, a big part of the judging for the 2022 ArcGIS StoryMaps competition will center around the use of ArcGIS StoryMaps as the final stage of that analytic process. The judges will want to see how GIS was used to ask questions and extract solutions, and they’ll also be looking for how ArcGIS StoryMaps is used as the vehicle for those solutions.
Example: Coastal Flooding, by the National Oceanic and Atmospheric Administration
Whenever it comes time to put together a demo of ArcGIS StoryMaps and its capabilities, NOAA’s Coastal Flooding story is one of my favorites to use because of the many different ArcGIS StoryMaps features it employs, from interactive web maps, to swipe blocks, to map actions, and more. Each one of those features is doing its part to distill a complex concept and its accompanying geospatial data set into a clear and obvious issue with wide-ranging effects.

Additional resources: Together, the two stories Getting started with ArcGIS StoryMaps and Tips to author a great story go a long way towards helping storytellers feel in control of the authoring experience in ArcGIS StoryMaps. The former is essentially a primer on everything that you can do in the tool and serves as a handy refresher on all the block types and different ways you can use multimedia in a story, etc. The latter suggests a few ideas for making your stories stand out even more.
Overall design, impact, and originality
All the data in the world, and the most advanced methods for analyzing it, can be for naught if the story of that data isn’t told effectively. This criterion, then, is all about the storytelling. As they scrutinize each submission, the judges will be asking questions such as:
- Is the story’s topic something that tends to be underreported or that people otherwise may not have thought much about before?
- Does the narrative flow naturally and is it written in an engaging way that makes readers interested in the subject?
- Does the author use media in ways that enhance the story as opposed to distracting from it?
- Is the data angle worked into the story in a way that is easy for non-experts to understand?
- Is the story using data to work towards a solution to an issue?
Example: Xiaoliuqiu, Sea Turtles, and Us, by Aiden Lo
Aiden Lo took us on an unforgettable journey in his submission to the 2021 ArcGIS StoryMaps Challenge for Restoring Our Ocean that earned him first place as our High School Storyteller of the Year. The story seamlessly weaves videos, photos, maps, and even audio clips together to take a subject that is deeply personal to Aiden and make it compelling to any reader. The ultimate effect is that the audience feels they are participating in the story and not merely observing it.

Additional resources: The story 9 steps to great storytelling offers great advice for how to take your stories to the next level and make them resonate with their audience. On storytelling with data, specifically, the blog post Using a personal lens to make data relatable helps writers find that sweet spot when it comes to taking a big set of data and conveying its messages so that readers can easily understand them.
Innovative data visualization
This third criterion is arguably the hardest of the three to really nail. It’s one thing to analyze a bunch of data and know what you want to say about it, but it’s another thing entirely to convey those findings visually in a sensible way.
First of all, you’ll need to think about how much of the data to show, or what particular attributes or cross-sections of it are most pertinent to the story you’re telling. Then you’ll need to determine whether the data is best represented in a map, a chart, an infographic, or something else entirely. And there are seemingly infinite design determinations to make once you’ve chosen the vehicle. Striking the right balance when it comes to the visual representations of data will be a big part of the judging process.
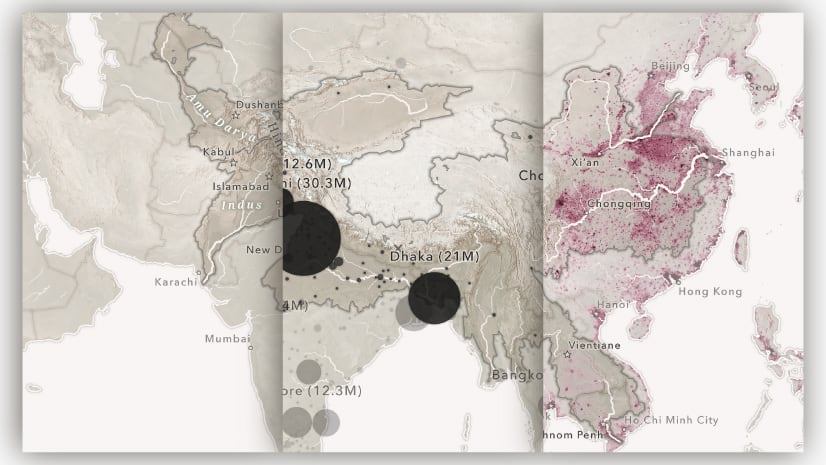
Example: The Lines That Shape Our Cities, Digital Scholarship Lab at the University of Richmond
This story takes a topic that many people may be aware of, but only vaguely familiar with—redlining—quantifies it, and then explains it through crystal clear examples of how the practice is still felt in cities around the U.S. today. It does so through a plethora of memorable cartographic displays, from “word maps” to 3d representations of a city’s terrain, ensuring that the story’s lessons will stick in the reader’s mind.

Additional resources: The question of how to best visualize data is so open-ended, it’s hard to know where to begin! The ArcGIS Living Atlas of the World’s blog page is a great repository for all kinds of data-related techniques and tricks; you’ll likely stumble on something that sparks some inspiration while perusing it. The StoryMaps team’s Cooper Thomas has also put together a thoughtful story about the use of charts in ArcGIS StoryMaps.
Special judging categories
Most effective visual language
As mentioned in the overall judging criteria, how a story looks is a key component of its impact and memorable–ness. This category will celebrate the story that most goes above and beyond in terms of creating a cohesive aesthetic that complements the story’s topic and mood.
Theme builder is one of the biggest tools in terms of creating a visual language for a story. Without having to leave the ArcGIS StoryMaps ecosystem, in just a few clicks you can design a story’s entire color palette, choose from over 1,000 fonts, and add other visual flourishes like a custom section separator graphic.
On top of story theming, the way media such as photos, videos, and of course, those data visualizations mesh with your story’s look and feel will also be a significant consideration in this category.
Example: What you CAN’T see in the Tennessee River, by Kellie Ward
This story took home the bronze medal in the college student track of our 2020 ArcGIS StoryMaps Competition for Sustainable Development Goals. One of the things that really made it stand out was its unified visual language, from its pleasant, aquatic-feeling blue-and-white custom theme, to the way infographics and other custom images and symbols matched that theme, to the strong mix of photos, videos, maps, and charts.

Additional resources: Tips on using the ArcGIS StoryMaps theme builder is a useful guide to the different capabilities offered by theme builder and how to avoid some missteps when creating a theme. Another relevant blog post is Hannah Wilber’s advice on using photography effectively in storytelling.
Most innovative use of data for storytelling
This category will focus exclusively on that intersection between data and storytelling. We’ll be looking at both the data element—is the analysis going deeper into the data than just number-crunching at the highest level?—and how it’s worked into the story in relatable but unique ways.
Like the data-related criterion in the overall judging, how storytellers approach this category is a very open-ended question. But it also gives storytellers the opportunity to be as creative as they want to be, which, in our experience, often leads to some amazing results.
Example: Segregation is Killing Us, by Territorial Empathy
The grand prize winner in our 2020 Competition’s professional track, this story used a number of data analysis techniques to show how long-standing, segregatory policies could be linked to the inordinate negative impact of the COVID pandemic on certain communities in New York City. The story employs seemingly every data visualization technique in the book, but keeps them all fresh, simple, and memorable.

Additional resources: When it comes to integrating data with storytelling, one of the trickiest aspects is figuring out how to take a lot of data and give readers a suitably scaled entryway to it. Our blog post Turn a dataset into a great story with ArcGIS StoryMaps looks at a few different strategies for distilling a huge, complex dataset into an enjoyable, informative read.
Best map choreography
It wouldn’t be an ArcGIS StoryMaps competition if we weren’t especially interested in seeing how storytellers are able to use some of the unique capabilities of ArcGIS StoryMaps.
One of those features is map choreography, the ability to set up a sequence of maps that change as the reader scrolls from one slide to the next. The maps can have different layers turned on or off, or be set to a different zoom level or geographic extent, or even just utilize a different basemap. These changes make the maps a key part of the storytelling itself, helping to draw out and highlight important points that the story is trying to make.
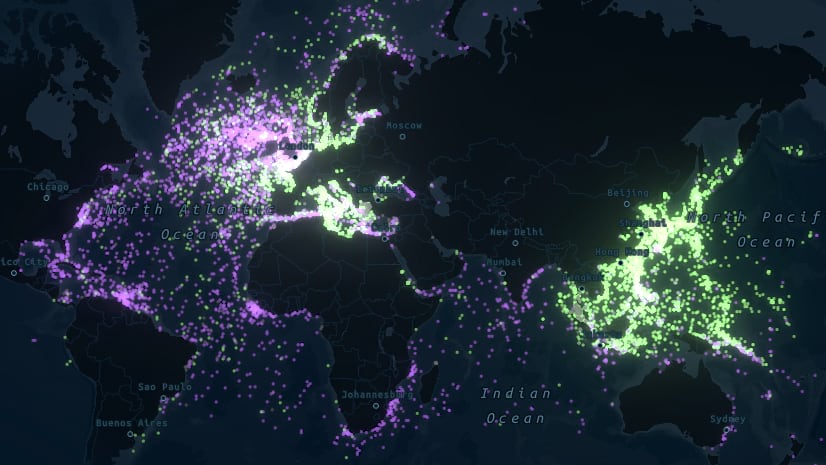
Example: Two of the StoryMap’s teams most recent stories, Resurfacing the past and Charging across the country, skillfully use map choreography to help introduce readers to two gigantic geospatial data sets: one consisting of every ship that was sunk during World War II, and the other containing the location of every electric vehicle charging station in the United States. In both stories, map choreography is used to drill down to smaller-scale anecdotes, which can be a good way for an audience to dip their toes into a lot of data.

Additional resources: Cooper Thomas has a blog post covering to the basics of map choreography, and John Nelson—one of the competition judges himself—also has a blog post and video dedicated to the technique.
____________________________
Every year, the ArcGIS StoryMaps competition turns into a showcase of the exemplary stories our talented community is telling, and we’re expecting this year to be no different.
If you’re still hunting for additional inspiration to kickstart your entry, check out this collection of interviews with our 2021 ArcGIS StoryMaps Challenge winners, which offer insight into the thought processes and strategies behind a winning storytelling formula. Another blog post, recapping the 2020 ArcGIS StoryMaps Competition, makes observations about a number of common threads that the winning stories shared.
So if you’re even thinking about tossing your hat into the ring, please don’t hesitate! Visit the competition home page again for more information on the requirements, submission process, and links to the galleries of past winners. We can’t wait to see this year’s crop of amazing stories!
____________________________
Cover illustration by Rudzhan, © Adobe Stock.


Article Discussion: