As climate change makes hurricanes more intense, GIS can help us prepare.
Hurricanes have been arriving on shores with increased ferocity in recent years, taking lives and burdening regions with hefty costs to rebuild.
Hurricane Irma bore down on the western coast of Florida in September 2017, causing power outages as far as its eastern coast. Without power and air conditioning, more than a dozen nursing home residents perished without power and air conditioning, and several hundred more are believed to have died in the weeks following because of the storm’s lingering impact.
Technology has a role in reducing and preventing the tragic impacts from happening, as witnessed during Hurricane Irma. Through programs like the Call for Code Global Challenge, developers and problem-solvers from around the world answer the call and leverage industry-leading open hybrid cloud technologies to tackle the world’s most pressing issues. Participants build technical skills that they can carry into their career endeavors, all while creating transformative solutions that can serve communities most in need. In 2018, the Call for Code Global Challenge winner Project Owl built an ad hoc mesh network of Internet of Things (IoT) devices to uphold communication systems when infrastructure is down from a battering storm. This solution epitomizes the need for technology to be front and center in managing the surges of natural disasters. The Project Owl team won $200,000 and support from IBM and the Linux Foundation to deploy its solution directly into the community. Esri is partnering with IBM and the David Clark Cause on the Call for Code Global Challenge by making its ArcGIS Platform technology available to developers to use in their solution.
Why is Esri partnering on the Call for Code Global Challenge? Sitting squarely in the middle of utilizing technology to assist during a natural disaster strike is geographic information system (GIS) software—making it possible for vulnerable populations exposed to natural disasters to prepare for the oncoming impacts.
Approximately 40 percent of the world’s population lives within 100 km of the coast that can be ravaged by some of the most costly and deadly storms, including cyclones and typhoons, according to the National Aeronautics and Space Administration’s (NASA) Socioeconomic Data and Applications Center. These natural disasters impact us at multiple stages—from the early onset of rough seas and navigation hazards to destructive winds coupled with coastal flooding and surges to the loss of utilities, lack of food and clean water, and dangerous debris.
Before the Storm
With populations rising, socio-economic divides increasing, environmental landscapes in motion, and storms increasing in intensity and cost, the way we prepare for certain hazards and build resilience has to change. Integrating a geospatial approach is the key.
Climate change is likely increasing the intensity of tropical cyclones around the world, but the patterns are not the same in all of the world’s ocean basins. This map shows the results of an analysis of the international archive of hurricane track data dating back to 1980. We can see that the three most active basins (West Pacific, East Pacific, North Atlantic) are all emerging or persistent hot spots for increasing wind speeds over time.

As shown in the map above, leveraging GIS helps us identify especially vulnerable areas and areas that may be at risk, which are a key target for resilience planning.
Studies also show that these hazards disproportionally affect the most vulnerable among us. Social inequities are exacerbated by natural hazards when they strike. To take action when needed as a storm closes in, and rebuild and recover after the fact, those without access to necessary resources to prepare for and mitigate their risk should be at the center of our planning efforts.
How can GIS help in a case like Hurricane Irma’s devastating impact on the elderly and people with disabilities? Below we can see a map of the National Oceanic and Atmospheric Administration’s (NOAA) wind forecast for Irma along with the location of publicly available nursing home data from the Department of Homeland Security.

Using GIS technology, it is simple to intersect areas with wind thresholds that may cause power outages and use interactive visualizations to understand and prioritize specific populations at risk, either by locations with the greatest wind threat or those with the highest population.
With the coronavirus disease (COVID-19) pandemic still affecting the world’s population, planning for how to evacuate and house those in need is more critical than ever. ArcGIS from Esri, the worldwide software leader in location intelligence, provides the tools to visualize and assess potential impacts to the built environment and general population and to understand exactly who might be impacted and what resources they might need to be more resilient. During the early stages of the global pandemic, the use of infographics (like the example below) in ArcGIS Business Analyst Web App allowed communities to better assess and prepare a more equitable response.

The use of these capabilities is not restricted to experts. Using GIS technology like ArcGIS Platform, developers can design and launch open applications that leverage The Science of Where, such as the Hurricane Aware dashboard, and shed light on populations, infrastructure, and environments at risk. For those who want to configure rather than customize, ArcGIS Web AppBuilder allows a person to focus on the data science and visualization and use the widget framework to quickly build and launch apps like the Resilience Analysis and Planning Tool (RAPT) from the Federal Emergency Management Agency (FEMA).
During the Storm
When the storm does make landfall, time is of the essence, and one must be ready with tools and solutions that help solve immediate operational challenges. The impacts from these storms are often felt far inland and differ greatly—where a coastal community may deal with surges, areas 1,000 km away may have severe riverine flooding.
Here at Esri, we’ve worked on crises and disaster response for more than 27 years via our Esri Disaster Response Program (DRP), and we have learned a lot about the common challenges organizations face in response to any emergency. Without fail, organizations need solutions that help them
- Monitor rapidly changing conditions.
- Understand the potential impact.
- Assess damage in the field.
- Brief and coordinate response partners.
- Communicate and inform the public and media.
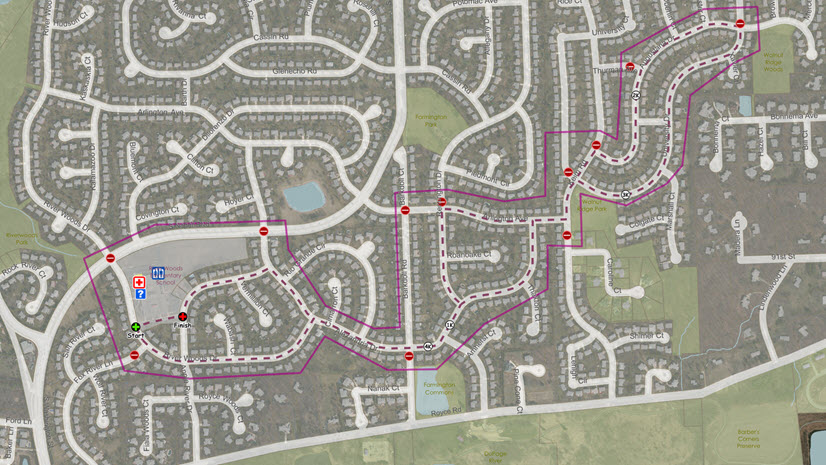
There are many great examples from the community that show how organizations are using GIS to solve these five key challenges. You can explore some of our favorites here in this user gallery.
Responding quickly with real-time information is crucial to the overall success of short-term recovery efforts—especially when it comes to documenting and submitting the initial damage assessment. The Esri DRP ArcGIS Hub site is full of resources to help you plan for the response phase of hurricane preparedness.
After the Storm
Once the storm has made landfall and the immediate threat has passed, the focus turns to life and safety issues like search and rescue. Organizations like the United Nations’ International Search and Rescue Advisory Group (INSARAG) rely on GIS to deploy and track field teams and collect data that helps a community start the road to recovery. They rely on mobile tools like ArcGIS Survey123 to collect data in austere, disconnected environments while keeping location at the center of the data effort. They then use ArcGIS Dashboards, a configurable app, to aggregate and report on data as it is synchronized from the field.
Almost in parallel, the road to recovery begins with the initial damage assessment—the building-by-building documentation of what damage the storm inflicted. While tools like those used by INSARAG are often used by organizations when damage is widespread or there is a pandemic, GIS offers additional opportunities for solutions to be developed. Organizations can crowdsource damage reports directly from the community and, using deep-learning tools in ArcGIS, developers can help exploit postevent imagery for a rapid assessment that helps prioritize additional resources for the community.
Too often, organizations rely on historic context as the foundation for preparedness, which does not account for the ever-increasing systemic nature of risk in our communities. We need tools that help us better understand and put the risk from storms that continue to increase in intensity and cost in context with the underlying chronic stressors that keep our communities from becoming more resilient.
GIS provides a way forward—integrating data from within an organization, between partners, and across sectors—to assess and plan through a more equitable lens. Apps built using location intelligence can deliver solutions that not only provide the necessary content for critical decisions but also the necessary context to help ensure communities make the right choices that will help them move toward a more sustainable and resilient future.
If you’re feeling inspired to leverage technology for a worthy cause, there’s no better time to build your skills and make the world a better place and join the 2021 Call for Code Global Challenge. Take on climate change and submit your tech solution for a chance to win $200,000 and see your solution get deployed in the field. Once you join the challenge, create an ArcGIS Platform developer account, get started using ArcGIS Platform to help deliver critical, location intelligence solutions.