ArcUser Online
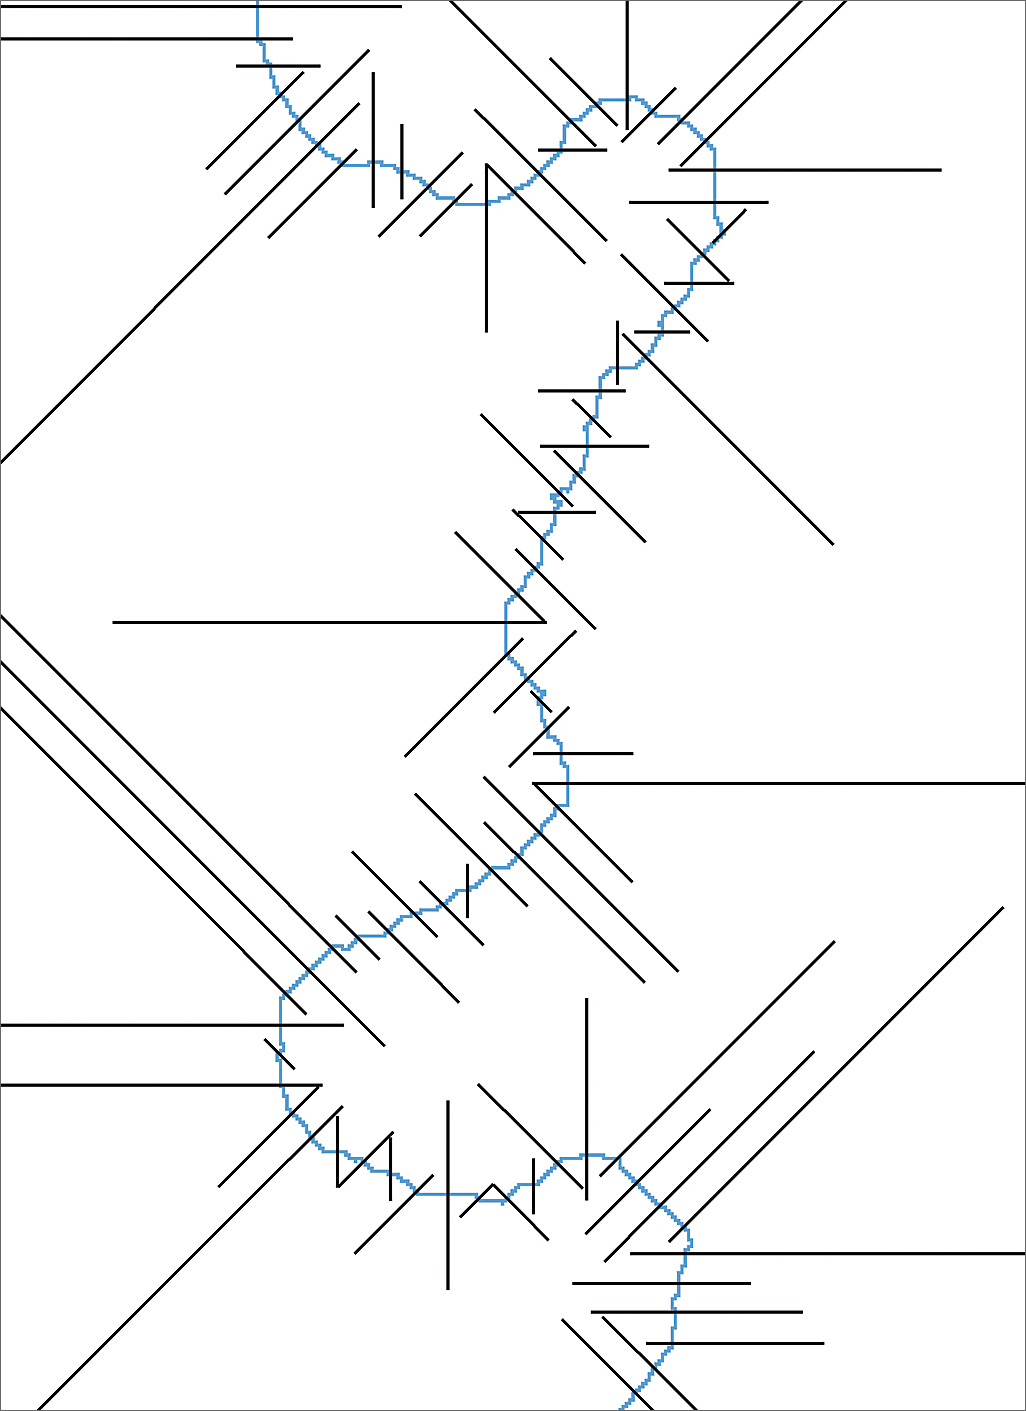
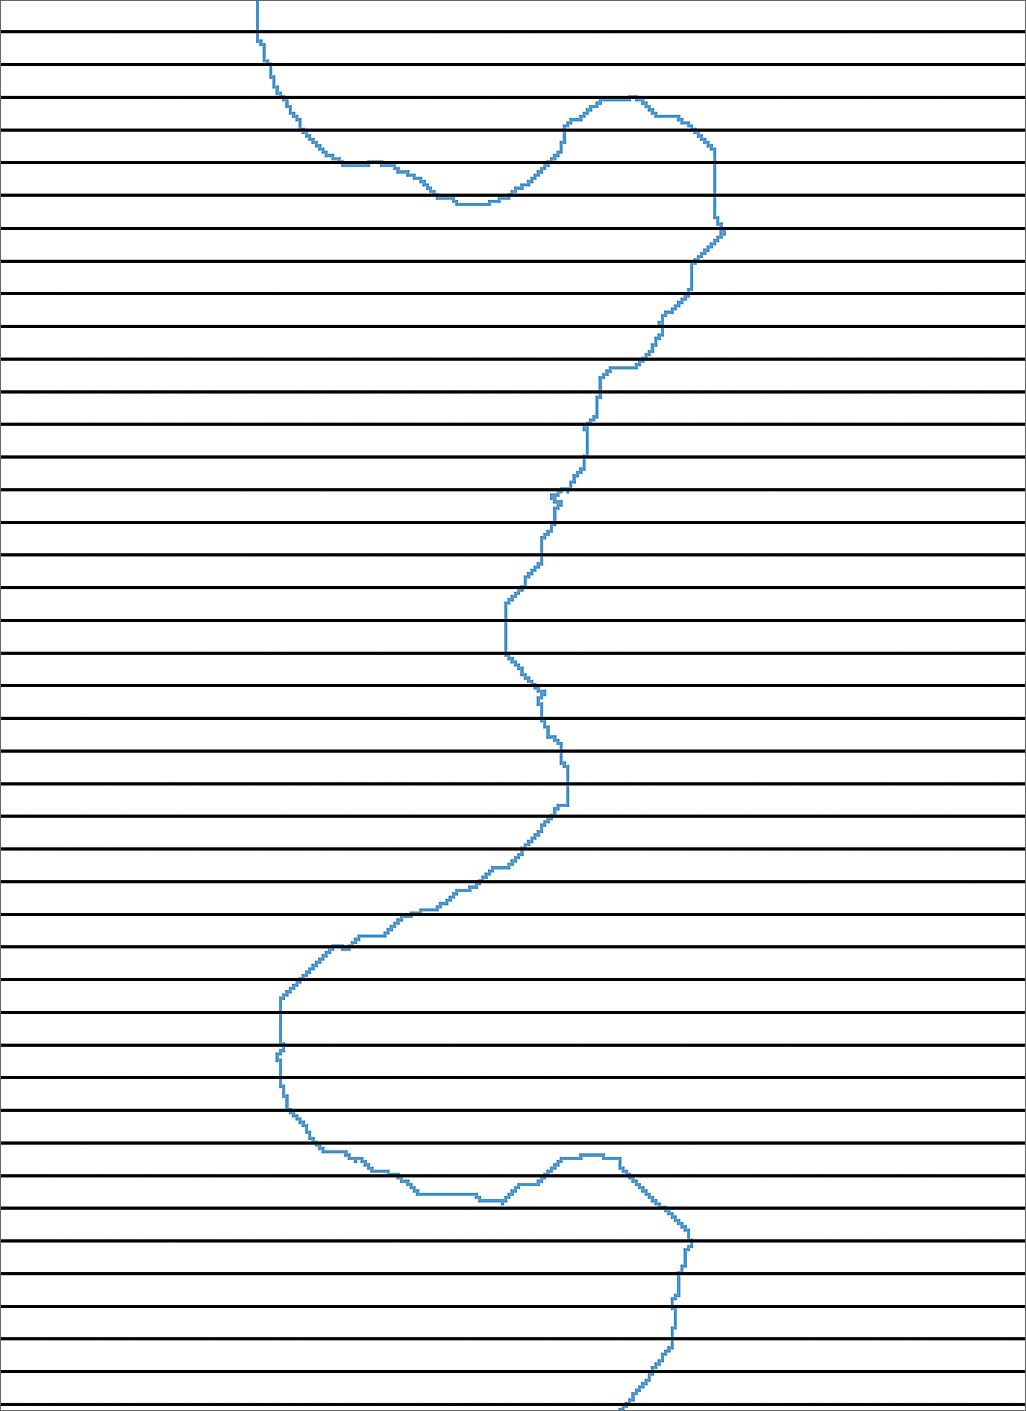
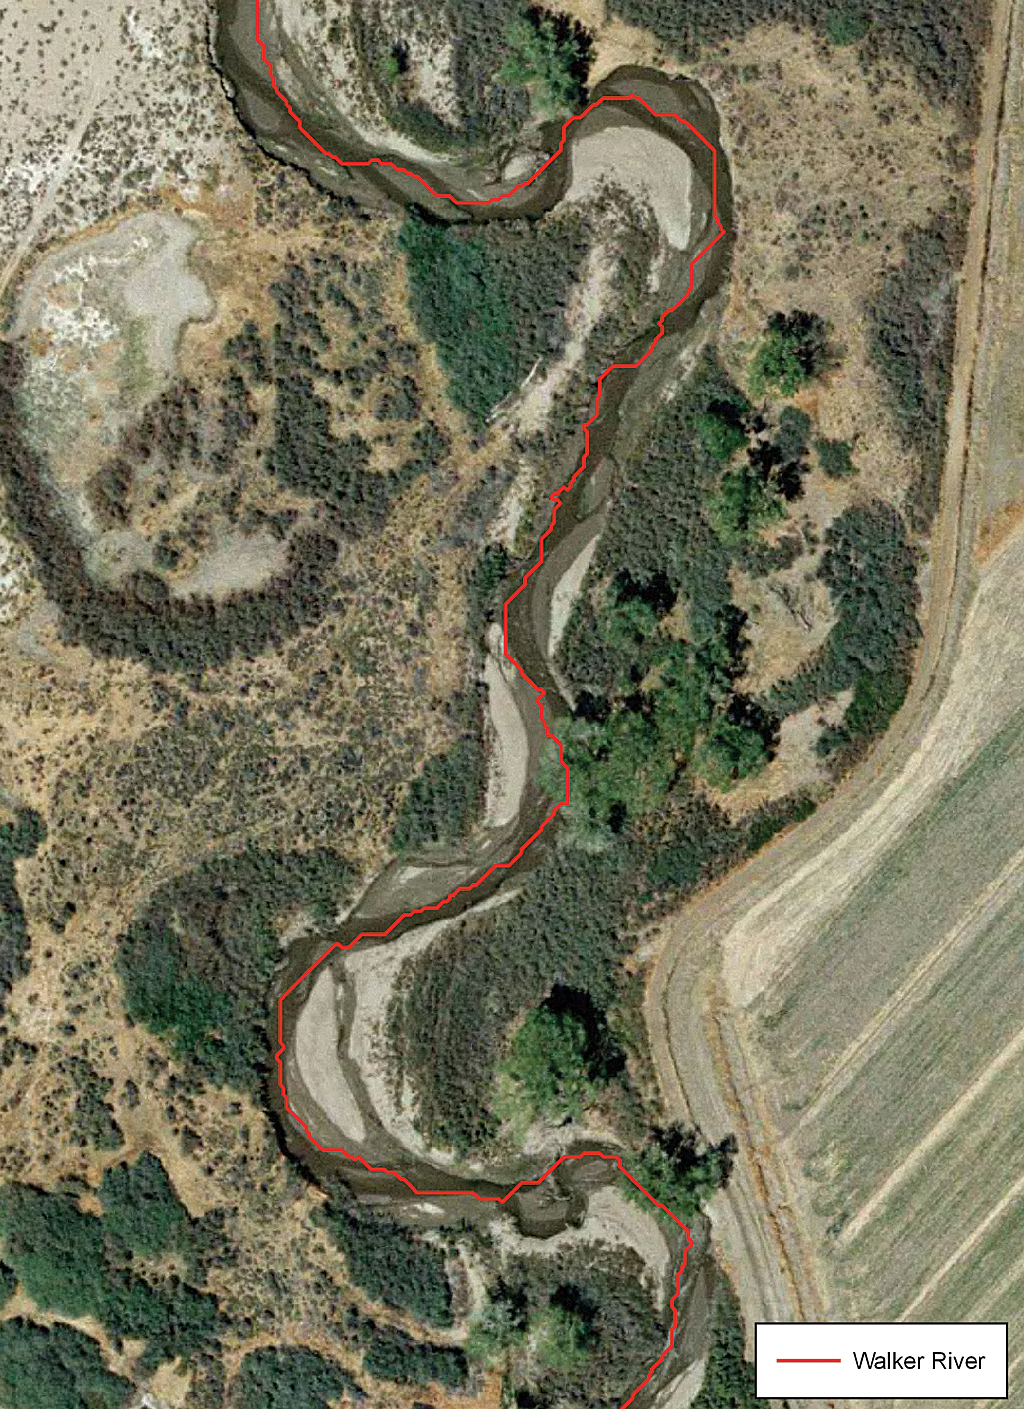
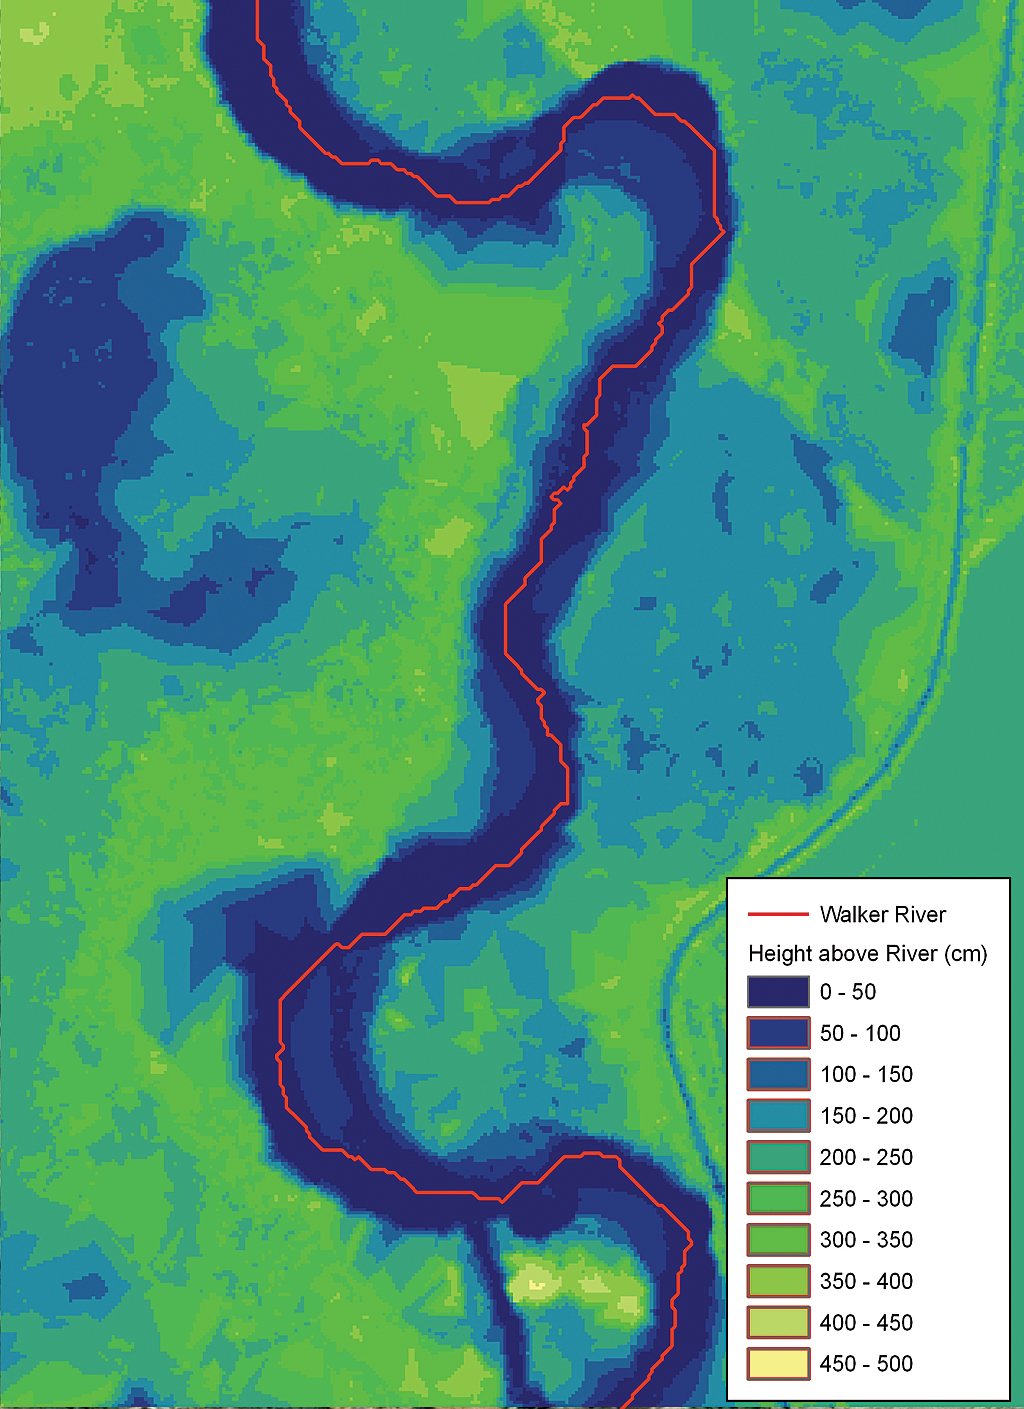
Deriving HAR from Lidar DataDeveloping cross section profiles akin to traditional survey methods posed a number of problems. It is time consuming to digitize the thousands of cross sections that would be required to cover the entire 200-mile stretch of the Walker River, which runs from the Sierra Nevada range in eastern California to Walker Lake in western Nevada. However, automated approaches for generating transects also entail problems. If the transects are generated perpendicular to the river, the density of transects is less on the outside of a river bend than on the inside of that river bend. If transects are generated perpendicular to one another, they do not always cross the river at right angles. One-dimensional methods also suffer from problems because points located on different transects may be close to one another geographically yet have very different values because the transects they are on intersect the river at different elevations. When producing a predictive map from such data, the result is many abrupt changes over small areas that make the map difficult to interpret. The authors of this study considered two-dimensional methods as an alternative to the traditional one-dimensional method of constructing stage elevation from lidar data. Hydrologic functions in the ArcGIS Spatial Analyst extension were used to fill the DEM (i.e., to remove local "sinks" caused by errors in DEM construction) and calculate flow direction and flow accumulation for each grid cell. The resulting flow accumulation grid was reclassified and subsequently edited so that the resulting stream network only included cells where the Walker River was located. A custom model was developed using ArcGIS ModelBuilder to calculate HAR. The model uses the Spatial Analyst extension's kernel density function to calculate a distance-weighted average of river elevations, where cells in the river that were nearer to the upland grid cells receive a greater weight than cells located farther away. The weighted average river elevation was then subtracted from the elevation of individual grid cells to derive HAR for each location. ModelBuilder, part of ArcGIS Desktop, was also used to derive additional variables from the HAR grid. Spatial Analyst cost-distance functions were used to identify grid cells below a user-specified HAR threshold that were physically connected to the river channel. This algorithm was extended iteratively using ModelBuilder to calculate inundation areas at one-centimeter vertical intervals up to five meters above the river. The inundation values from each iteration were summed and subtracted from 500 to get a flood height grid. The flood height grid describes the flow stage required to inundate a given grid cell, assuming a simple bathtub model. [A bathtub model is a steady-state water quality model for simplifying the assessment and prediction of conditions in reservoirs and lakes as related to eutrophication.] Low-lying cells separated from the river by higher ground required a flood height greater than the HAR value. ResultsThe HAR method described here produced maps that were smoother, easier to interpret, and required less time to produce than ones created using comparable one-dimensional methods. All calculations were performed using ArcGIS and the Spatial Analyst extension and did not require fieldwork. The kernel size can be adjusted to vary the extent and smoothness of the height-above-river map. Larger kernel sizes incorporate longer stretches of the river into the calculation allowing greater mapping extent and a smoother surface. A smaller kernel size results in a smaller extent but more detailed and more precise estimates.
Estimates appear to be most accurate along low-gradient stretches of the river with few tributaries. These are precisely the same areas where a typical low-resolution DEM would have the most difficulty detecting subtle changes in elevation. Stretches of river with a non-linear gradient and tributaries with strongly differing gradients are likely to produce less accurate results. HAR and flood height were incorporated into statistical models to predict the distribution of vegetation communities within the Walker River Basin. When predicting the 10 major vegetation communities in the basin, HAR and flood height were the first and second most important predictor variables. Wetland vegetation and communities dependent on frequent flooding exhibited the lowest HAR values, while communities that tended to be located farther from the river but were still dependent on groundwater exhibited higher HAR values. Upland communities able to tolerate low water tables had the highest HAR values. Future DirectionsAs restoration efforts move forward for the Walker River Basin, HAR and flood height maps will be incorporated into a decision support system that helps land managers identify low-lying areas that can be reconnected to the river channel. Using HAR and flood height maps will help minimize costs by targeting areas where restoration is most likely to be successful. Currently the Great Basin Landscape Ecology Lab is using Toolbox for Lidar Data Filtering and Forest Studies (Tiffs) software developed by Qi Chen to delineate individual tree crowns derived from lidar. The individual tree maps will be used to map bird habitat and improve on existing vegetation maps for the Walker River Basin. Finally, the authors plan to make the HAR and flood height models available to the GIS community as part of the Riparian Topography Toolbox, which will be available on the ArcScripts Web site (www.esri.com/arcscripts). For more information, contact Thomas E. Dilts AcknowledgmentsThe project was funded by a grant under Public Law 109-103, Section 208(a), through the U.S. Bureau of Reclamation (Cooperative Agreement 06FC204044). The authors thank Dr. William Huber who suggested the idea of using weighted averaging for measuring height above river and using the cost-distance function for determining connectivity with the river channel. ReferencesAuble, G. T., M. L., Scott, and J. M. Friedman (2005), "Use of Individualistic Streamflow-Vegetation Relations along the Fremont River, Utah, USA to Assess Impacts of Flow Alteration on Wetland and Riparian Areas," Wetlands 25:143�154. Bendix, J. (1994), "Scale, Direction and Pattern in Riparian Vegetation-Environment Relationships," Annals of the Association of American Geographers 84:652�665. Chen, Q. (2007), "Airborne Lidar Data Processing and Information Extraction," Photogrammetric Engineering and Remote Sensing 73:109�112. Stromberg, J. C., R. Tiller, and B. D. Richter (1996), "Effects of Groundwater Decline on Riparian Vegetation of Semiarid Region: The San Pedro River, Arizona," Ecological Applications 6:113�131. About the AuthorsThomas E. Dilts graduated from the University of Alaska, Fairbanks, with a bachelor's degree in geography in 2001 and from the University of Nevada, Reno, with a master's degree in geography in 2007. Currently, he is a GIS analyst/research scientist in the Great Basin Landscape Ecology Lab at the University of Nevada, Reno. Dr. Jian Yang is a postdoctoral researcher at Great Basin Landscape Ecology Lab at the University of Nevada, Reno. He received his bachelor's degree in geography in 1997 and his master's degree in ecology in 2000. In 2005, he received his doctorate in forestry from the University of Missouri. His Ph.D. work focused on forest landscape fire and succession modeling. He was the developer of the LANDIS fire module, which has been applied in many ecosystems across the United States (e.g., California, Missouri, and Wisconsin). Dr. Peter J. Weisberg is an associate professor of landscape ecology in the Department of Natural Resources and Environmental Science at the University of Nevada, Reno, and director of the Great Basin Landscape Ecology Lab. He obtained his bachelor's degree in forest biology from the State University of New York (SUNY) College of Environmental Science and Forestry in 1992. He received his master's degree in geography from the University of Wyoming and his doctorate in forest ecology from Oregon State University. His research interests in a landscape ecological framework include treeline change, fire history and forest dynamics, and ecological modeling of ungulate competition and herbivory effects. |
|||||||||||||||