ArcUser
Summer 2012 Edition
Displaying Points
Using symbol levels to optimize point display
By Mike Price, Entrada/San Juan, Inc.
This article as a PDF.
Because ArcMap typically draws points in ascending table order, when displaying a complex point set that has closely placed points, low-grade samples often cover nearby high-grade samples. To properly view and interpret the high-grade data often requires zooming in to rather large scales.
To begin, save the completed Battle Mountain map document as Battle_Mountain02.mxd and remove all geodatabase point data.
One solution was to sort the data in descending order, save the sorted dataset as a new table, and repost the points as an event theme. Although this works, it requires separate sorts for all elements. If new points are added, all changed datasets must be re-sorted and reimported.
Symbol Levels, available in ArcGIS for Desktop 10 and 9.x, helps solve this problem. This layer property lets you override the default drawing order of features in ArcMap and control the drawing order and position in relation to other symbols. To see how Symbol Levels can help you draw low-grade points first and high-grade points last, use the data from the completed exercise described in "Prospecting for Gold: Building, mapping, and charting point geochemical data" to re-create the levels used in the tutorial using the workflow described here.
Posting Raw Data Points
To get started, save the completed Battle Mountain map document as Battle_Mountain02.mxd and remove all geodatabase point data.
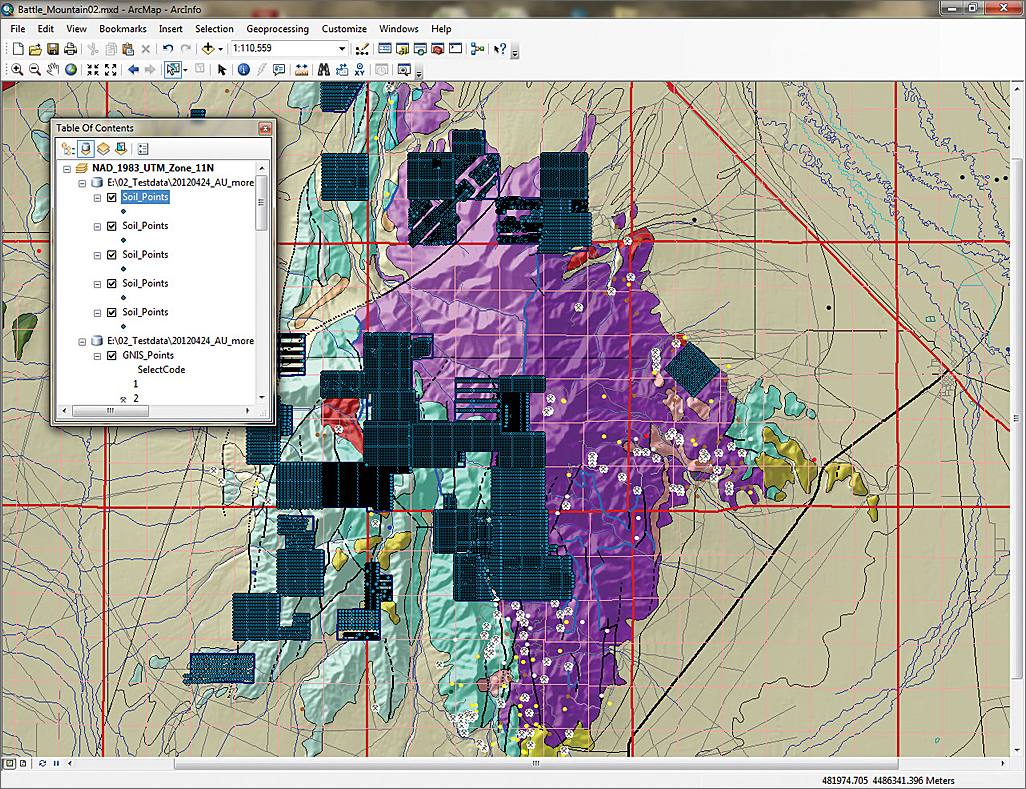
- In data view, zoom to 1:120,000 scale and center the map extent on Battle Mountain. Click the Add Data button, navigate to \Battle_Mountain\GDBFiles\Geochemistry.gdb, and add Soil_Points.
- If you would like to use Symbol Levels on all five elements, add or copy five instances of this dataset. Rename your dataset(s) using the convention Soil Points, <name of element>.
- Import legends for these soil layers from Battle_Mountain01.mxd. Importing only the legend transfers the point size and color for each element but doesn't change the display order.
Notice that many high-grade gold samples appear to be merged with lower-grade orange and yellow points. Even the larger size of the high-grade points does not make them easy to see at this scale. To properly view these clustered points, zoom in until they appear as unique features—probably a scale larger than 1:25,000 to eliminate overlaps. You could set a reference scale now, but as you zoom back out, points become too small to be meaningful, so try Symbol Levels.
Add Soil_Points back and import the legends from Battle_Mountain01.mxd. This will transfer the color and size of the point symbols but will not affect their drawing order. Consequently, some lower-value data points obscure higher-value data points.
Looking at the drawing order in the Advanced View dialog box for symbology, it is clear the drawing order can be improved.
Understanding and Applying Symbol Levels
The secret to building and applying symbol levels is to create a logical, well-designed legend for each point set. If you classify point or polyline data using Categories or Quantities, select a style that will separate your data into meaningful groups.
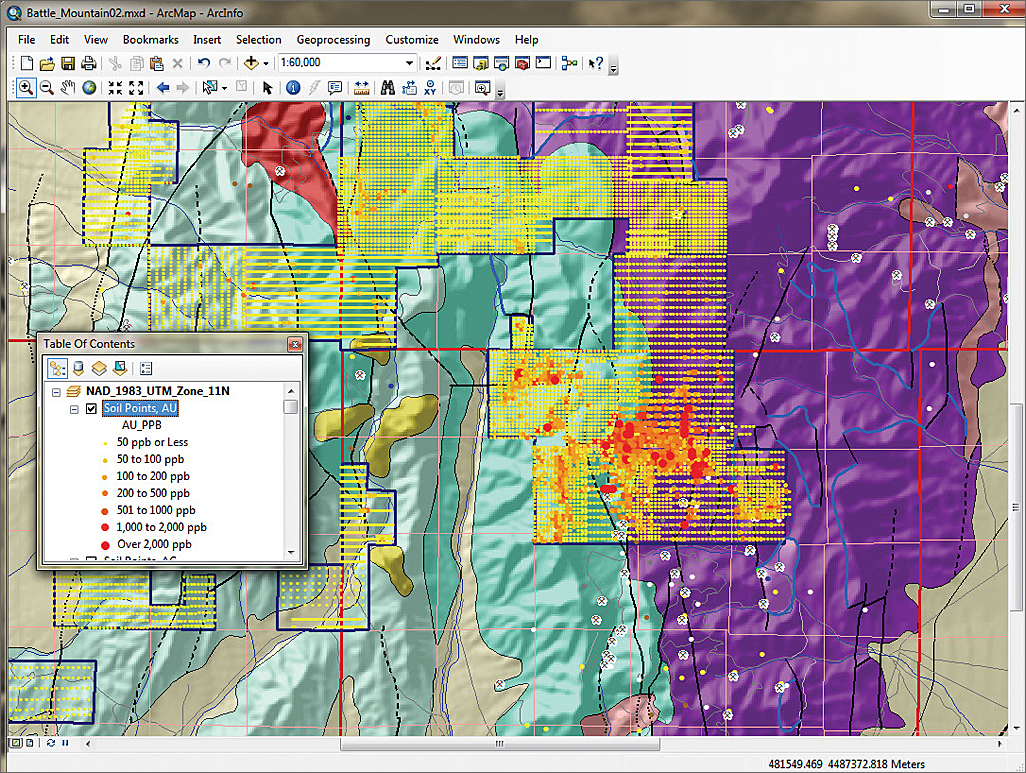
Because the gold geochemistry represents continuous numeric data with an approximate log-normal distribution, a graduated color and symbol legend works well. Define breaks that divide the population into similar-sized groups or bins and place the most important bin at one end of the range. In the Battle Mountain exercise, gold data had seven breaks at 50, 100, 200, 500, 1,000, and 2,000 parts per billion (ppb). Because the high value points (those over 2,000 ppb) are spread throughout the dataset, they are often hidden by lower values that post later as the layer is drawn. Symbol Levels can be used to float these high-grade values to the top of the drawing order.
- In the table of contents, right-click Soil Points, Au and choose Properties, and click the Symbology tab. Inspect this thematic legend. Click the Advanced button in the lower right corner and select Symbol Levels.
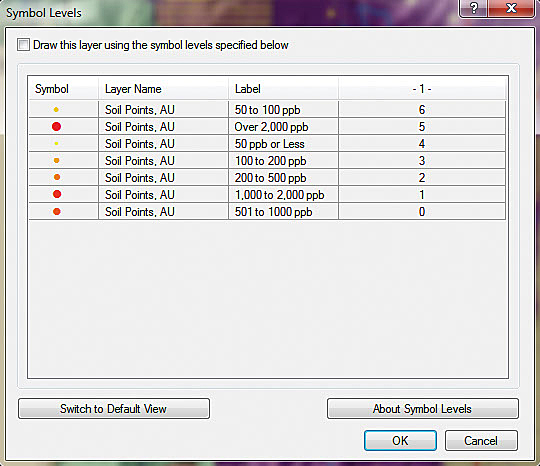
- When the Symbol Levels wizard opens, inspect the sorting order. The high-grade points may be at the top of the display series, which would be desirable. If they are not in that order, the next few steps will fix that situation.
- To activate Symbol Levels, check the box beside Draw this layer using the symbol levels specified below, and click Switch to Advanced View. In Advanced View, renumber the drawing order of symbols so the class with the lowest integer value will draw first starting with 0 or 1 and incrementing the number assigned to each level by one integer. Click OK twice to apply the changes and watch the map redraw.
- The highest-grade gold values are now drawn last and appear on top of all other values. Now, it is easy to see the high-grade points.
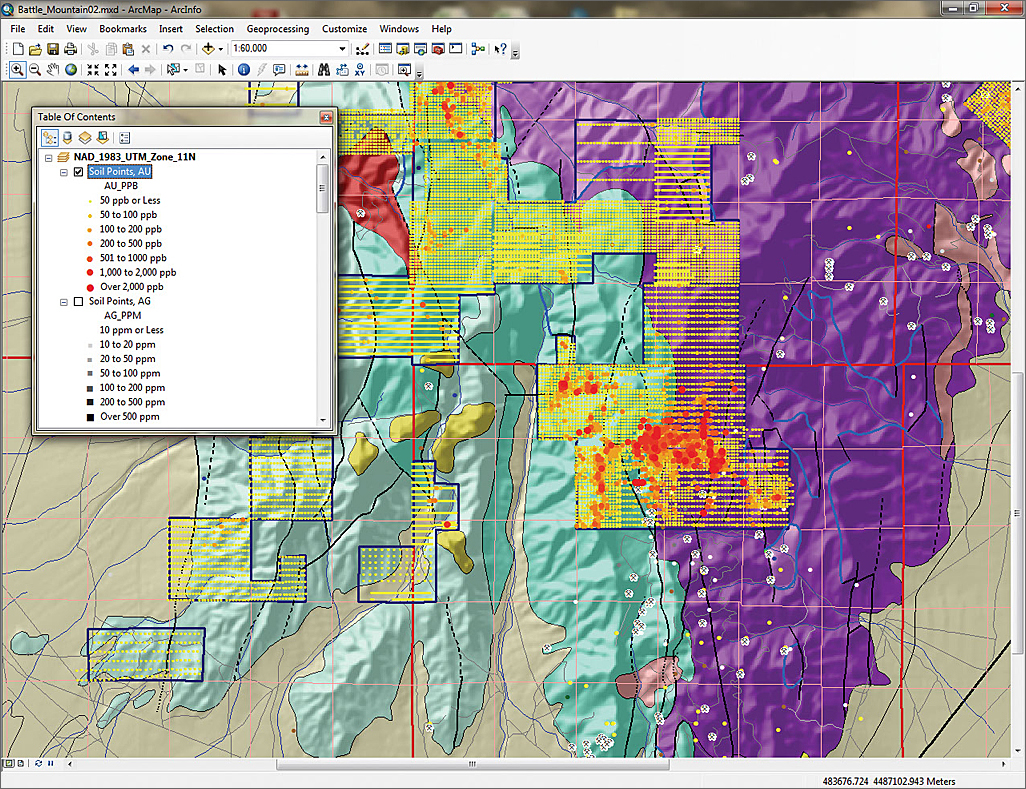
By controlling the drawing order using Symbol Levels, the higher-value data points are now visible.
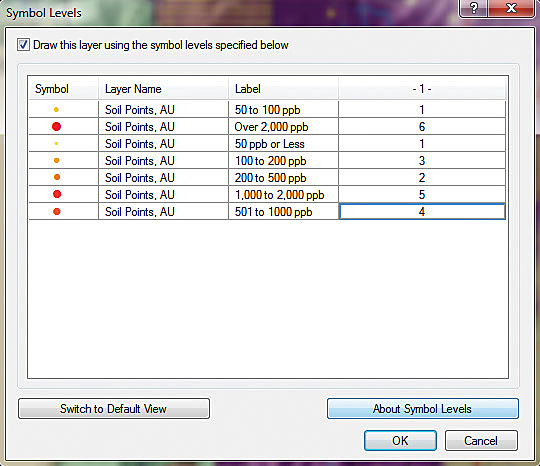
To make sure low-value data points are drawn first, assign low numbers in the Symbol Levels dialog box.
Symbol Summary
It is easy to apply Symbol Levels to a well-designed legend, and it certainly contributes to colorful, informative maps. Import and apply symbol levels to the other soil geochemistry data used in the exercise.