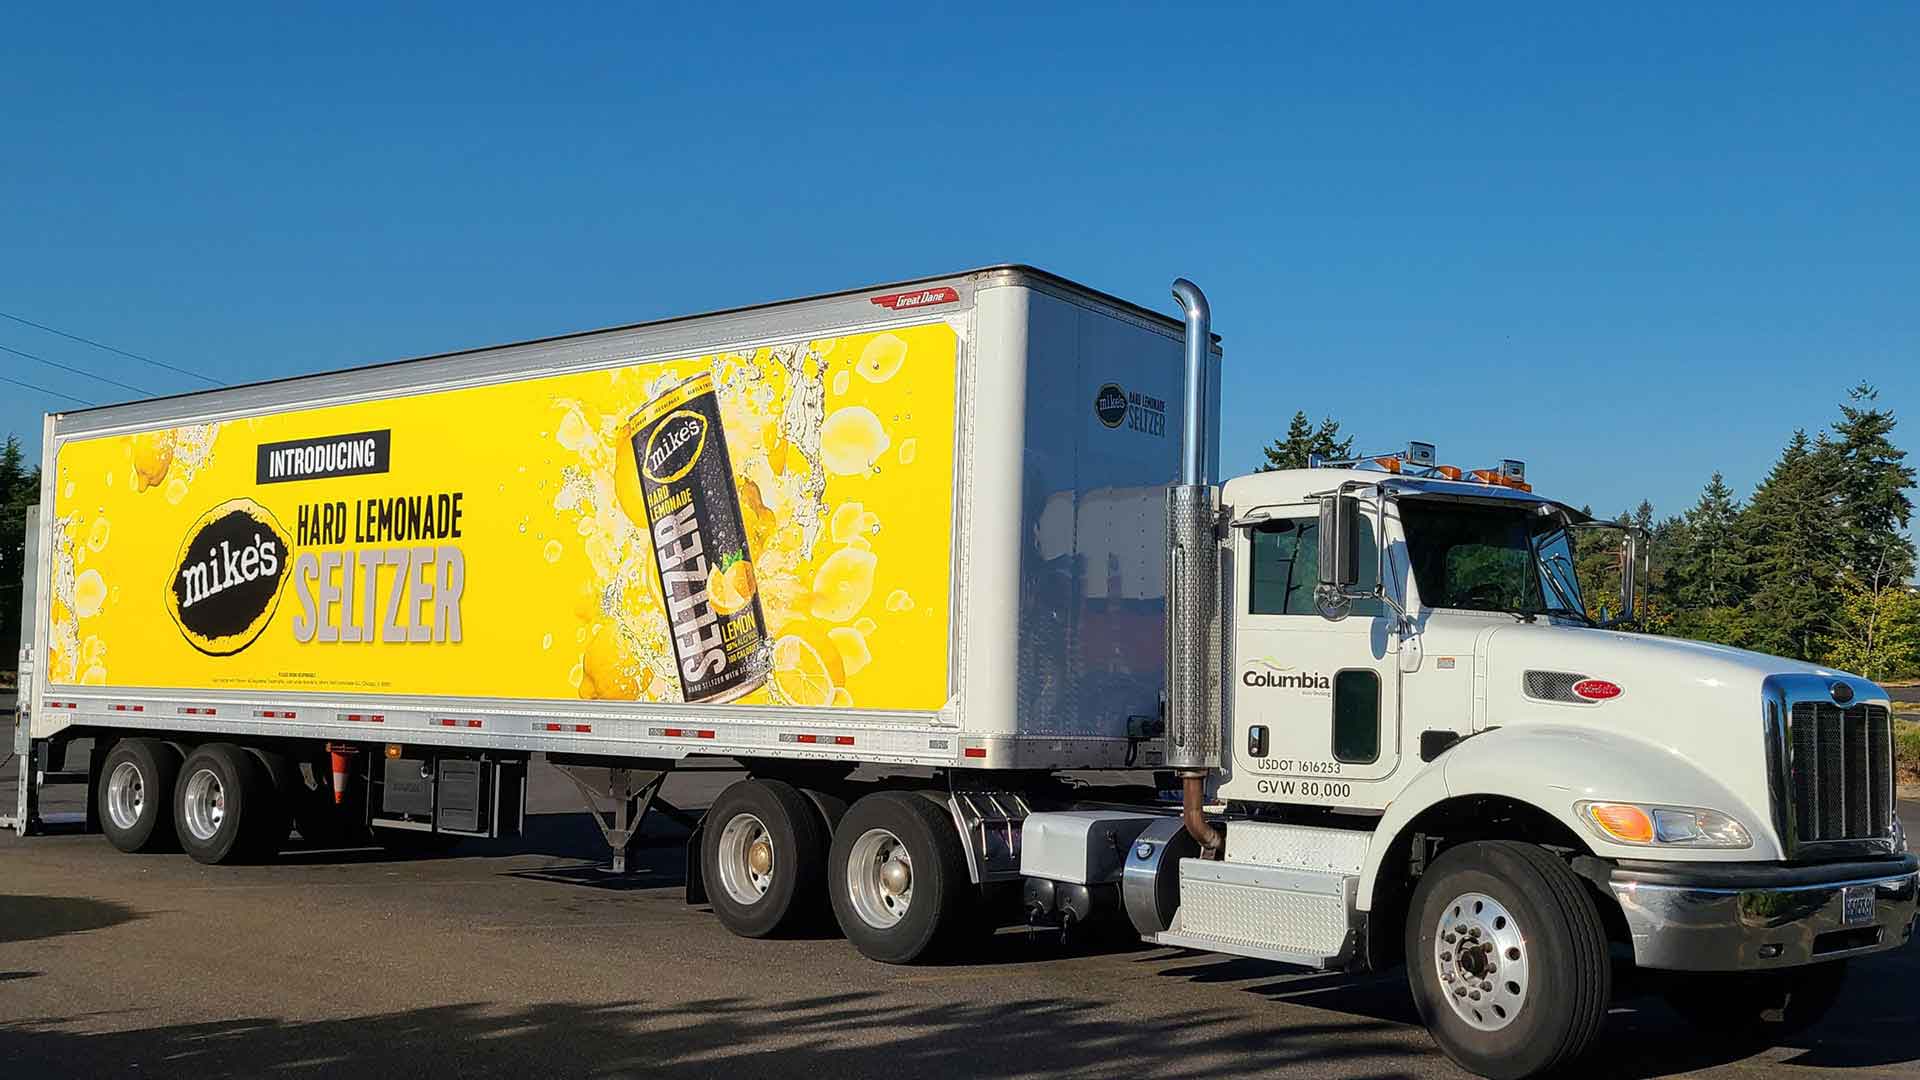
On an eight-lane highway between Tacoma and Seattle, a data-driven innovation is rolling north, affixed to the sides of an 18-wheeler.
Empowered by geographic awareness, advanced analytics, and demographic insight, companies are breaking out of traditional business lanes to deliver new services to customers. Among them is the nation’s third-largest beverage distributor, which is pioneering a new advertising program on the highways of Washington, Oregon, and Northern California.
“We like to be first to market on new things,” says Koji Pupo, vice president of business development at Columbia Distributing. “Typically, if you’re not the first, you’re always trying to catch up.”
That may be especially true in the beverage industry, where consumer tastes can change rapidly, and manufacturers and distributors must continuously track and make sense of data to keep up. From 2017 to 2021, hard seltzers rocketed from near nonexistence to $4 billion in sales—5 percent of the alcohol market—a run-up that took some brands by surprise. Now, as seltzer sales cool, ready-to-drink cocktails and nonalcoholic beers are on the rise.
Beverage manufacturers design marketing campaigns to address those changing tastes. But until 2021, the advertising space on the sides of Columbia Distributing’s trucks—much like the rest of the industry’s—was built for longevity, not changing tastes.
Then Columbia’s executives took a risk.
Columbia Distributing Seeks a New Program to Match the Pace of Business
Founded in 1935, Columbia Distributing delivers 260 alcoholic brands and more than 50 nonalcoholic brands to restaurants, retailers, bars, and entertainment venues in the Pacific Northwest. For decades, Columbia and other distributors had “wrapped” their trucks in vinyl ads easily visible to drivers and pedestrians. One study found that viewers were more likely to recall this kind of advertising than they were to remember stationary messages.
In most cases, those ads stayed on the vehicle as long as it was in service.
“Our supplier partners would have to choose a graphic that was going to stay on the truck for five to seven years,” Pupo says. “You had to be very safe with the messaging that you were putting on the sides of the trucks because you had to make sure that it was going to be applicable for the time frame that it’s on.”
Columbia’s executives envisioned an advertising program that would match the pace of modern business and the mercurial tastes of consumers. It would offer two new benefits to beverage manufacturers: the versatility to change ad campaigns more often, and the visibility to know how many people were seeing their ads. Marketers have come to expect both features in today’s digital economy, with the popularity of pay-per-click programs that deliver metrics like click-through-rates, impressions, and more.
Versatility wasn’t hard to come by. Columbia used Epic Worldwide’s KWIK ZIP system to affix special frames to the sides of trucks, allowing ad displays to be installed and removed with only minor downtime. Columbia’s second goal—providing visibility into the audience for each ad—proved more elusive.
An Innovation in Need of Data
Each Columbia truck covers a dedicated route averaging 40 miles, passing an unknown number of drivers, pedestrians, and businesses along the way. To gauge that number, Pupo’s team needed access to a modern brand of location intelligence, but no one was sure where to find it.
As 2021 dawned and planning for the advertising upgrade reached a critical stage, Pupo hired Jesse Holder as program manager. Holder inherited the challenge of calculating ad impressions—a task that felt like counting grains of sand on a beach. Is it even possible to capture impressions for a moving object? Holder wondered.
But the challenge invigorated him. “This is going to be a fun project to tackle,” he thought.
At that point in his career, Holder had worked in urban planning and construction management, taught English in China, and managed sales and marketing at his family’s brewery in Tacoma. But he hadn’t worked with trucks—much less trucks that doubled as roving billboards. And yet one footnote in his diverse career turned out to be the breakthrough Columbia needed to deliver a truly innovative ad program to its suppliers.

Wrapping a truck the traditional way and sending it out on the road was the distribution world’s equivalent of placing a banner ad on a web page circa 2002. Columbia’s executives wanted to give suppliers a smarter program with a better return on investment.
Failing Fast on the Road to Innovation
Holder studied Columbia’s business. He learned that the company operated more than 500 distribution routes in Washington, Oregon, and Northern California, with a fleet of more than 600 vehicles ranging from 14-foot box trucks to 53-foot transfer trailers. Under the upgraded program, an ad would stay on a truck until a supplier swapped it out, and each truck would run a dedicated route week in, week out.
Holder began to brainstorm on how they might count impressions. “We knew it was doable, but we didn’t know how,” he says. The initial ideas relied on brute force, not off-the-shelf data or analytics. In one instance, Holder and Columbia’s data analysts considered adapting a practice used to count billboard impressions—pneumatic tubes that sit on a road and register each passing car. The technique works well for a single stationary installation, but Columbia’s trucks traveled dozens of miles a day over scores of highways and surface roads. The coverage area was simply too vast.
Undaunted, Holder and Pupo thought about the data that was already available on the nation’s transportation corridors. That’s when Holder hit on the idea of traffic cameras. They are nearly ubiquitous, and often available to the public online.
It was a lightbulb moment, and it kindled hope that Columbia could deliver the data-driven visibility its suppliers valued.
Taming Complexity with GIS Technology and Location Data
Holder wondered if the team could write a program to “watch” camera feeds, identify and count vehicles, and match those counts to each truck based on when it passed the camera. Then they could stitch together all the counts on a given route and estimate the total number of impressions for that ad.
Holder thought about his classes in urban planning. “I went back to my college days where I thought, ‘Well, we need a geospatial fix for this, right? Why don’t we use GIS?’”
In government and business sectors, geographic information system technology is nearly as ubiquitous as today’s traffic cameras. It’s at work wherever professionals answer questions about what is happening where, what has happened, and what should. City planners use GIS-based digital twins to manage construction projects. HR leaders rely on it to find the right labor pools for dark stores or R&D centers. Supply chain executives consult GIS dashboards to predict climate risk decades into the future.
If Columbia’s data scientists could create a program to monitor cameras, Holder figured, GIS could perform the analysis to connect each tally to its geographic route. It was a creative idea, but like the pneumatic strips before it, it wasn’t practical. With so many trucks, routes, and miles to calculate, Columbia’s small team of data analysts would be buried in data gathering and programming tasks.
“After we went down that rabbit hole, we decided, ‘No, that is an absolute mistake,’” Holder says. “That’s going to be a waste of time and money.”
Today he laughs as he recalls the teams’ early efforts. But at the time, he was frustrated, and they were at another creative dead end.
Calling the Location Experts
In search of a simple, off-the-shelf answer, Holder consulted a team of GIS experts who quickly identified the kind of location intelligence Columbia needed to address the challenge. GIS software could create a digital viewshed around each truck—a radius of several hundred feet within which people could see the ad. Then, using GPS data, Columbia’s analysts plotted each truck’s journey on a GIS map, revealing which areas the viewshed covered along the route.
All that was missing was one piece of data—information on how many people were in the viewshed along the route. The answer came in the form of human movement data. Based on anonymous cell phone records, human movement data is a key tool for determining the number of people in a given location at a given time—and it’s available off the shelf. Retailers use it to locate new stores. Highway planners use it to optimize the timing of roadwork. Health-care providers consult it to identify the need for hospitals, urgent care centers, and medical offices.
Holder and his colleagues used GIS analytics to make sense of the various data streams—including how the truck and its viewshed moved through space and how many people were in the viewshed at each point along the journey. The geospatial technology performed those calculations across 40 miles of terrain for hundreds of routes.
“The GIS program was what brought everything together,” Holder says.
It was a data-driven solution and a much-needed win for Holder, Pupo, and the Columbia team after months of experimentation. But instead of treating the breakthrough like a finish line, Holder says, they turned it into a stepping-stone.
“Koji kind of egged us on, him and I both, and brought the challenge and said, ‘Let’s make it better. Let’s think of a better way.’”
Striving for the Next Level of Location Intelligence
Pupo kept returning to the program’s original objective—to give suppliers more visibility into an ad’s reach. Yes, calculating ad impressions was a breakthrough—a welcome improvement on industry-standard practice. But Pupo wanted to give suppliers a deeper level of visibility.
“As lines are blurring within our industry and people are becoming more adventurous around what type of beverages they drink, it’s making it very difficult to understand where the consumer is going,” Pupo says. “So there’s always a need to be more dangerous with analytics . . . to understand where the consumer is and where the consumer is going.”
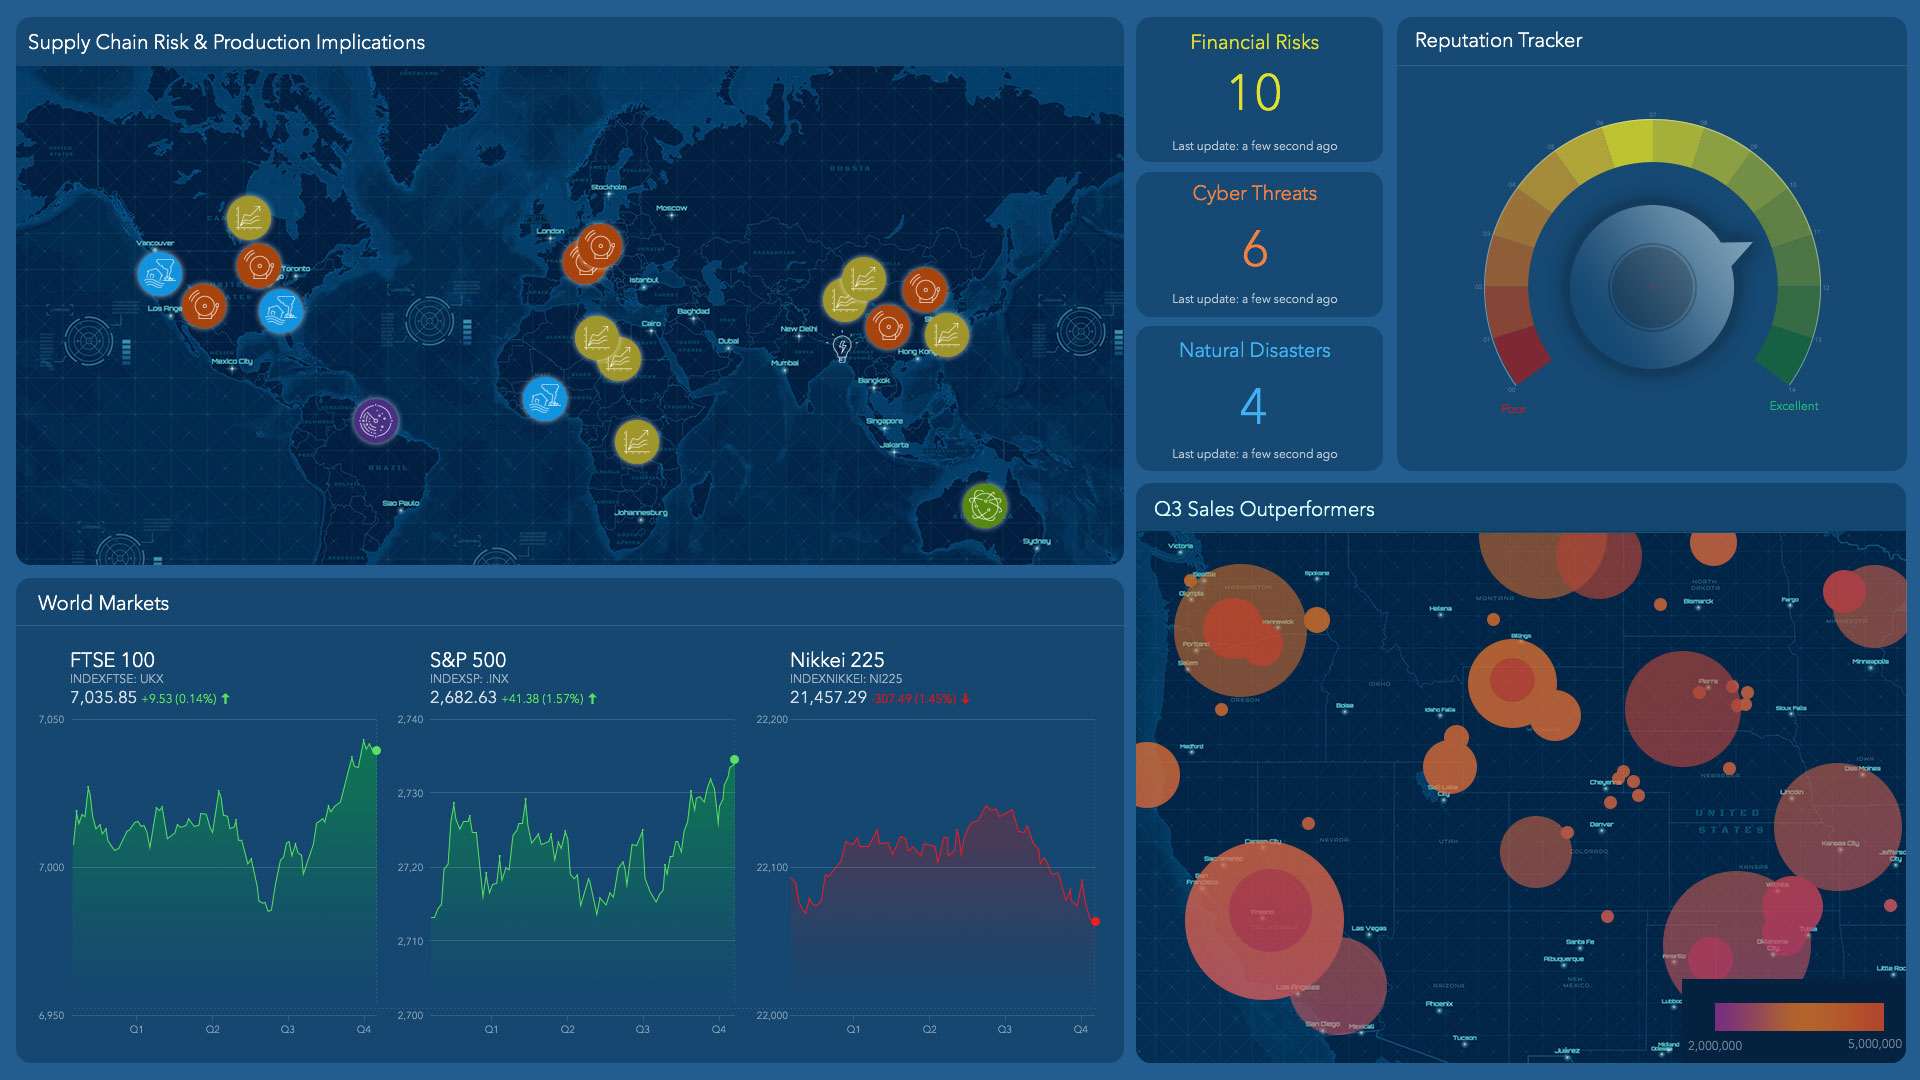
Leading executives in other industries have had the same thought, say the industry experts at Deloitte. In a recent article, Deloitte called geospatial analytics an important source of innovation and a means of solving business challenges in talent acquisition, operations, risk, and marketing.

Pupo and the Columbia team again turned to the GIS experts, who explained that the anonymous human movement data behind ad impressions could also reveal a surprising amount of demographic and psychographic data.
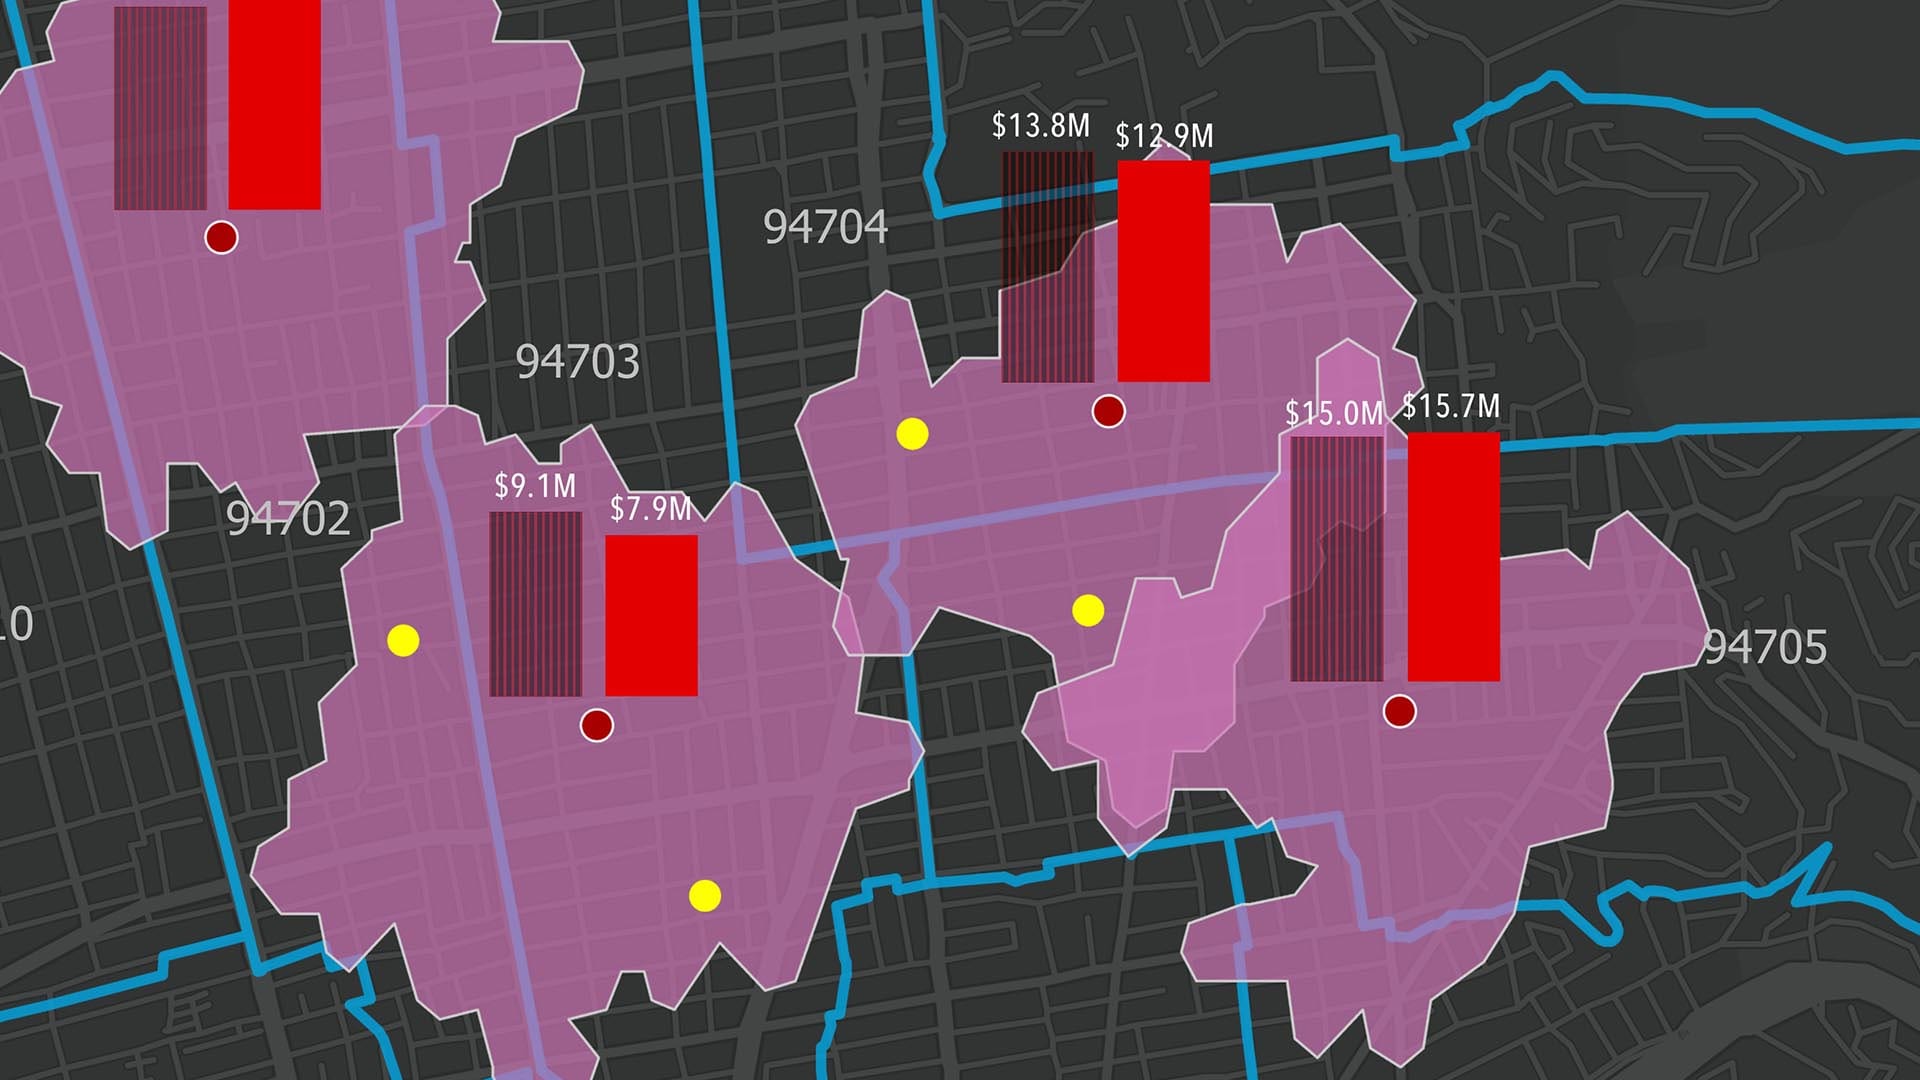
Before long, Holder and the data analysts were using a business-centric GIS program to create snapshots of consumers along each of Columbia’s routes. The infographics (see image) revealed how many impressions each ad received, along with information on who those consumers were. How many were women? What was their average disposable income? How often did they buy alcoholic beverages—and how was that likely to change in five years (see sidebar)?
With that GIS data, Columbia executives have become consultants to beverage manufacturers, bringing more visibility and versatility to their advertising programs.
“As we [get] information around what the demographics are for specific routes, we can then educate that supplier to what brand out of their portfolio might make sense,” Pupo says. Manufacturers can match the beverage they’re advertising to a route with high numbers of their target consumer.

Pupo quickly saw what other business executives have begun to realize—that a geographic approach to customer analysis—guided by GIS—can propel innovative new products and services.
Innovation Changes the Conversation with Customers
Since Columbia’s executives began selling the new program in summer 2021, conversations with suppliers have changed dramatically. “It’s completely a 180,” Pupo says. “I think suppliers are blown away, not only by the way that we’re able to quantify the numbers, but how we’re able to dive deeper . . . and understand that demographic and who that consumer is.”
The reaction was so strong that by October, nearly all of Columbia’s routes were sold out.
Given the popularity of the innovative program, it might be easy to forget what it took to begin the journey. Holder says the wild ideas and dead ends that marked the journey were all part of the innovation process.
“Luckily because we went down that rabbit hole,” he says, “we were able to find the power of GIS and use it for the program.”
The Esri Brief
Trending insights from WhereNext and other leading publicationsTrending articles

December 5, 2024 |

June 23, 2026 |

March 3, 2026 |

April 7, 2026 |

March 17, 2026 |

June 2, 2026 |