ArcGIS StoryMaps

Get (Re)Acquainted with Smart Mapping in Map Viewer

The new Map Viewer in ArcGIS Online and ArcGIS Enterprise is the next generation map-making tool that provides new ways to visualize data and build compelling web maps. We have expanded and improved smart mapping in Map Viewer to help you explore your data, try out drawing styles that showcase important patterns in your data, and create useful, attractive maps like never before.

This collection shows you how to take full advantage of the new mapping and visualization power of the Map Viewer in ArcGIS Online and ArcGIS Enterprise.

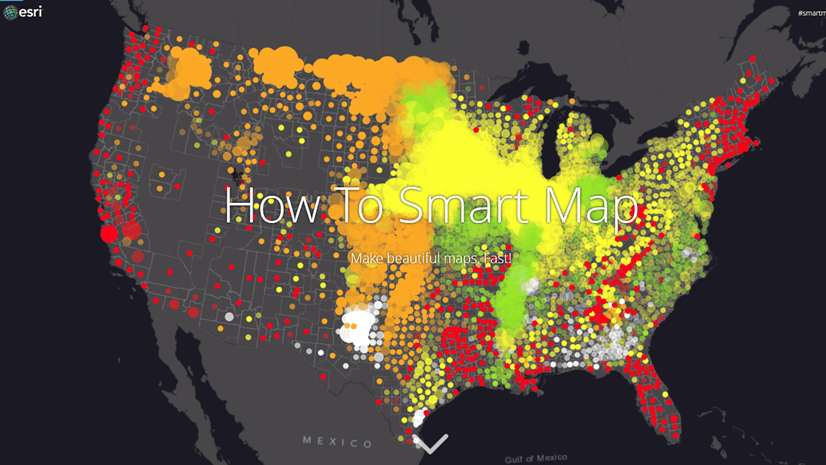
Smart mapping connects advanced mapping technology with streamlined workflows to help you create beautiful and informative maps, quickly. By using data-driven defaults and cartographic best practices, along with innovative ways of depicting your data, smart mapping helps uncover the stories inside your data.

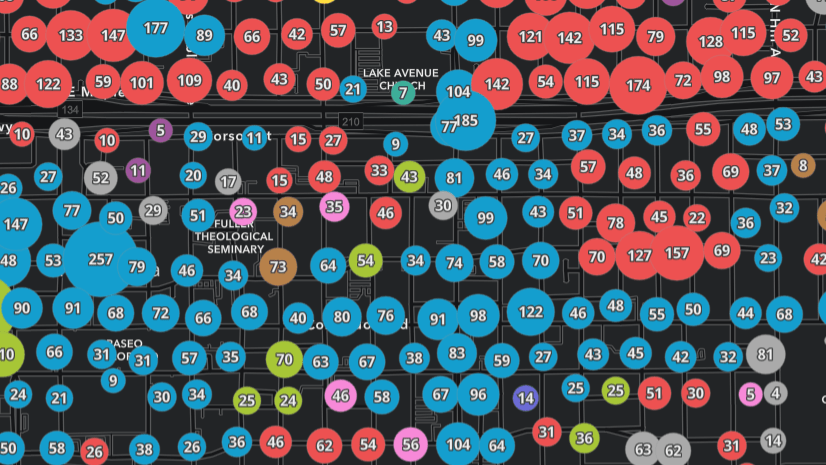
This collection of stories shows how smart mapping does the heavy lifting by taking the guesswork out of setting your map properties, so you can freely explore new patterns and stories you did not know were present in the data.


You can also access the individual story map tutorials here:

Smart Mapping: Introduction

Smart Mapping: Get Started

Smart Mapping: Single Symbol

Smart Mapping: Types

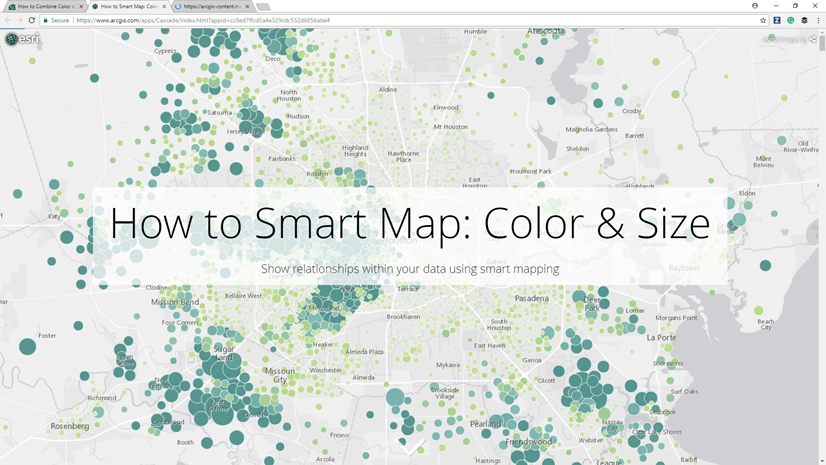
Smart Mapping: Counts & Amounts (size)

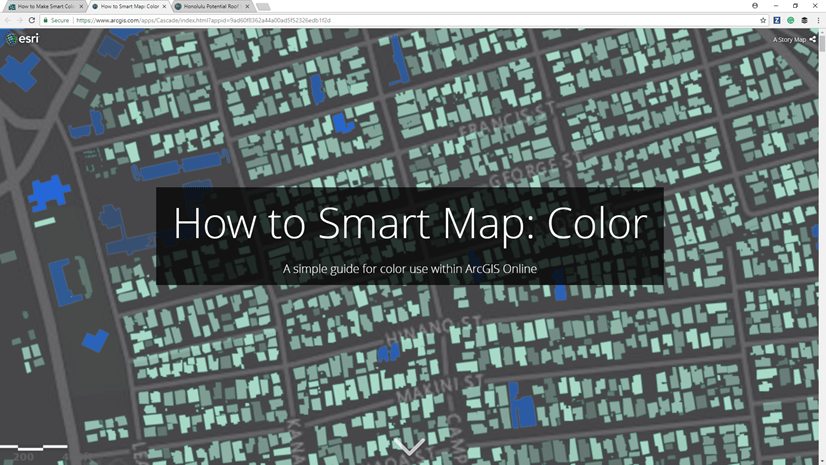
Smart Mapping: Counts & Amounts (color)

Smart Mapping: Color and Size

Smart Mapping: Compare A to B

Smart Mapping: Predominance

Smart Mapping: Relationships

Smart Mapping: Clustering

Smart Mapping: Heat Map

Smart Mapping: Continuous timeline and Age

Smart Mapping: Dot Density

Try it out today, and when ready share your maps with the hashtag #smartmapping and #ArcGISOnline.

About the authors

Steven is a Product Engineer on ArcGIS Living Atlas of the World's Policy Maps team. He is interested in transportation, housing, and demography. Steven enjoys a good chicken wing or 12.

Jim Herries is a geographer with Esri in Redlands, California. He serves as Senior Principal Product Engineer and Product Engineering Lead, Cartography on the team responsible for ArcGIS Living Atlas of the World. Jim works with teams on thematic mapping and map visualizations, reflecting a drive to help GIS users bring their data to life on the map and stimulate insights. He constantly looks for ways to create clear, focused map information products that incorporate meaningful spatial analysis and evocative visualizations. When he started in GIS at Ohio State, he walked over to the campus library to transcribe census data by hand to paper so that he could hand-enter it into spreadsheets for upload into Arc/INFO for mapping and analysis. Today, he appreciates how web GIS brings everyone access to good data in useful layers and maps as a starting point for great work.

Connect:
0 Comments
Inline Feedbacks
View all comments

Next Article

Indoor GIS: Easy Indoor Map Creation Webinar Q&A

Read this article