All nonprofits need to communicate their cause, understand their community, act on their mission, and measure their impact. Many of the challenges that nonprofits tackle – such as climate change, social and environmental justice issues, food insecurity, and economic advancement – are inherently spatial, which will benefit from problem solving with a geographic approach. The places and communities in which nonprofits operate are changing over time due to economic, environmental, and social changes. What’s needed are a set of ready-to-use apps, maps and data that elevate your organization’s geographic understanding.
Small nonprofit organizations based in the United States can apply for a grant from Esri that provides GIS software, data, and training. This grant is for small U.S.-based nonprofits with 25 or fewer employees who are not currently using ArcGIS software. This grant bundle gives up to five people in your organization access to various GIS tools and capabilities. Because it will go to organizations who are new to ArcGIS, the program also comes with training and resources. Esri will give special consideration to nonprofits that partner with GIS professionals in government, business, and academia who can serve as a GIS mentor.
Organizations focused on anything from conservation, to arts & culture, to youth & education can benefit from a geographic approach that GIS software facilitates. Some case studies include:
- Donate Life California, by using maps to educate potential organ donors, helping them to communicate their cause.
- San Jose Mothers Milk Bank, by using Business Analyst to apply same process that corporations and stores do to understand their community.
- The Surfrider Foundation, by using Survey123 and QuickCapture which allowed volunteers at beach cleanups to submit photos along with their locations, helping them act on their mission and measure their impact.
What’s included in this grant?
We have designed a special grant package that includes software, data, and training.
Software
The specific software included is:
- ArcGIS Online, which allows you to create and share web-based interactive maps. This also includes essential apps such as ArcGIS StoryMaps, ArcGIS Hub, ArcGIS Survey123, ArcGIS Dashboards, and ArcGIS Instant Apps, to help make your interactive web maps easy to present and share.
- ArcGIS Pro, which is a robust desktop GIS supporting advanced data visualization and analysis. Use scientific analytical tools to identify patterns, make predictions, and answer questions.
- ArcGIS Business Analyst, which is the premier tool for site-selection, customer segmentation, territory design, and more. Combine proprietary data on locations and property costs with data about prospective customers, clients, or patients, then share your analysis as customizable infographics.
Data
The data included is the ever-growing collection of curated data layers, maps, and apps available in ArcGIS Living Atlas of the World. Living Atlas is the foremost collection of geographic information from around the globe. Rather than starting from scratch, stand on the shoulders of giants and start from existing maps!
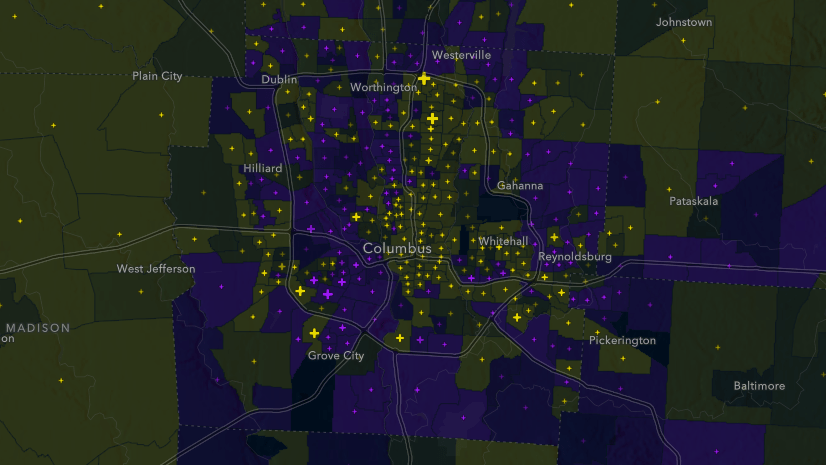
You can use these to include these for reports and presentations to communicate your cause. Explore the maps to understand your community. Many of these interactive web maps are multi-scale, which means you get more geographic detail when you zoom in. You also can learn more about each area by clicking on the map and seeing the pop-ups. These present further detail and context, rewarding those who interact with the map.
Since this grant program is for U.S.-based nonprofits, here are just some of the many maps that may pique your interest:
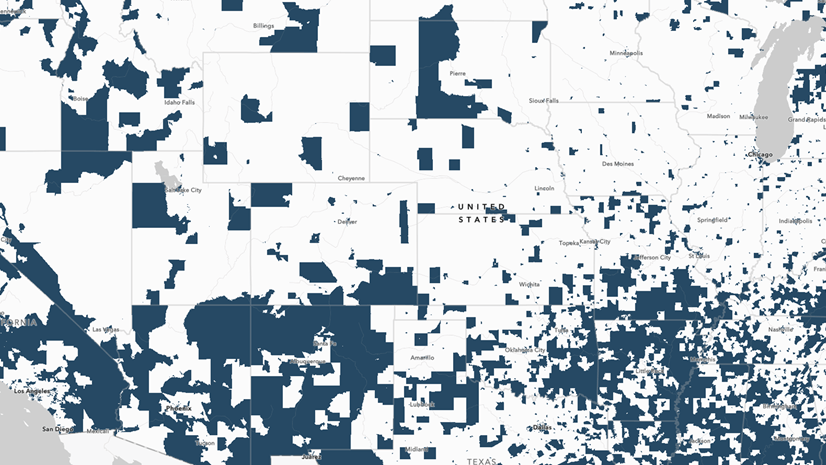
- Maps of the 2020 Decennial Census on topics of race/ethnicity, group quarters populations, and vacant housing.

- Maps of dozens of health conditions from CDC PLACES, such as high cholesterol, depression, and current smoking.

- Maps of Justice40 data on communities that have been identified as disadvantaged across several categories by the Council on Environmental Quality.

- Maps of the most recent American Community Survey data on social, economic, demographic, and housing topics. Focused apps on veterans, the digital divide, and many other topics are also available.
, Children's Living Arrangements, Predominant Health Insurance Coverage for Children, Prevalence of Children with a Disability.")
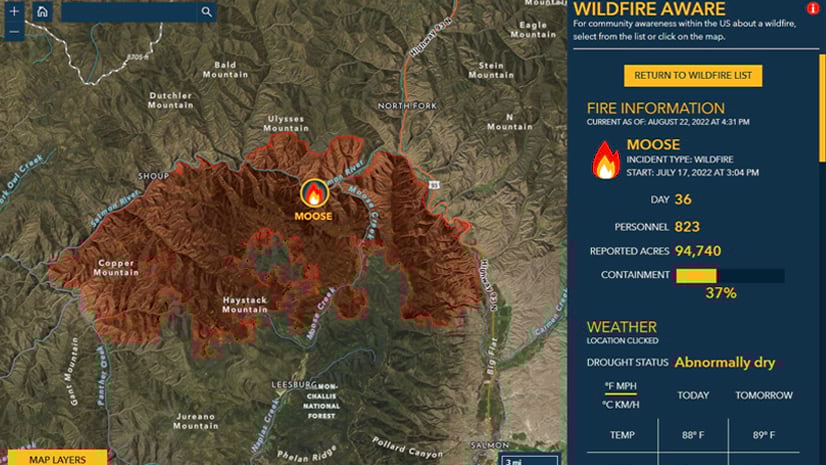
- Real-time apps such as Hurricane Aware, Air Quality Aware, and Wildfire Aware, which provide real-time information on those impacted.

- Map of historical redlining grades for neighborhoods in 143 U.S. cities, which can help us understand how historical inequities still contribute to inequities today.
These maps and many more are available for you to use in your story maps, dashboards, and instant apps.
Modify these, or create your own web maps to act on your mission and measure your impact
To start, browse Living Atlas by searching for topics important to your organization. Once you find a web map you’re interested in, open it in Map Viewer and sign in. These maps have nation-wide coverage, but you can easily filter them to emphasize your local area. Take advantage of all the attributes in the layers in the web map, along with ArcGIS Online’s dozens of basemaps, numerous smart mapping styles, pop-up configuration options, labeling, blending, layer effects, and more. Modify it to your liking, then click Save As to store it in your content.
Once you have your map, take a few extra minutes to put that map in an app for a focused, interactive viewer experience. Use ArcGIS Instant Apps such as Media Map, Countdown, or Chart Viewer. Or use ArcGIS StoryMaps to combine your map with narrative text and multimedia to make a compelling story-based presentation. To go even further, combine these maps with your own data and perform analysis for further insights.
Training
This grant comes with uncapped e-learning with self-paced courses. Learn ArcGIS is a hub of over 300 scenario-based guided lessons and tutorials allowing you to get hands-on practice with the software.
Access community support through resources websites and current forums. Connect, collaborate, and share experiences with GIS users across the globe with Esri Community.
Participation in Esri’s Nonprofit Program also comes with discounts on instructor-led or private classes.
Call to Action
While solving our most pressing problems will not be easy, ArcGIS contains multitudes of tools to make your spatial analysis and mapping/visualization easy. Esri is investing $1M in this grant initiative, which will provide software and training to the first 150 nonprofit organizations that meet the requirements of an eligible 501(c)(3) public charity.
If you are a GIS professional, consider serving as a GIS mentor for your favorite small nonprofit organization.
If you are a U.S.-based nonprofit organization with 25 or fewer employees not currently using GIS software, apply today to become part of a global community of nonprofit organizations that are using GIS to create a more just, healthy, and prosperous world where everyone can thrive.


Article Discussion: