In Part 1 of this blog series, we learned about the importance of using Margins of Error (MOEs) within our mapping projects. Since surveyed data such as the American Community Survey (ACS) will contain some sort of sampling and nonsampling errors, especially at smaller geographies like block groups and tracts, it is our job as map creators to communicate margins of error when they are necessary.
The U.S. Census Bureau has done us all a huge favor by offering margins of error (MOE) for their data estimates, and one method of showcasing MOEs is through the map’s pop-up. Pop-ups allow the map audience to dive deeper into a map’s topic to see a detailed breakdown of the data.
This blog provides various techniques and suggestions for how to create effective pop-ups about ACS estimates and MOEs. You can use these techniques together or on their own. There’s not one correct way to communicate MOEs, so it is up to you as the map maker to assess what information is important to convey.
Build a strong pop-up
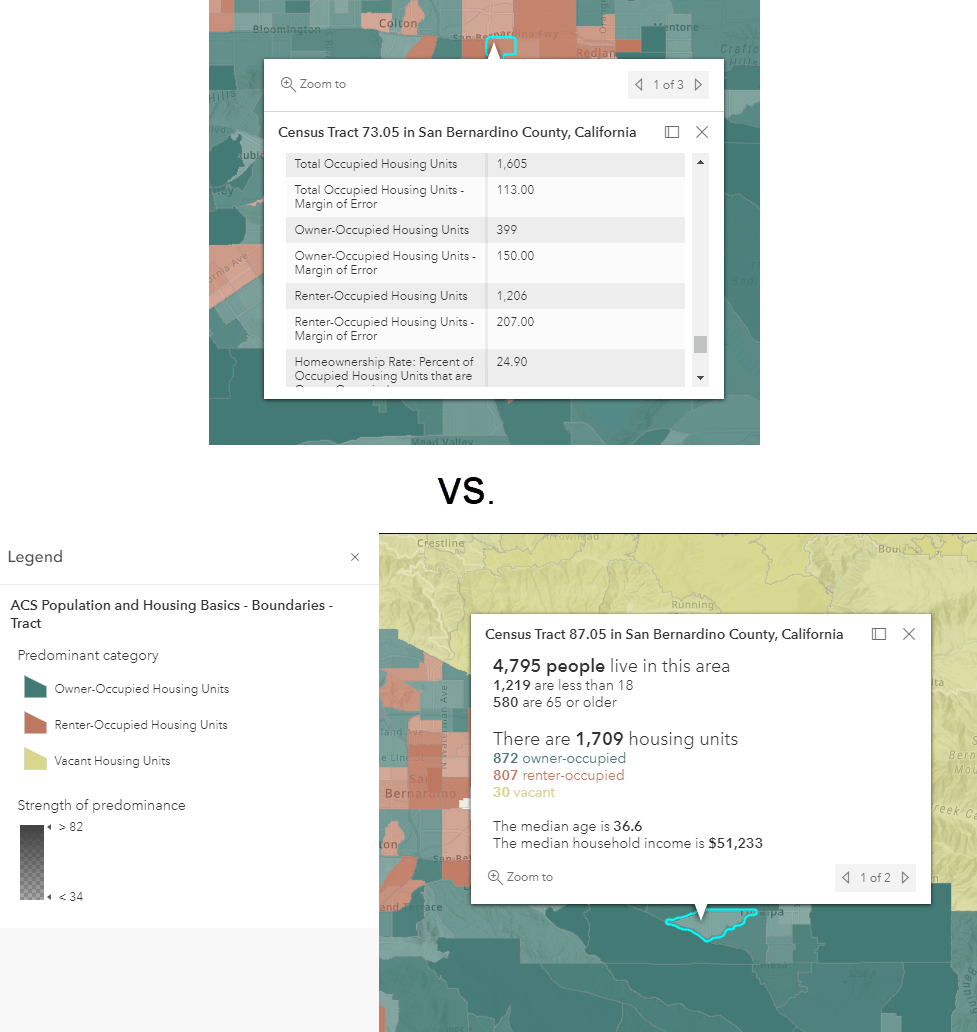
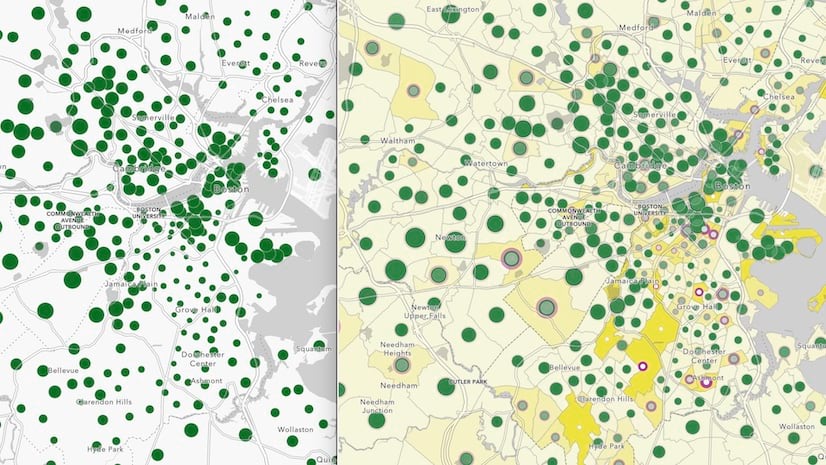
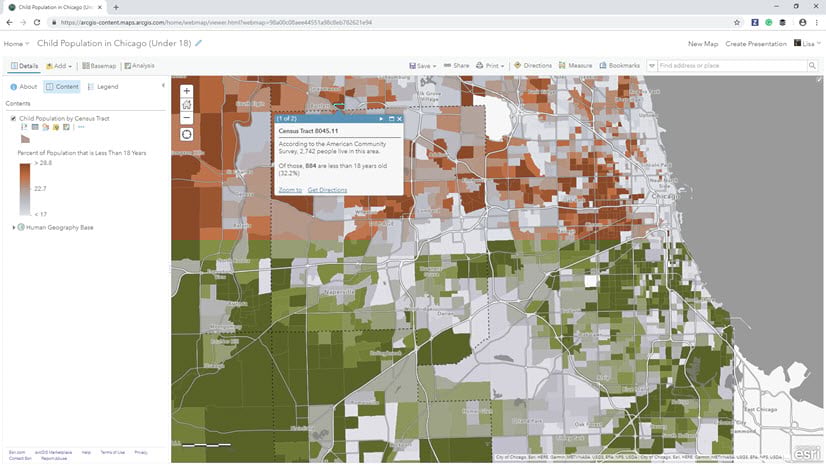
Before we even add an MOE to our pop-up, let’s talk about effective pop-ups in general. We often see pop-ups with a list of attributes, leaving the map reader to decipher what is important. The easiest way to create an effective pop-up is to turn a table of data into something digestible by using easy-to-read statements with a custom pop-up. If you are unfamiliar with web map pop-ups, this blog talks through the essentials, and this blog introduces custom pop-up displays (which are used throughout this blog).
For example, the pop-up on the top requires our map reader to scroll through a long list of attributes, while the one on the bottom includes the information important to the map. This example even matches the colors from the map to the attributes in the pop-up.
Some tips when creating pop-ups about ACS and MOEs:
- Think about which attributes you need to help your map tell an informative and concise story. Don’t make your map reader do all the work by including every single attribute from a table.
- Include the “base” (AKA the denominator) somewhere in your pop-up. If you’re mapping the percent of population age 25+ without insurance, include the total count of population 25+ somewhere in your pop-up.
- Not every attribute will necessarily need the MOE included. Think about how your audience plans to use the map and if the MOE is important to them.
Once you know the key information you want to communicate to your map audience, let’s look at some simple ways to create impactful ACS pop-ups with our estimates and MOEs.
Use your words
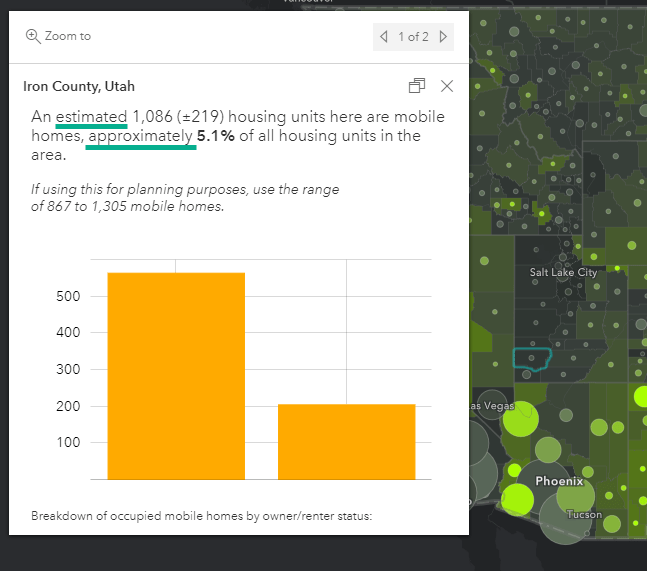
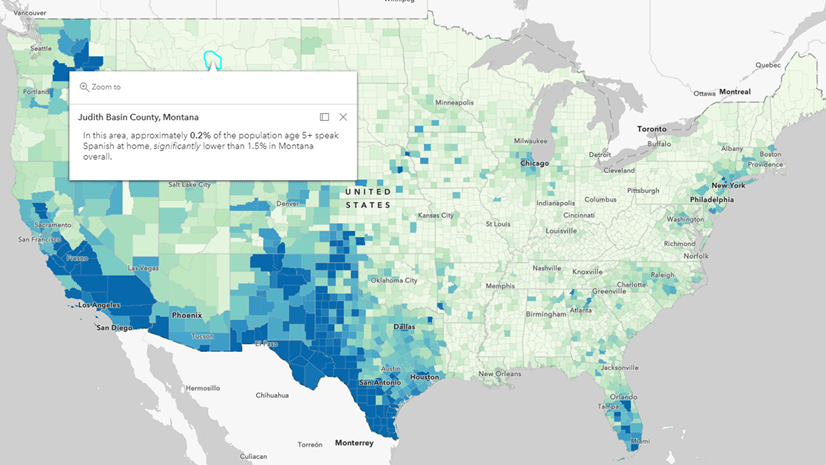
One way to communicate that ACS data contains sampling errors without causing alarm is to use words like “approximately” or “estimated” when talking about the estimate itself. Notice how the pop-up below uses these words to help communicate that the number is not exact, without drawing attention to the error itself.
Provide the MOE with the estimate
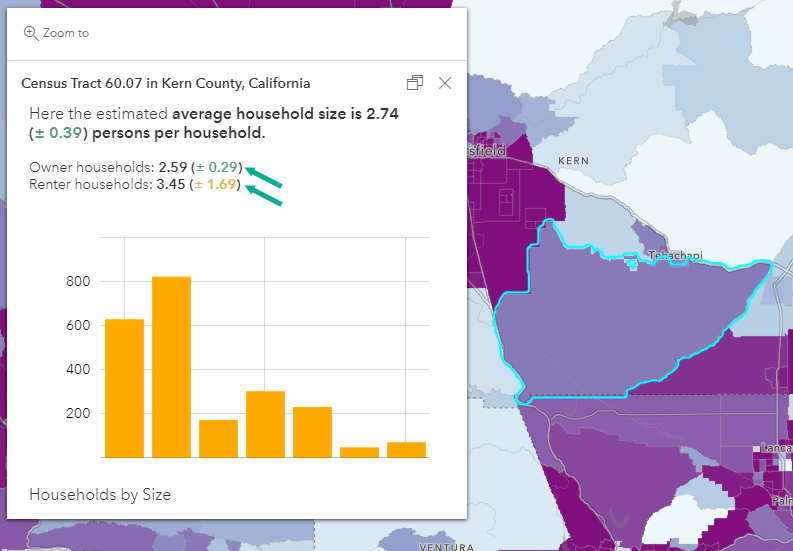
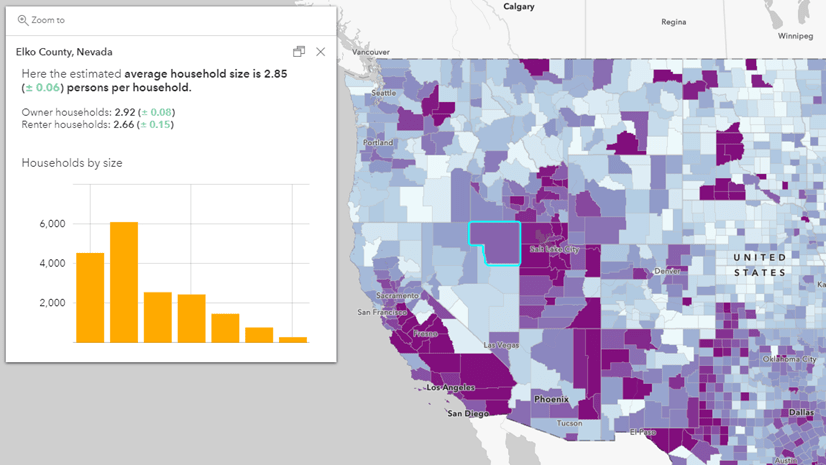
If you want to communicate the estimate alongside the MOE, consider using +/- or ±. This helps show that there is more than just the estimate to consider when using the data.
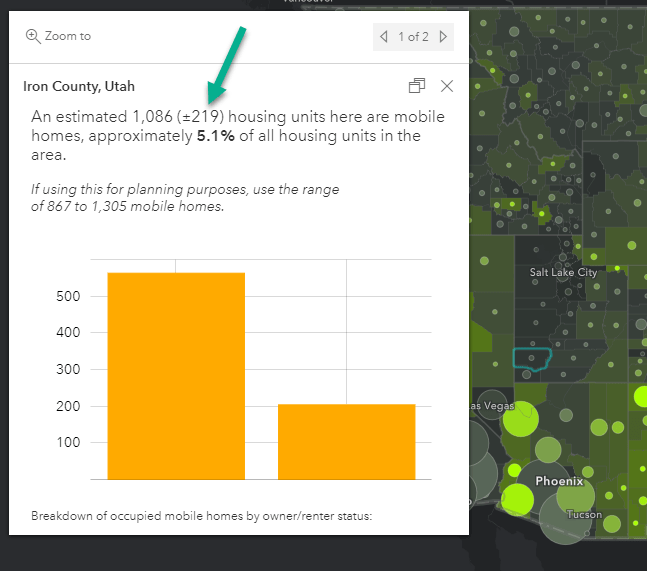
Notice how this pop-up also uses the language suggested from the previous section. This is an example of where more than one technique was used.
Provide context about ACS/MOEs
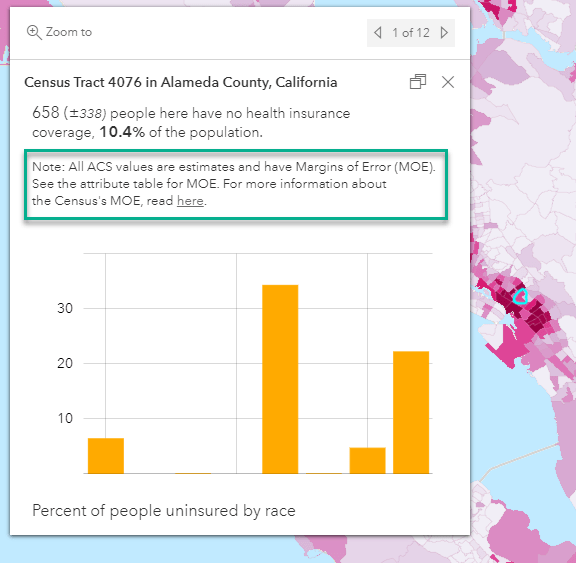
Some readers may want to learn more about the MOEs and what they are. One way to help them learn more is to include information about MOEs directly within the pop-up itself. The pop-up below links to this document about understanding error from the ACS Handbook. This technique allows the reader to explore MOEs further if they choose.
Next, let’s explore some of the more advanced ways to include MOEs. These will require some additional calculations, but luckily Arcade allows us to do this on-the-fly.
Provide the range (confidence interval)
As explained in this blog, the MOE tells us that there is a range of values in which the estimate could realistically fall. This range is known as the confidence interval.
.")
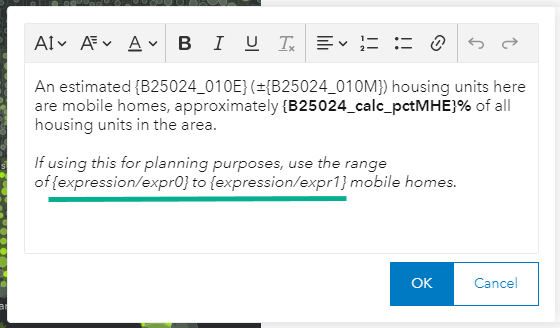
We can communicate this range of values within our pop-up in many ways without using the words “confidence interval.” The example below shows how the range can be used within a sentence in relation to the map’s topic.
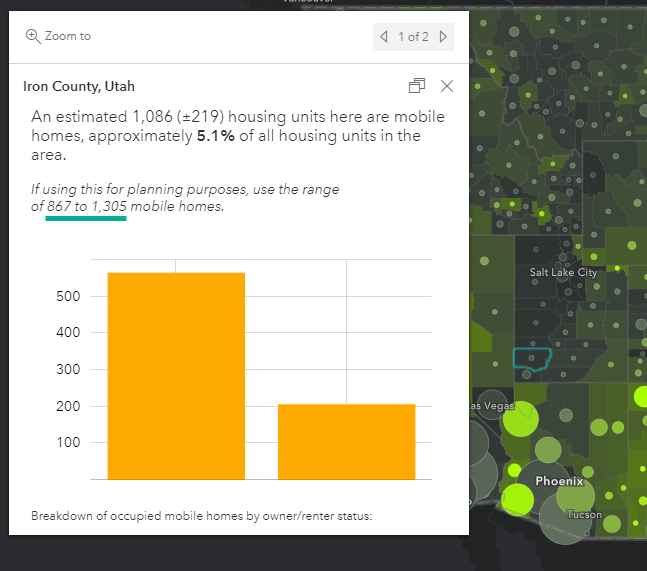
To create this range, we add and subtract the MOE to the estimate. Within the pop-up create a new expression for both the upper and lower bounds of the range. For the upper bound, simply add the MOE to the estimate.
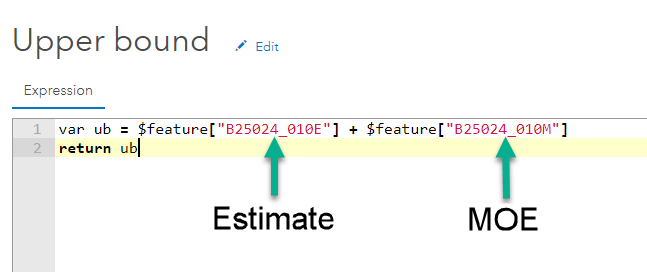
Note: The example below uses variables and a return statement, but you could also just put $feature[ESTIMATE_FIELDNAME] + $feature[MOE_FIELDNAME] and it would also return the upper bound.
Then, we can create another expression to represent the lower bound, which is the estimate minus the MOE. When creating the lower bound, there is a chance the MOE could be larger than the estimate, which could make the lower bound a negative number. To make sure we do not try to claim there are –31 mobile homes in an area, we can use the When() function to handle cases that are less than 0.
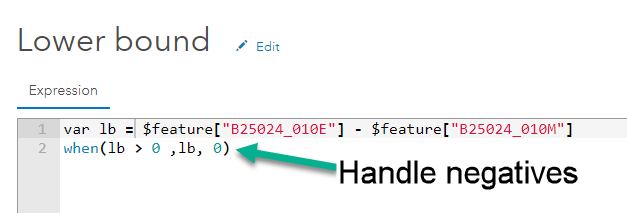
The second line of this expression says “when the lower bound is over 0, return the calculated lower bound. Otherwise (if the value is negative), return 0.”
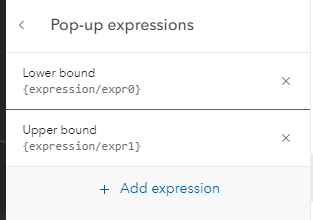
Now you will have two expressions, which you can use like any other attribute from your data.
Provide the reliability (coefficient of variation)
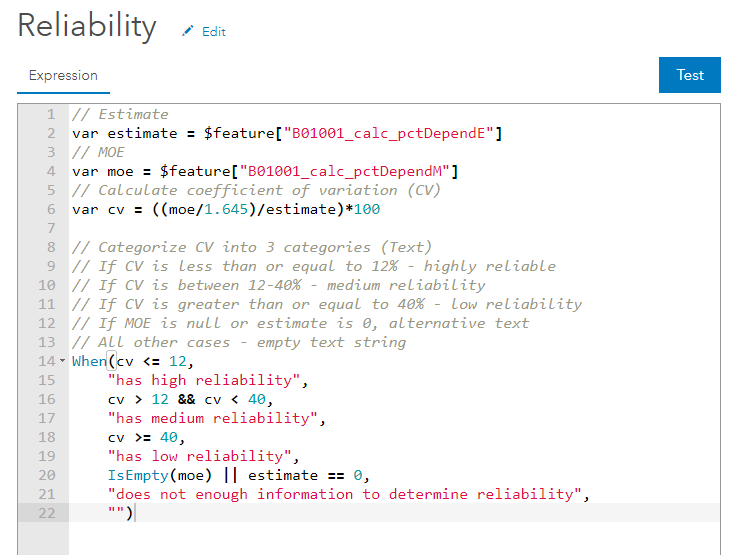
Another way to understand the reliability of an estimate and its MOE is to use the coefficient of variation. This essentially tells us the error as a percent of the estimate. Here’s an example which turns this reliability number into three levels of reliability: high reliability, medium reliability, and low reliability.
In this example, we use three categories, which are the the same thresholds for reliability as are used in Esri Business Analyst products. If the MOE is under 12% of the estimate, it is considered high reliability. If it is between 12 and 40% it is considered medium reliability, and anything over 40% is considered low reliability.
The equation below can be used to calculate the coefficient of variation at a 90% confidence level:

Note: To get a 95% confidence level, exchange 1.645 with 1.96.
Like we showed in the previous example, we can use Arcade to calculate new values on-the-fly for our pop-ups. First, you’ll calculate the coefficient of variation using the equation above. Then, you can use a When() statement like we did in the earlier example to turn the numbers into readable text.
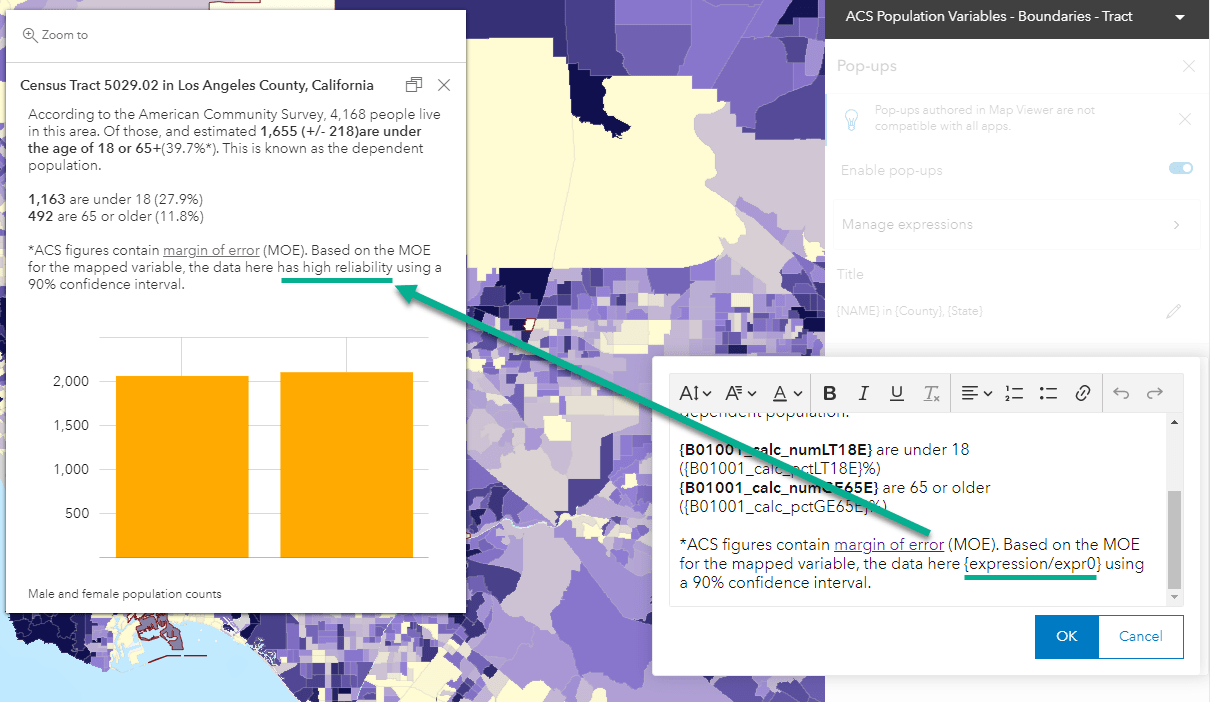
We can then use this expression like any other attribute within our pop-up to communicate the reliability of the data:
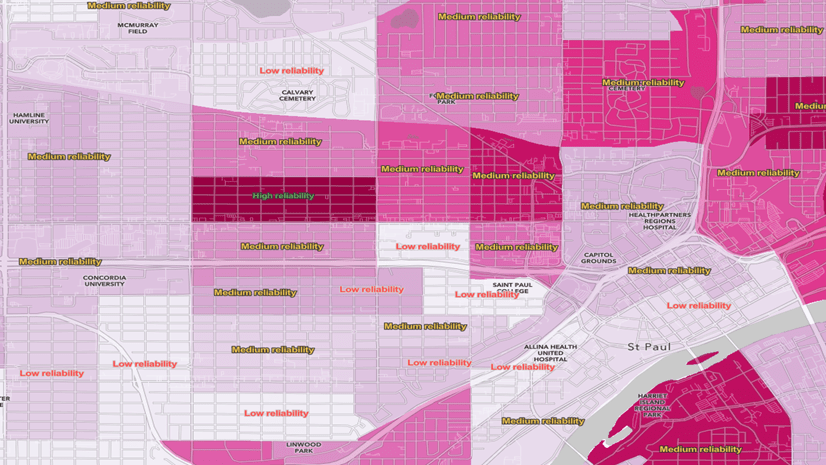
Reinforce reliability with color
Using the same equation as the previous example, we can define color to appear in our pop-ups to associate with the reliability. In the example below, the MOE is highlighted with red, green, or yellow to indicate high/medium/low reliability. Notice some of the other techniques we have seen throughout this blog.
In this Arcade statement, instead of words, the statement produces hex color values associated to each reliability category.
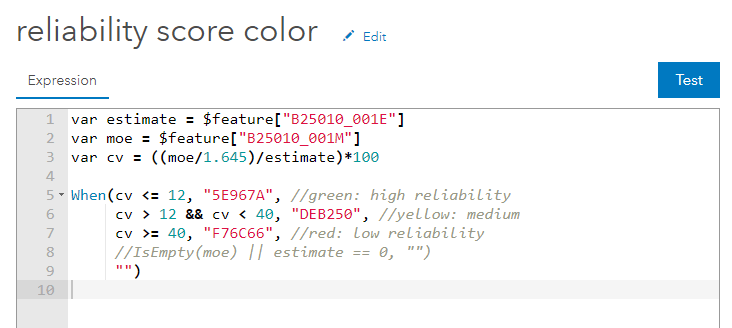
Within Map Viewer Classic, we can use this expression within the pop-up HTML to color the MOE. This blog goes into depth of how to insert the expression into your HTML.
Make it your own
This blog contains different methods for showcasing MOEs within the pop-ups in your maps. These methods can be used together, on their own, or in any combination that works for your map’s purpose. Not every map will need MOEs explicitly stated, while others will greatly benefit from the methods shown in this blog. Consider your map audience, their understanding of ACS data, and the way the map will be used by the end reader. These factors will help you decide which method (or methods) are most appropriate for your map.
Resources
Blog – The Census Bureau Gives You Margins of Error, We Help You Map Them
Blog – The Importance of Margins of Error and Mapping
2020 ACS handbook – Chapter 7. UNDERSTANDING ERROR AND DETERMINING STATISTICAL SIGNIFICANCE
Blog – Your Arcade Questions Answered
Web Map Examples:

Article Discussion: