The November 9, 2023, ArcGIS Enterprise 11.2 release brings exciting advancements to ArcGIS StoryMaps. Tell even more engaging stories with your data and maps, and new in beta is the ability to create slide-based presentations with briefings. Scroll down to learn more about the latest capabilities.

Briefings (beta)
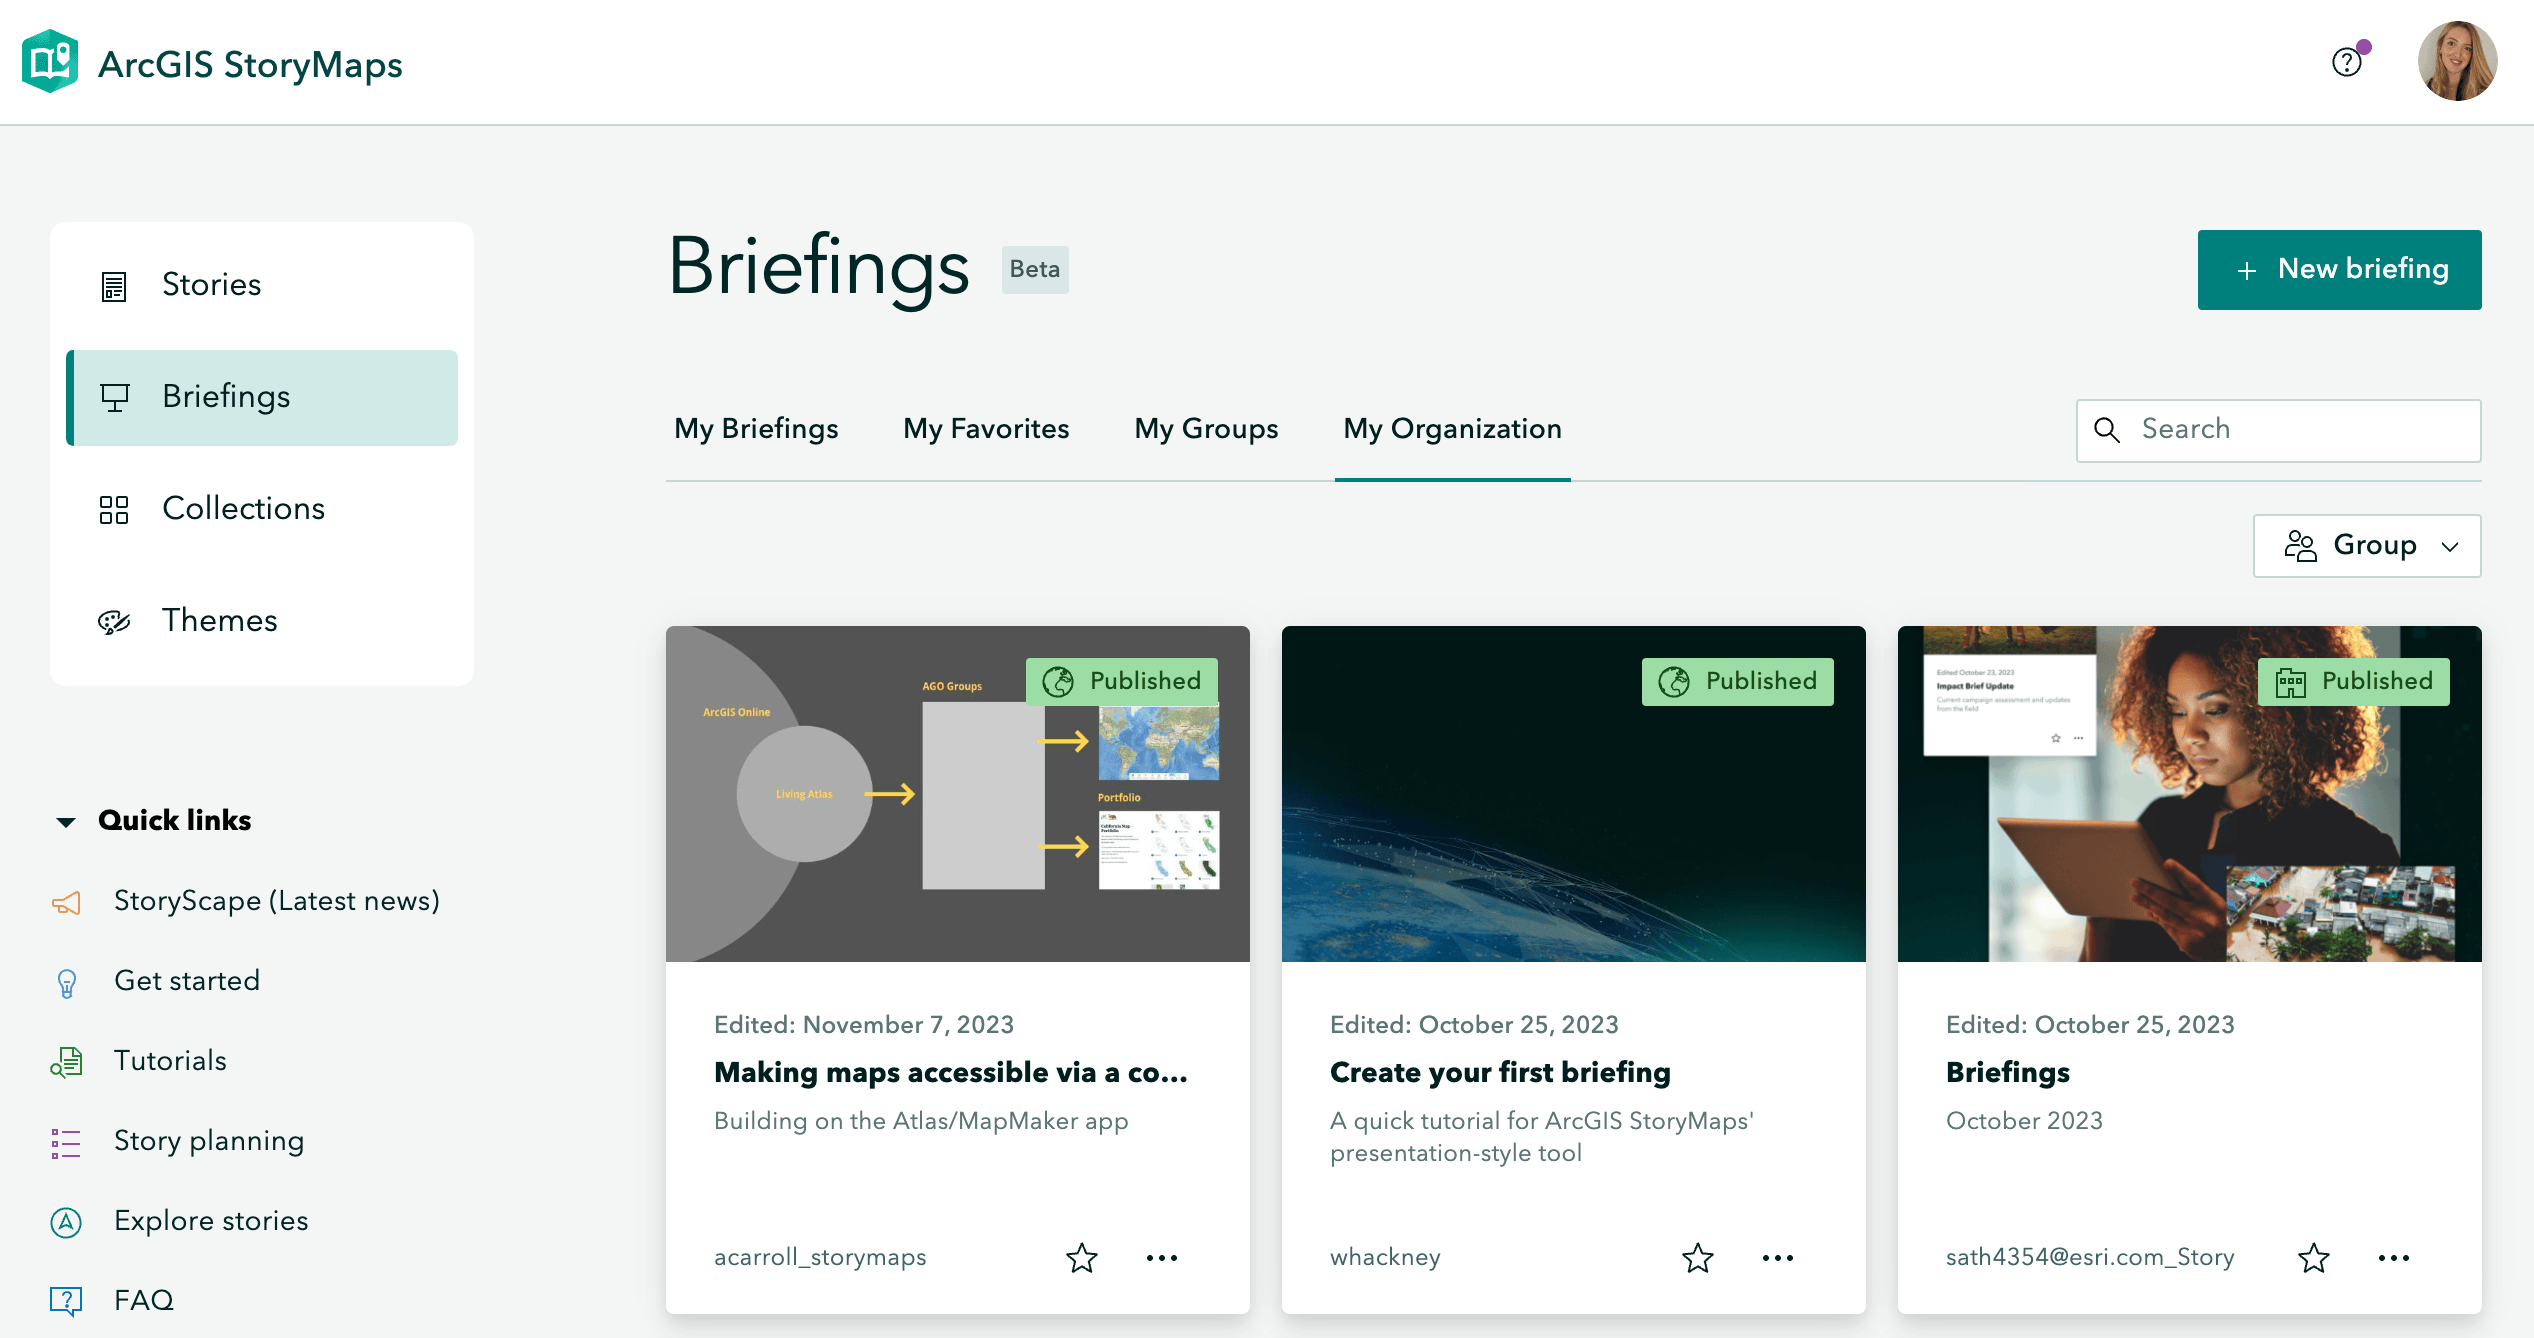
With the 11.2 release of ArcGIS Enterprise, you can now create briefings, a new slide-based output of ArcGIS StoryMaps! Briefings are perfect for sharing your GIS work since they support dynamic content, including interactive maps and data as well as external multimedia in a seamless presentation experience.
Please note that to access briefings on ArcGIS Enterprise 11.2, your organization’s administrator needs to enable beta features.
Video introducing briefings in ArcGIS StoryMaps.
Creating a briefing is easy and familiar, as the builder matches the same interface you’re used to when you create stories in ArcGIS StoryMaps. You can embed content, add text, images, videos, 2D and 3D maps, and you can use the swipe block to compare maps or images in your briefings. As we work to bring briefings out of beta, you’ll find that other familiar content types are added to briefings.
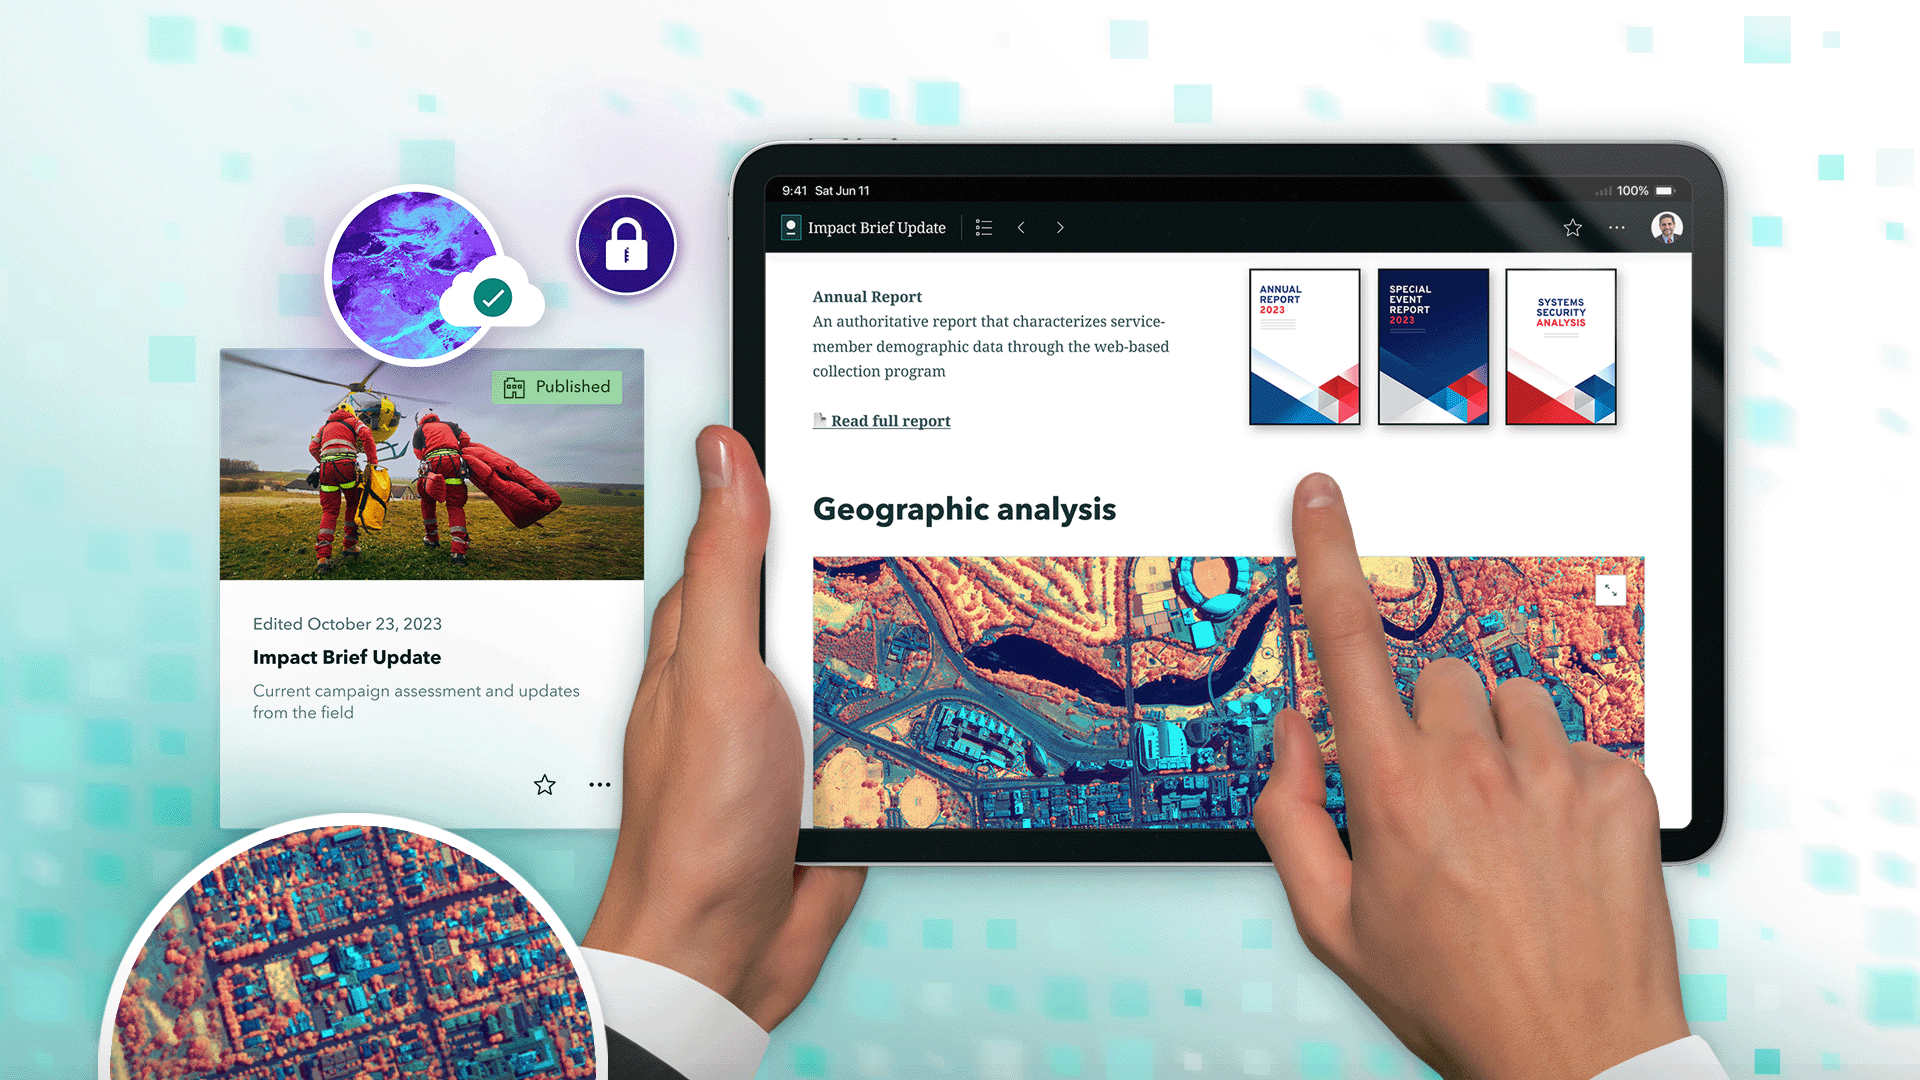
Access briefings anywhere, anytime, even offline
You can access your briefings on the go and even share presentations offline with the complementary briefings tablet app. Now available in beta for Android and iOS, the tablet app allows you to interact with the maps and data in your briefings to help you make data-driven decisions even if you’re offline. With unmatched portability and adaptability, the tablet app elevates how you view and consume briefings.
Resources for creating your first briefing
We encourage you to take briefings for a test drive and let us know what you think by sharing your feedback through the in-app feedback form or on Esri Community.
- Blog: Introducing Briefings: Elevate Your Presentations with ArcGIS StoryMaps
- Blog: When are briefings in ArcGIS StoryMaps the right tool for your content?
- Esri Community: Briefings (beta): Known Issues and What’s Coming
- Briefings tutorial …in the form of a briefing, of course!
- Blog: Introducing the Briefings Tablet App: Access Your ArcGIS StoryMaps Briefings Anytime, Anywhere!
- Blog: What’s New in the ArcGIS StoryMaps Briefings Tablet App (November 2023)

Storytelling
Undo and redo
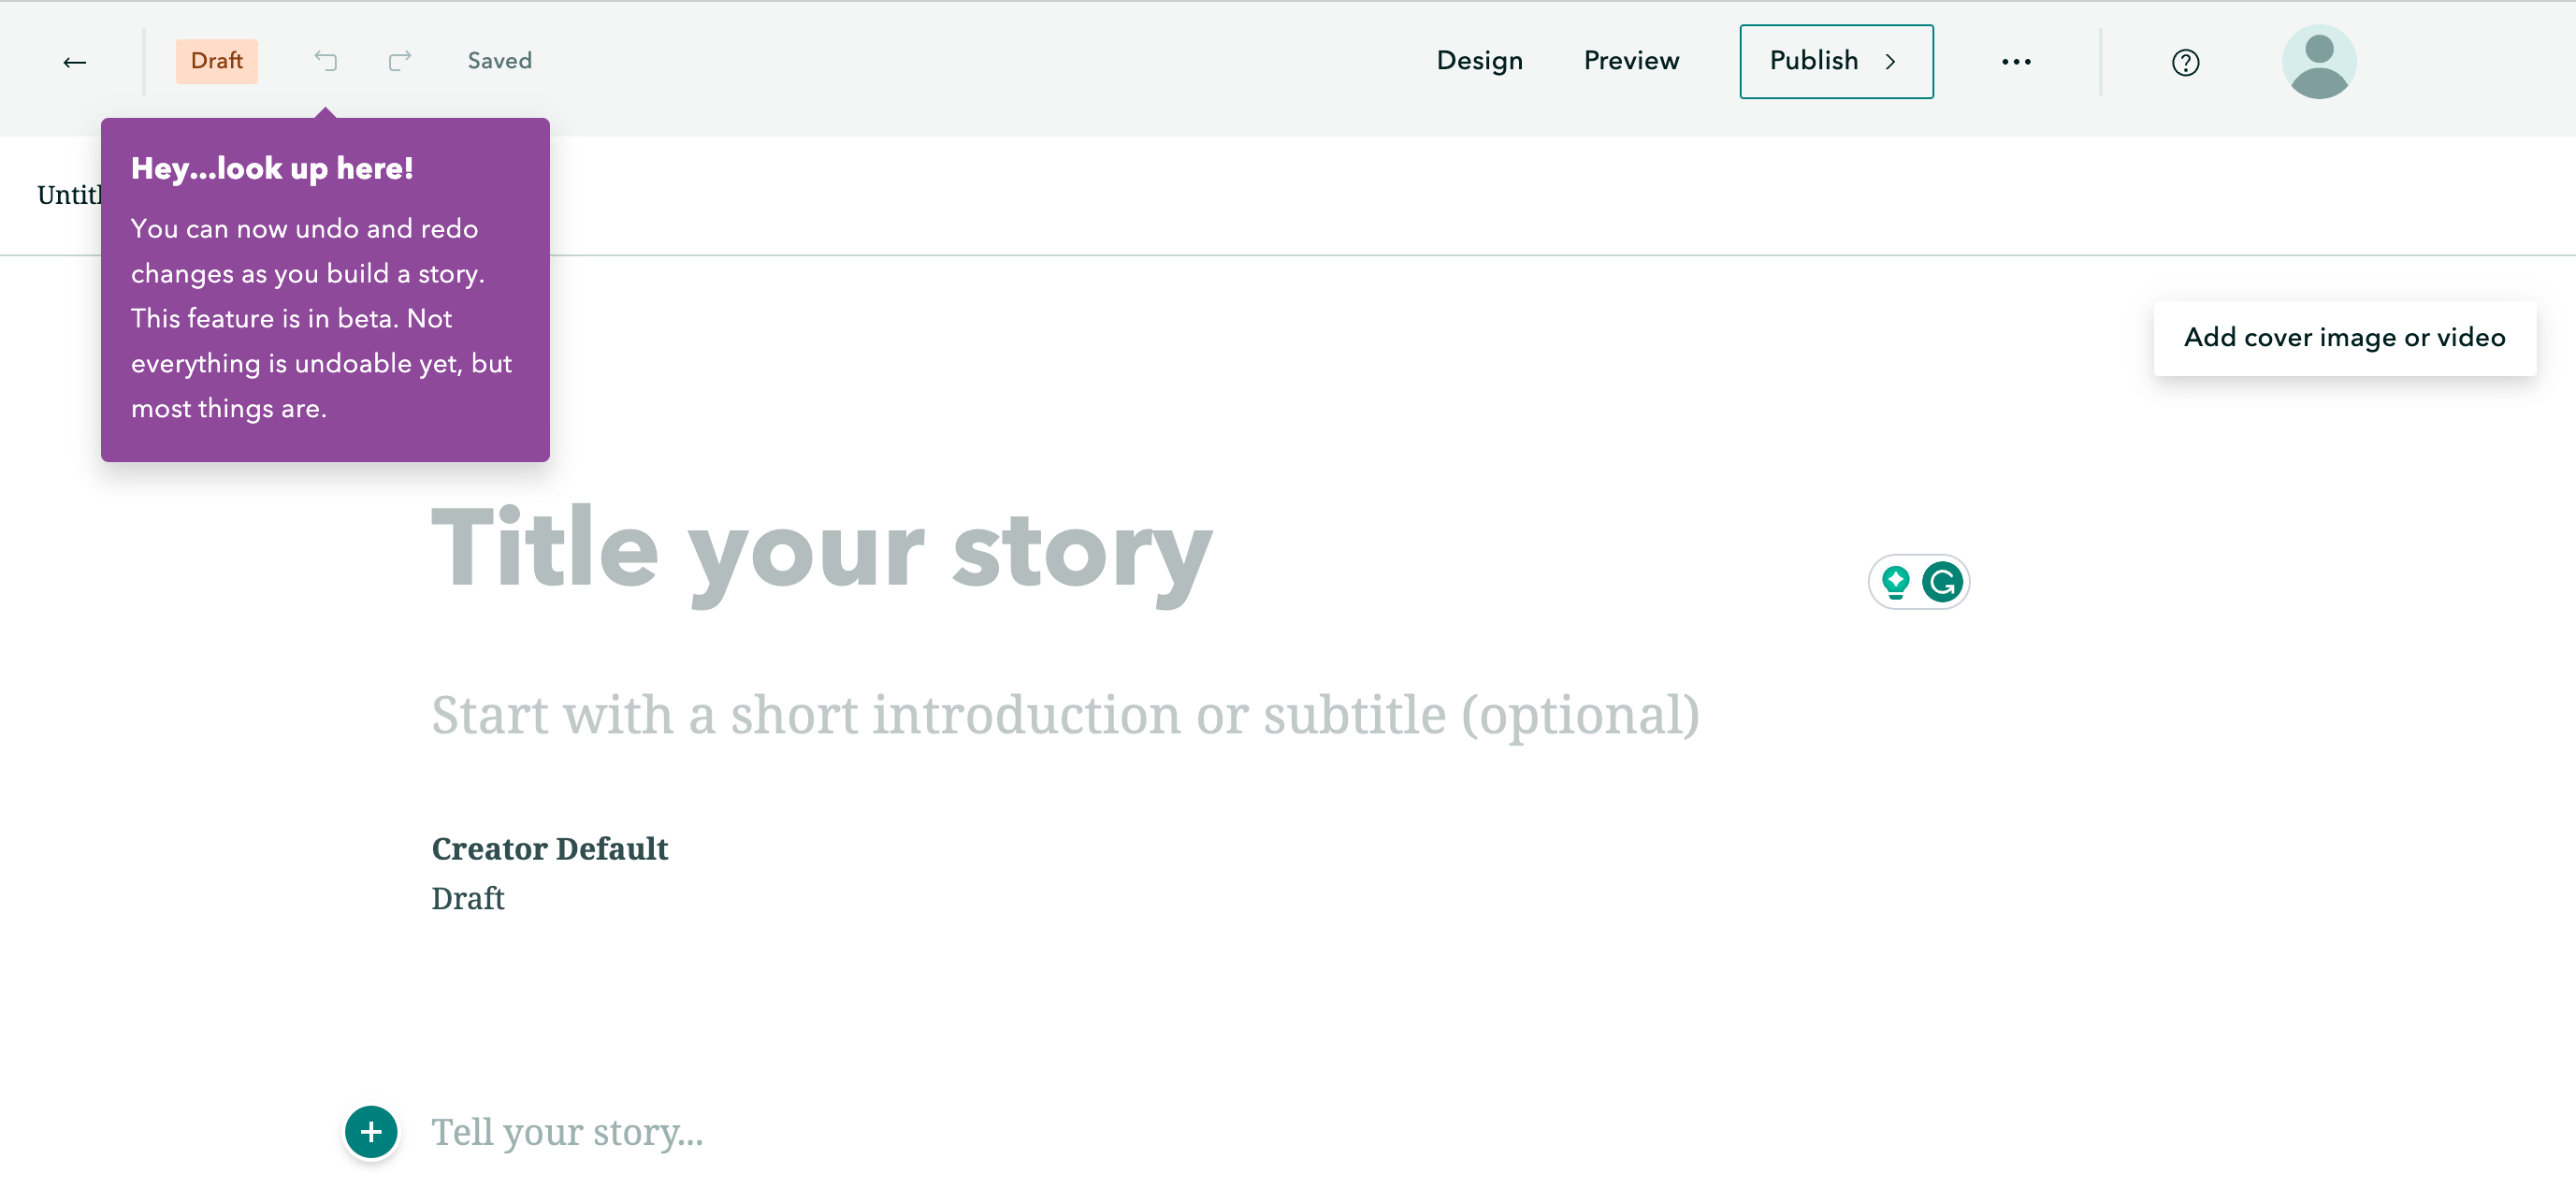
You can now undo and redo the changes you’ve made in the story builder. Having an undo capability was one of the most voted for ideas on the ArcGIS StoryMaps Ideas board, so we know many of you have been looking forward to this feature. It brings flexibility and peace of mind, especially when you accidentally delete something or want to take your story in a different direction. Most common actions, including adding, editing, and reordering text and media blocks and updating block sizes and options are supported.

Share code snippets
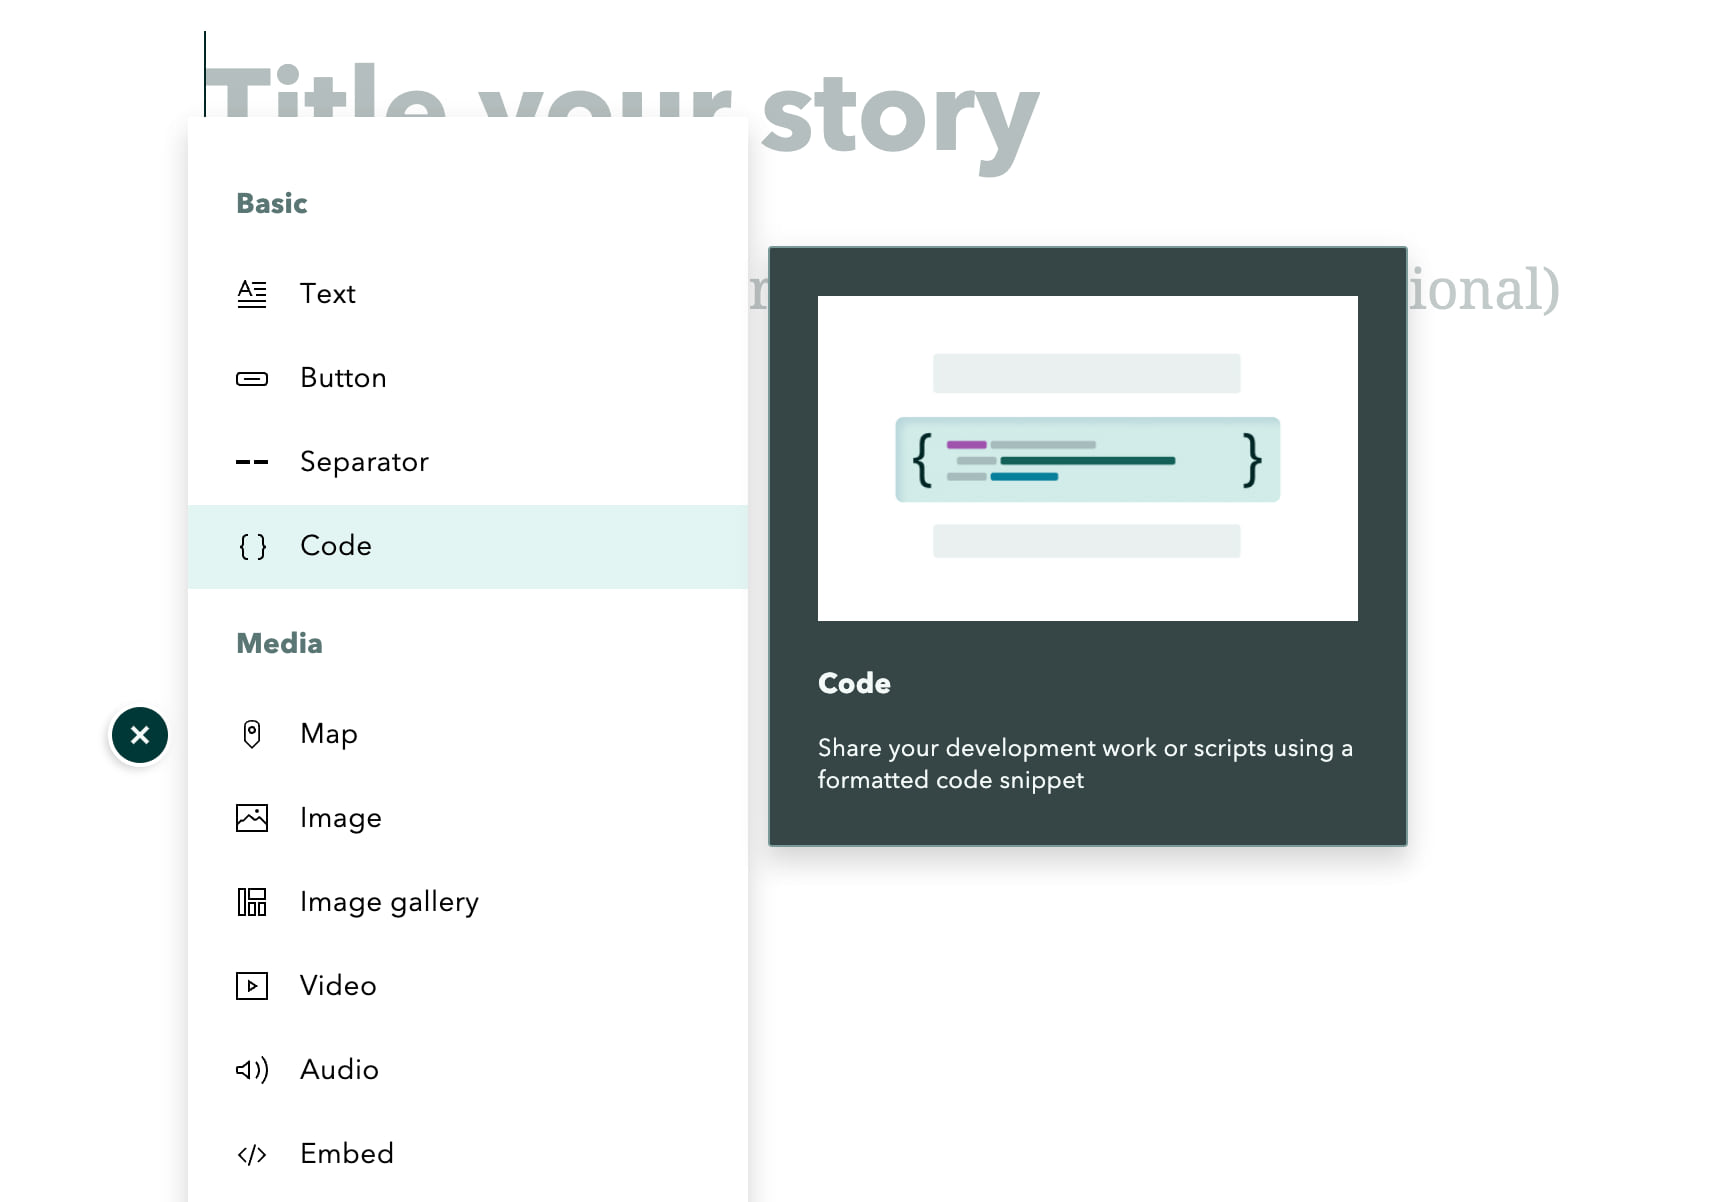
You can now share snippets of code with readers using the new code block in the block palette. The code block makes it easy to share scripts or expressions, including the ArcGIS Mapping SDK languages, Python, Arcade, and many other popular development languages. One feature that is unique to the code block is syntax highlighting, it allows you to make your code more readable and useful by coloring the syntax of your code, you can enable it by selecting the language of the code you’ve added in the code block options. Readers can easily copy the code you’ve shared using the copy button to pull the entire snippet into their clipboard.
Video showcasing how to use the code block to share your code snippets.

New text editing capabilities
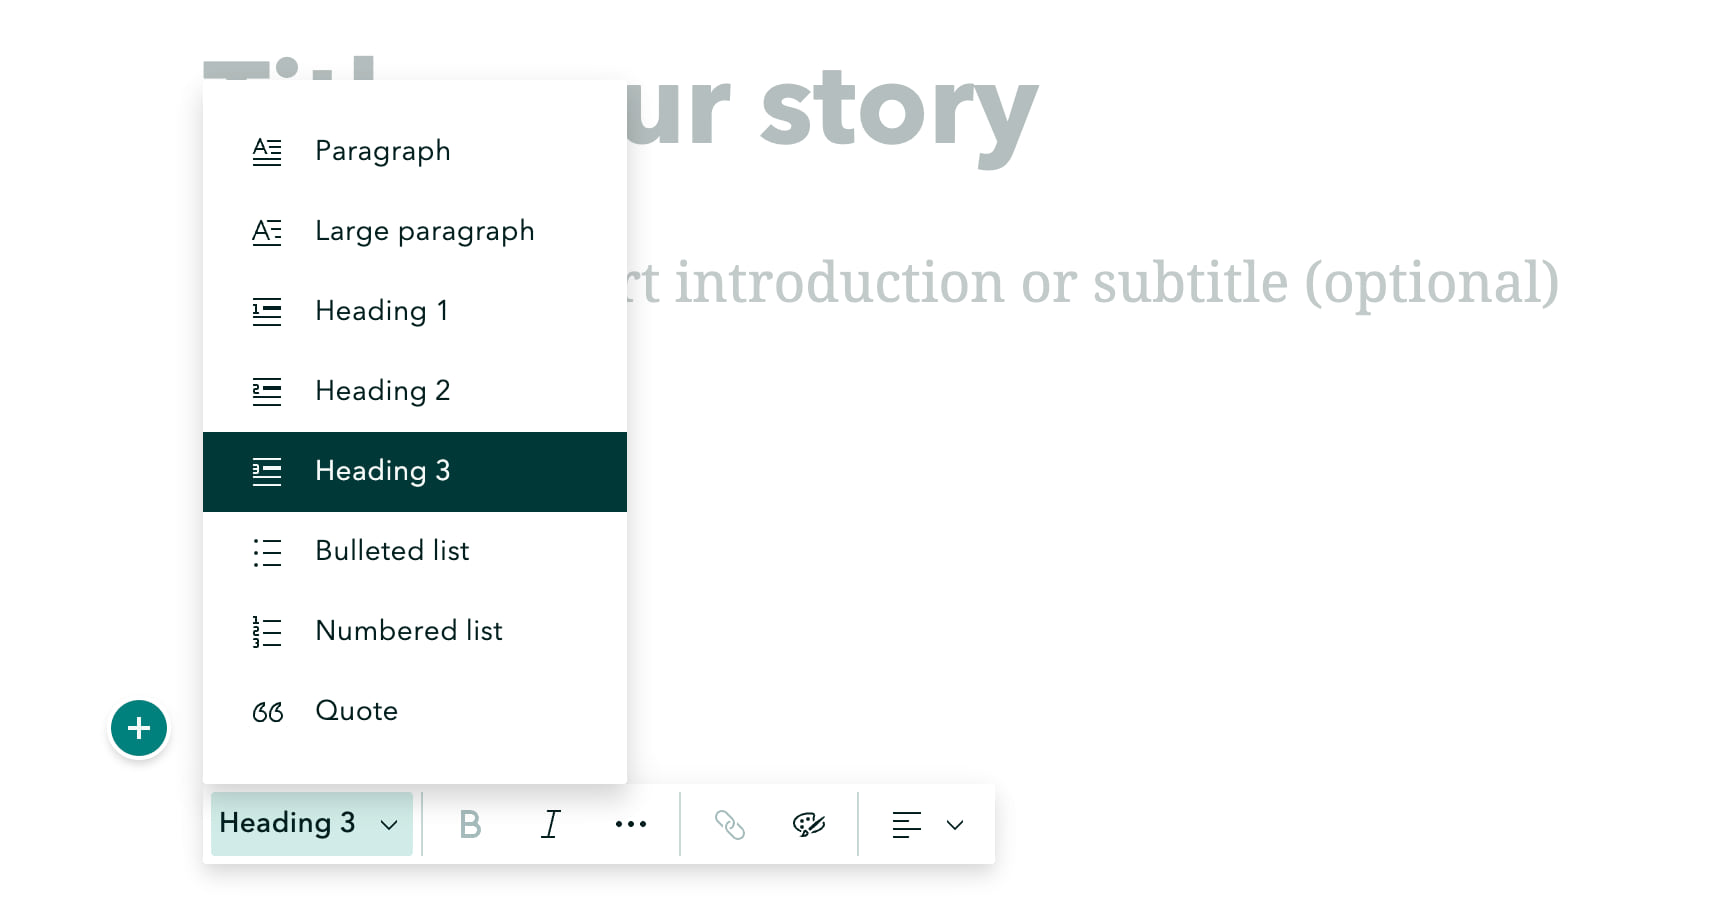
There are now several new capabilities of the text editor that provide you with more options for how to arrange and format text, including a third heading style. This provides the opportunity to have one more level of hierarchy or organization for the content in your story. You can copy and use links to these headings just like the other heading levels. For instructions on how to do this, please see Add Another Dimension to Your Stories with Heading Links.
You can now also adjust the alignment of headings throughout your story. This includes headings that appear in sidecar narrative panels and the credits heading.
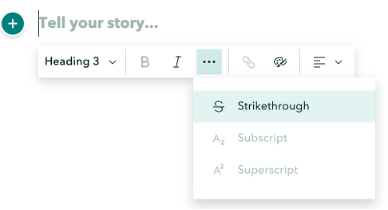
Lastly, if information in your story needs to be updated, but you want to preserve the original text, you can use the new strikethrough formatting option. Strikethrough formatting has been implemented in an accessible way so assistive devices will communicate the stricken text to anyone using a screen reader.

Track engagement with Adobe Analytics
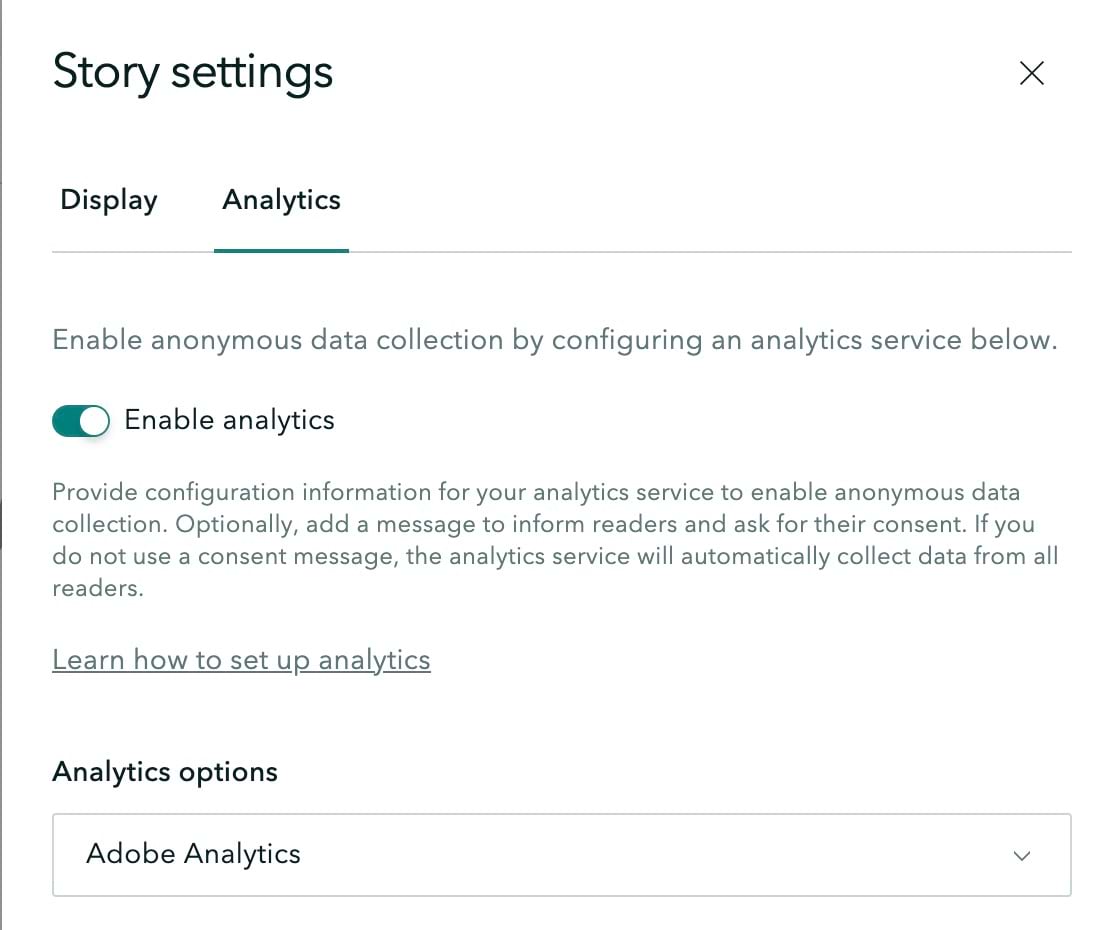
Understanding how readers engage with your content helps you measure its success. The tracking capabilities of ArcGIS StoryMaps have been expanded to include Adobe Analytics in addition to the previously supported Google Analytics. These options can be found in the Story settings and are very simple to set up. Just select which web analytics service you’re using, paste in your configuration parameters, and publish your story. For more details on using this feature, please see Use Web Analytics to Measure Your Traffic in ArcGIS StoryMaps.
Please note that to track analytics in your stories, your organization’s administrator needs to enable this feature.
Video demonstrating how easy it is to configure your analytics service to track a story.

Image editor (beta)
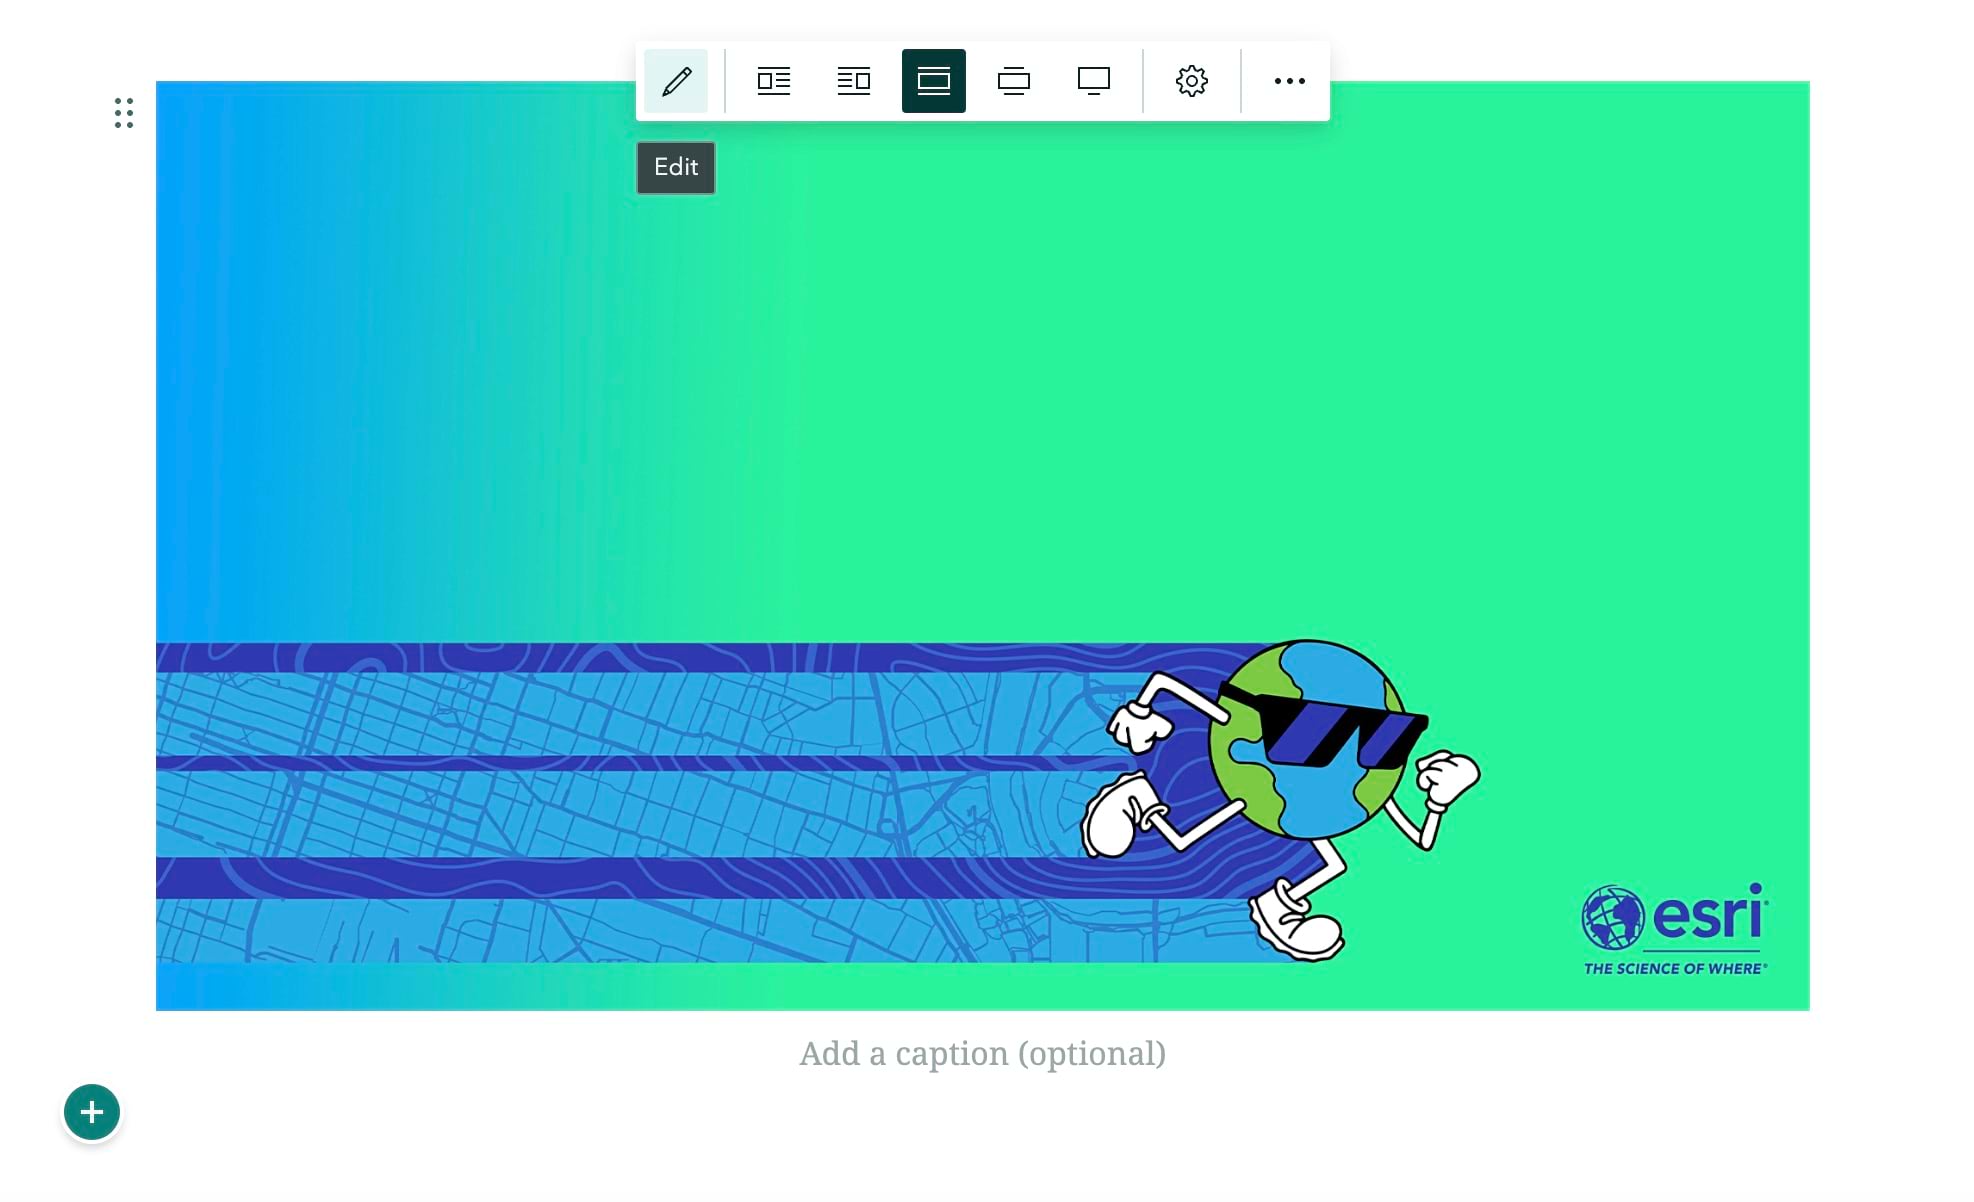
When including an image in a story or briefing, you may need to modify it; you can now do that directly from the web app builder in ArcGIS StoryMaps for stories and briefings. After uploading an image in the builder, you can now use the image editor to crop, flip, rotate, and mark up photos. When cropping you can choose from a set of standard aspect ratio rectangular size, set your own custom size, and even give the image rounded corners or an oval shape. On the Markup tab, you’ll find drawing tools that can be used to annotate your image to call out specific parts. If you want to learn more about editing and working with images, please see A Guide to Working with Images in ArcGIS StoryMaps.
Please note that to access the image editor on ArcGIS Enterprise 11.2, your organization’s administrator needs to enable beta features.
Video showing how to crop and markup images in the image editor.

Shortcut guide
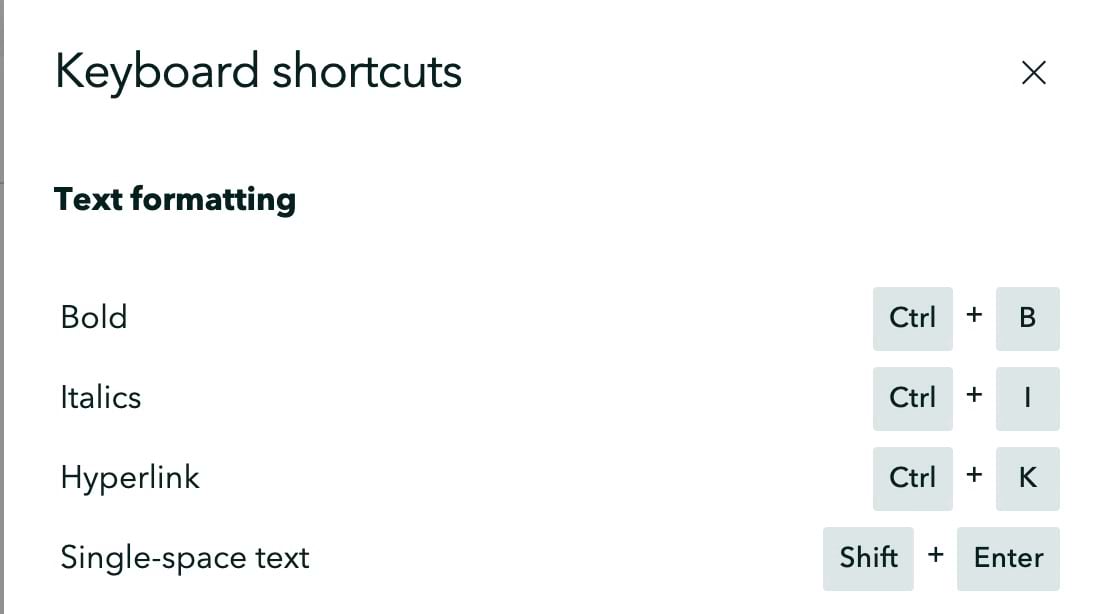
To improve the accessibility of ArcGIS StoryMaps, a new keyboard shortcut guide has been added to the Help menu. It gives you the freedom to quickly add a heading or list item when typing or inserting a link without touching your mouse. The full list of shortcuts has been outlined in our documentation, but they’re now always close by in the Help menu (under the question mark button in the header at the top of the page) whenever you need a reminder.


Fit image to screen
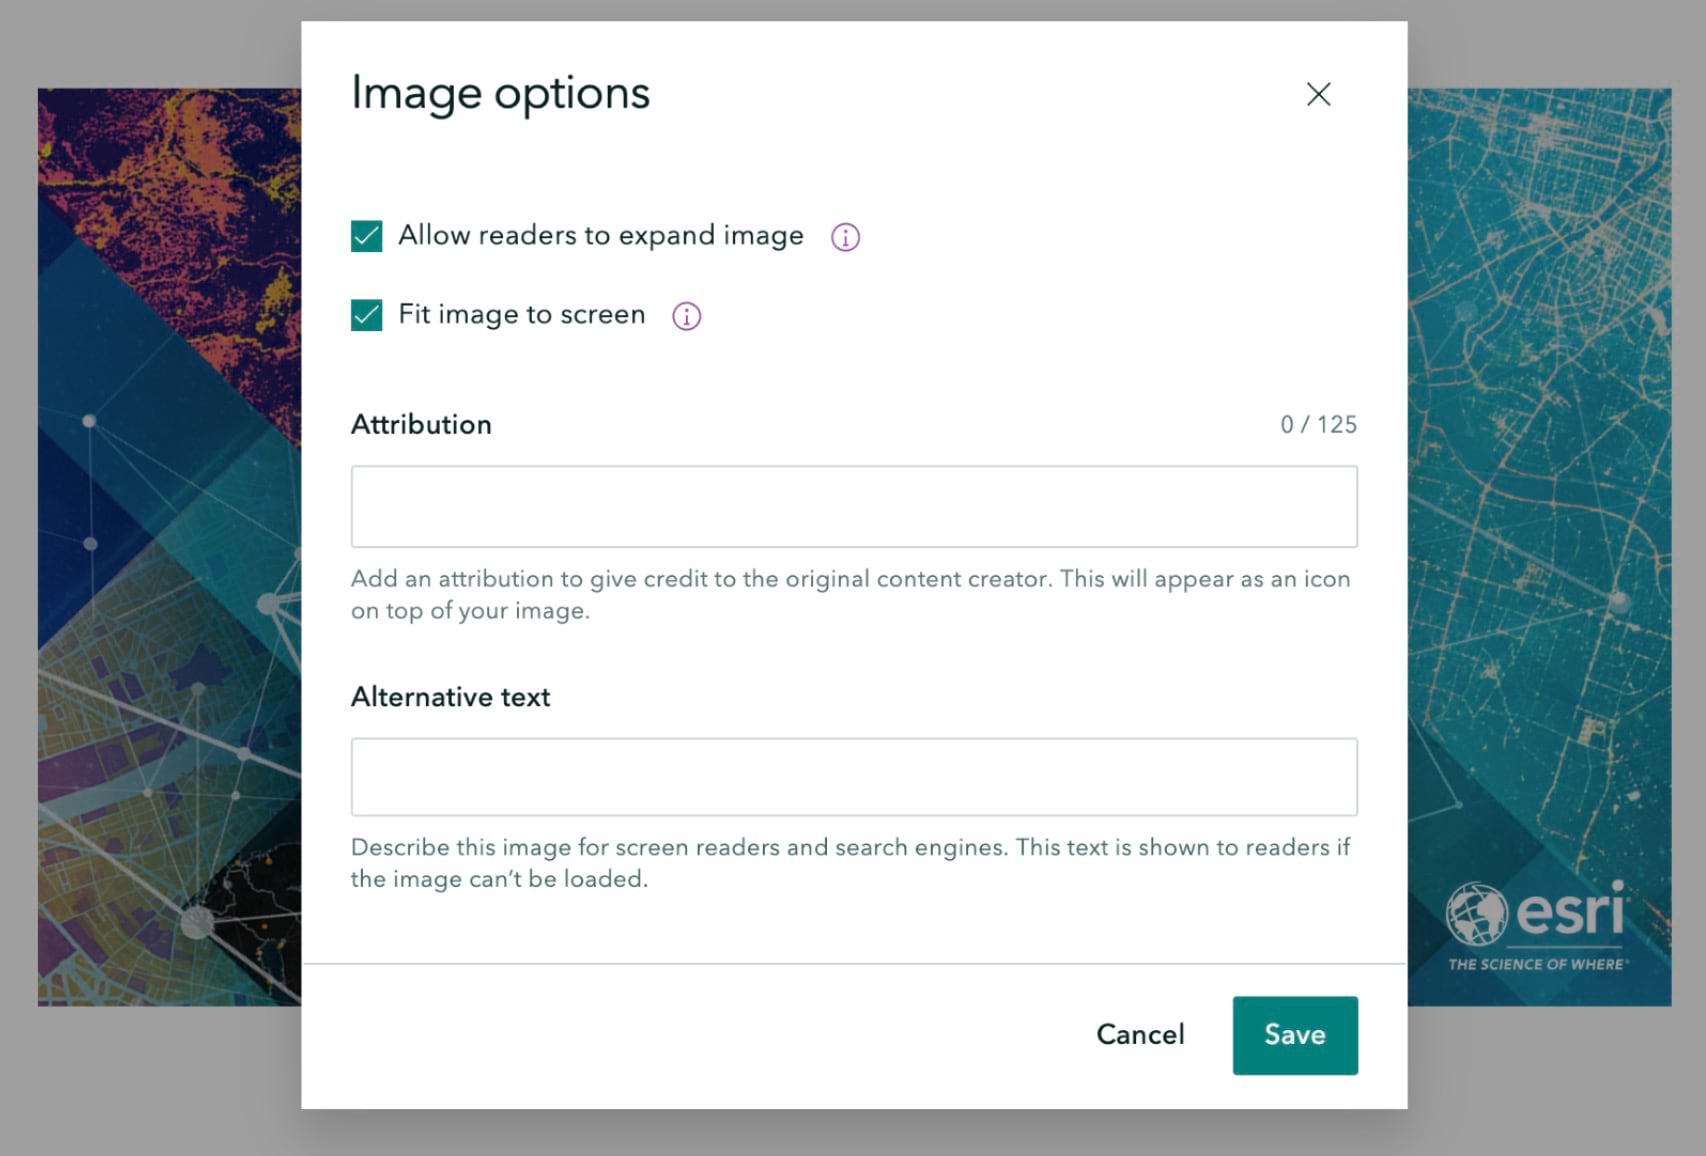
There is a new image option that you can use to configure the display of images. Sometimes you have an image, such as a tall infographic, that you want readers to take in bit by bit as they scroll down the page. However, in other cases you may have a portrait image or photograph that you want readers to see all at once. Until now, there wasn’t an easy way to address the latter situation. If you have a portrait image that you’d like to appear fully on the screen, you can now go into the image options and check Fit image to screen. Voila! The image will appear fully for your readers.
Video showing how to use the new Fit image to screen option.

Accessibility updates
Accessibility enhancements have been implemented throughout ArcGIS StoryMaps in the areas of keyboard navigation, focus management, and screen reader support.

Mapping
Overview map
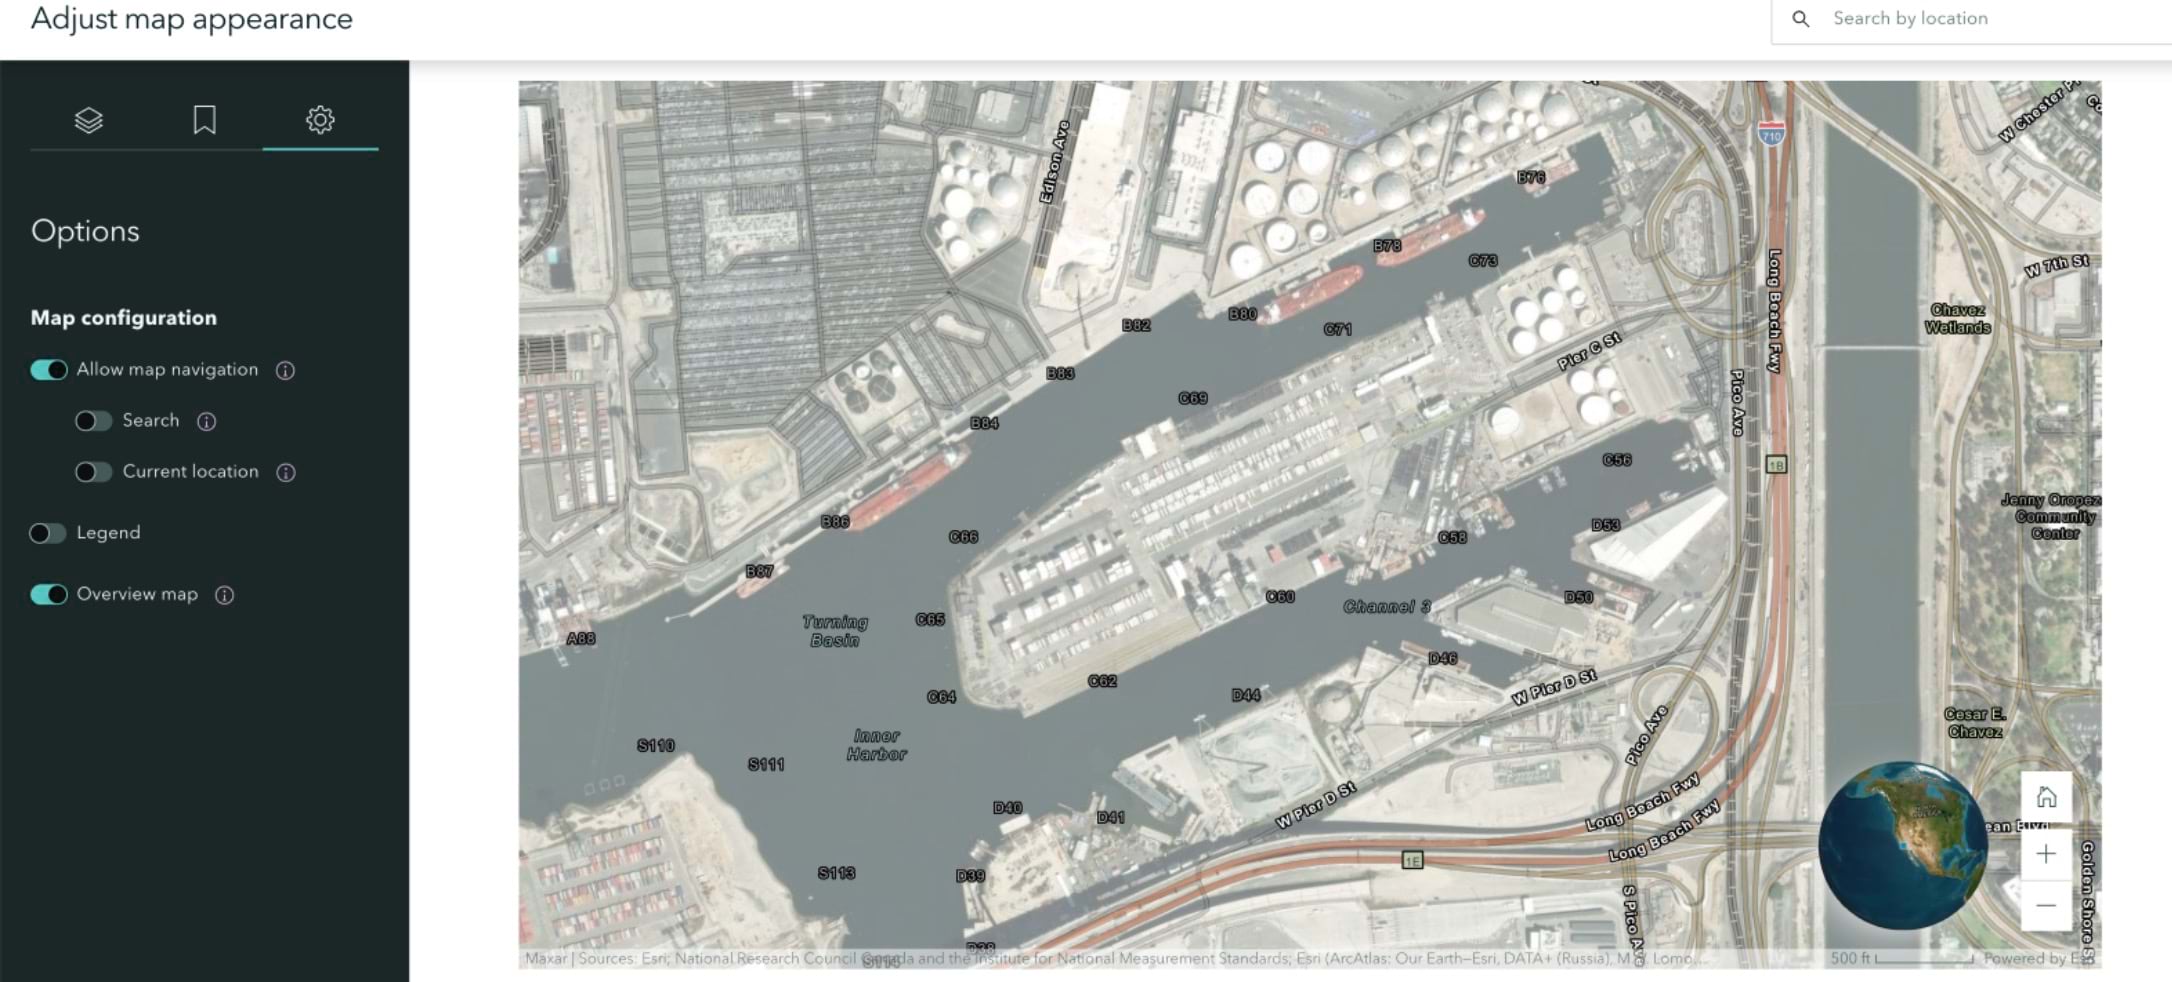
When you add a map to a story, you can now include an overview map to provide more geographic context for your readers. The overview map is a global view that indicates the current extent of the main map. As a reader moves around in the main map, the overview map automatically rotates and updates the extent indicator to reflect the currently viewed area. It’s easy to enable an overview map on any of your maps; just go to the Options panel in the map designer and toggle it on for any express map, web map, or web scene. You can see the overview map in action in Is the world full or empty?
Video showing how to add an overview to your maps in ArcGIS StoryMaps.

Format map tour descriptions
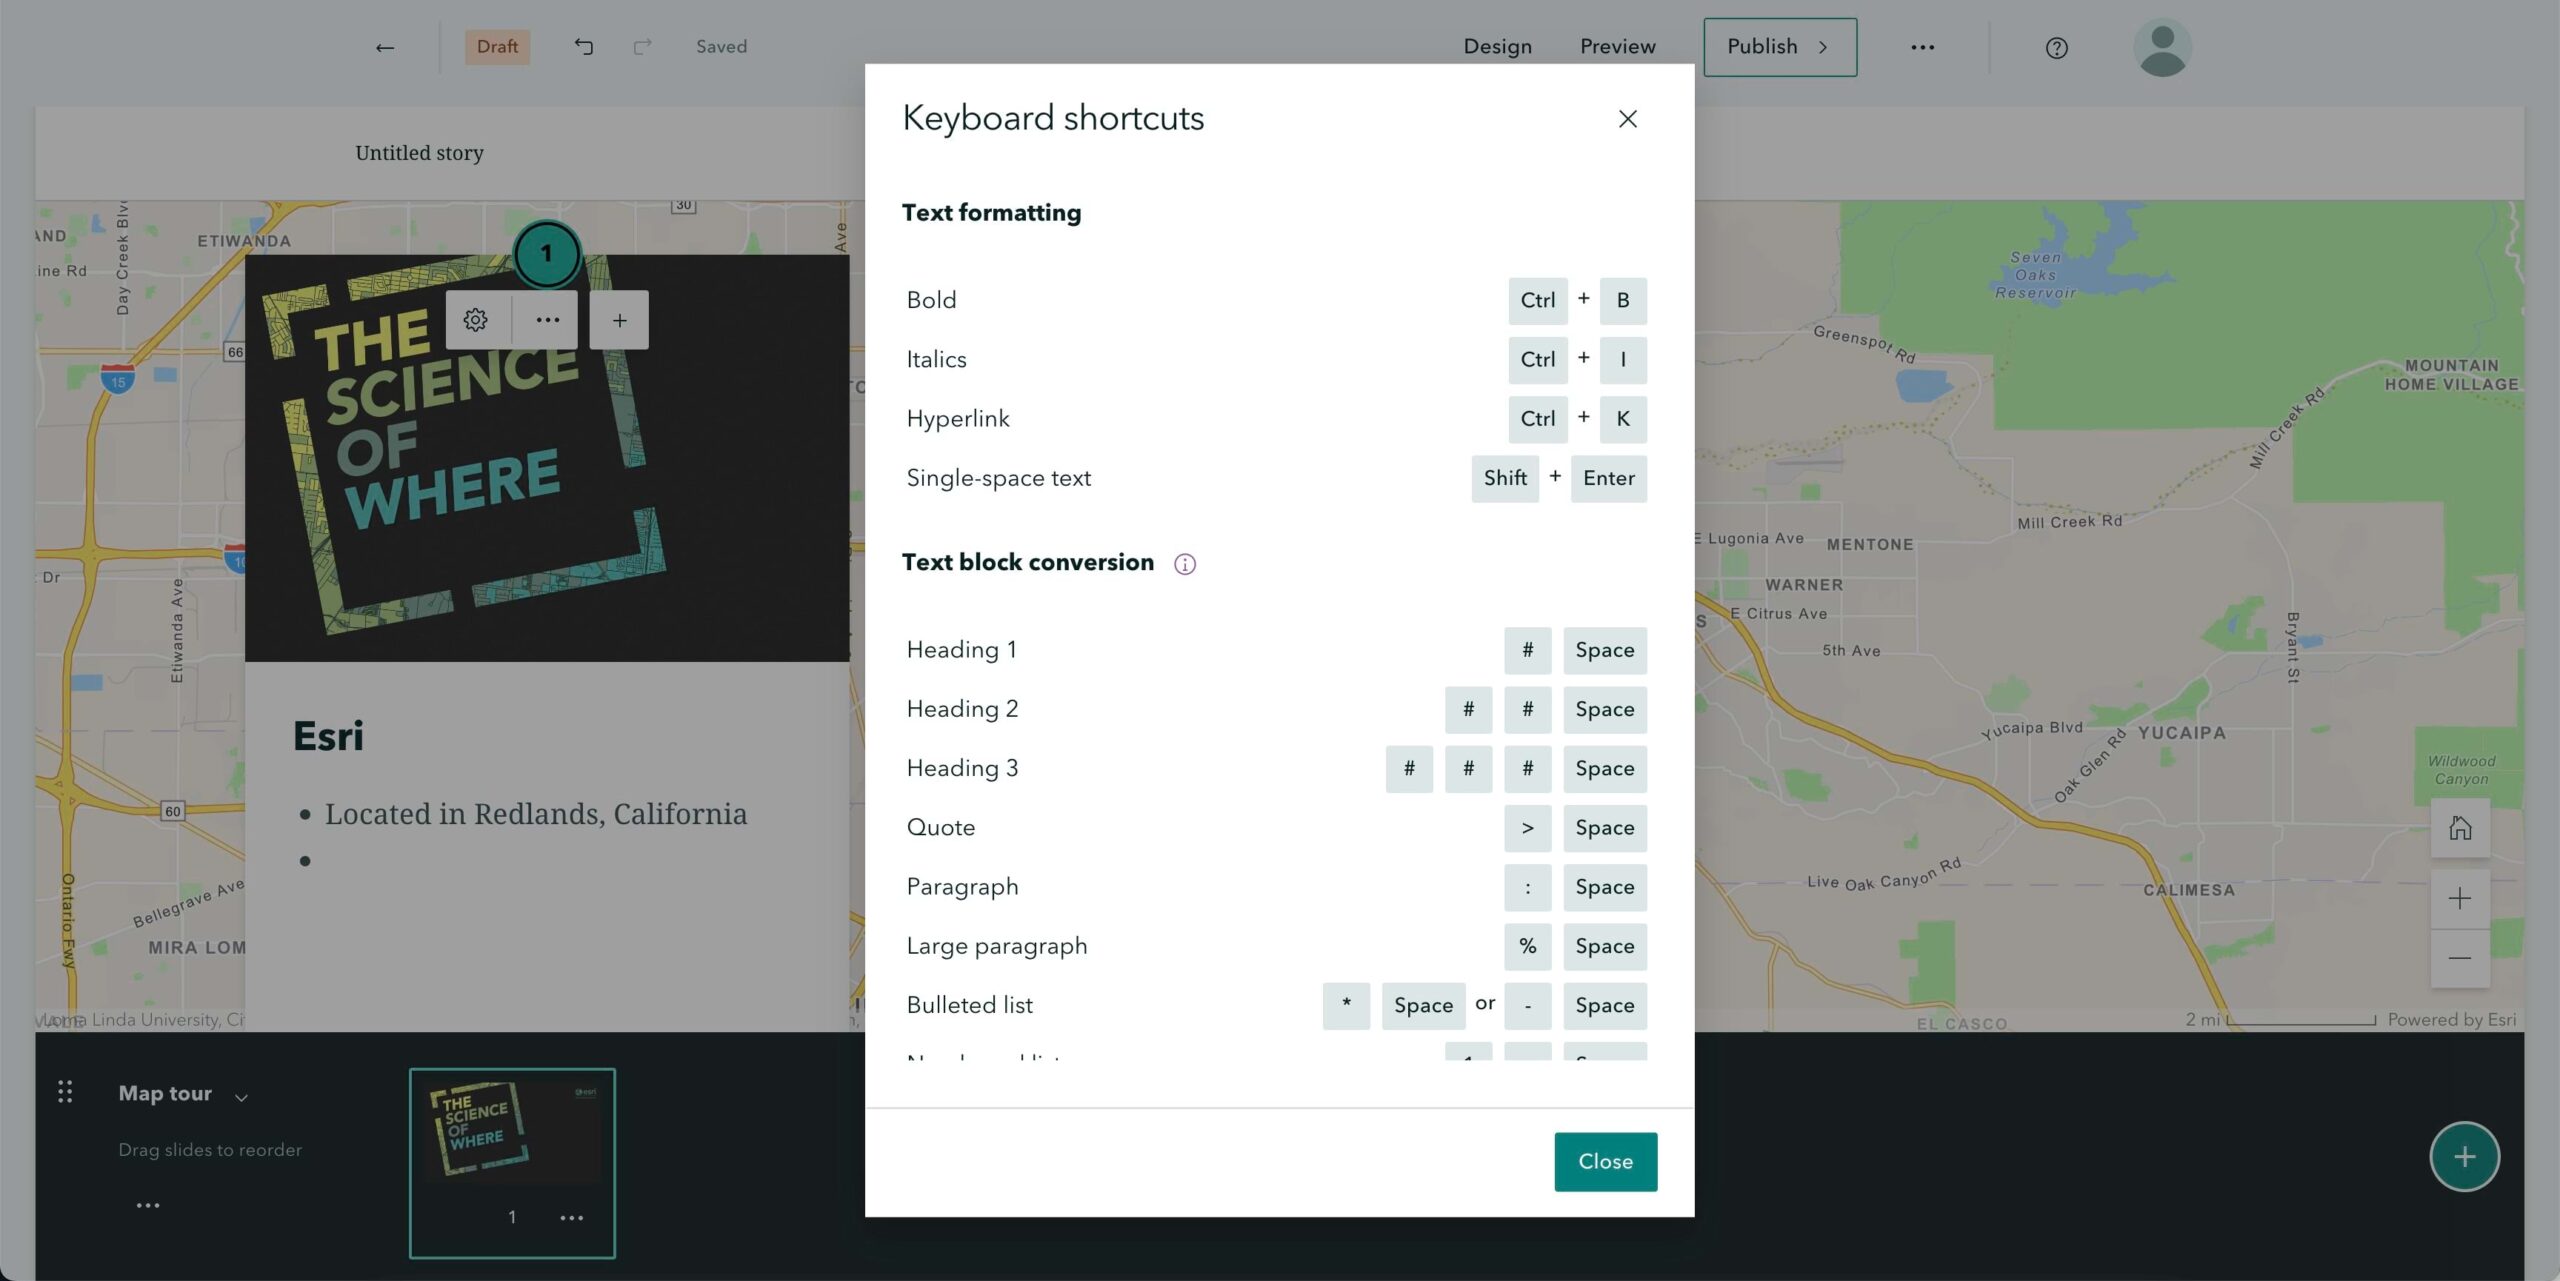
Map tours are one of the most popular blocks in ArcGIS StoryMaps. You can now add bulleted or numbered lists to your map tour descriptions using the standard keyboard shortcuts in the story builder. If you’re looking for other ways to elevate your map tour, check out Boost your map tour experience with countdowns, 3D globes, and more.

HTML tags in map tours created from feature layers
If you’re creating a map tour from a feature layer, you’ll find that many more HTML tags are supported–opening up the possibilities for how to arrange and format the text of your tour descriptions. You can include multiple paragraphs in the descriptions of map tours created from feature layers (using <br> or <p> tags) and lists (<ol>, <ul>, and <li>) as well as superscript (<sup>) and subscript (<sub>). We’ve also included support for additional tags for bold and italic (<b> and <i>), which join the tags that were already supported for these types of formatting (<strong> and <em>), and of course you can include links (<a>).
Armed with Arcade and a feature layer of information about a set of places, you can now create very informative and attractive descriptions for your readers! For more on this topic, see Using ArcGIS Arcade to your story’s advantage.

Add alternative text to a map in a map tour
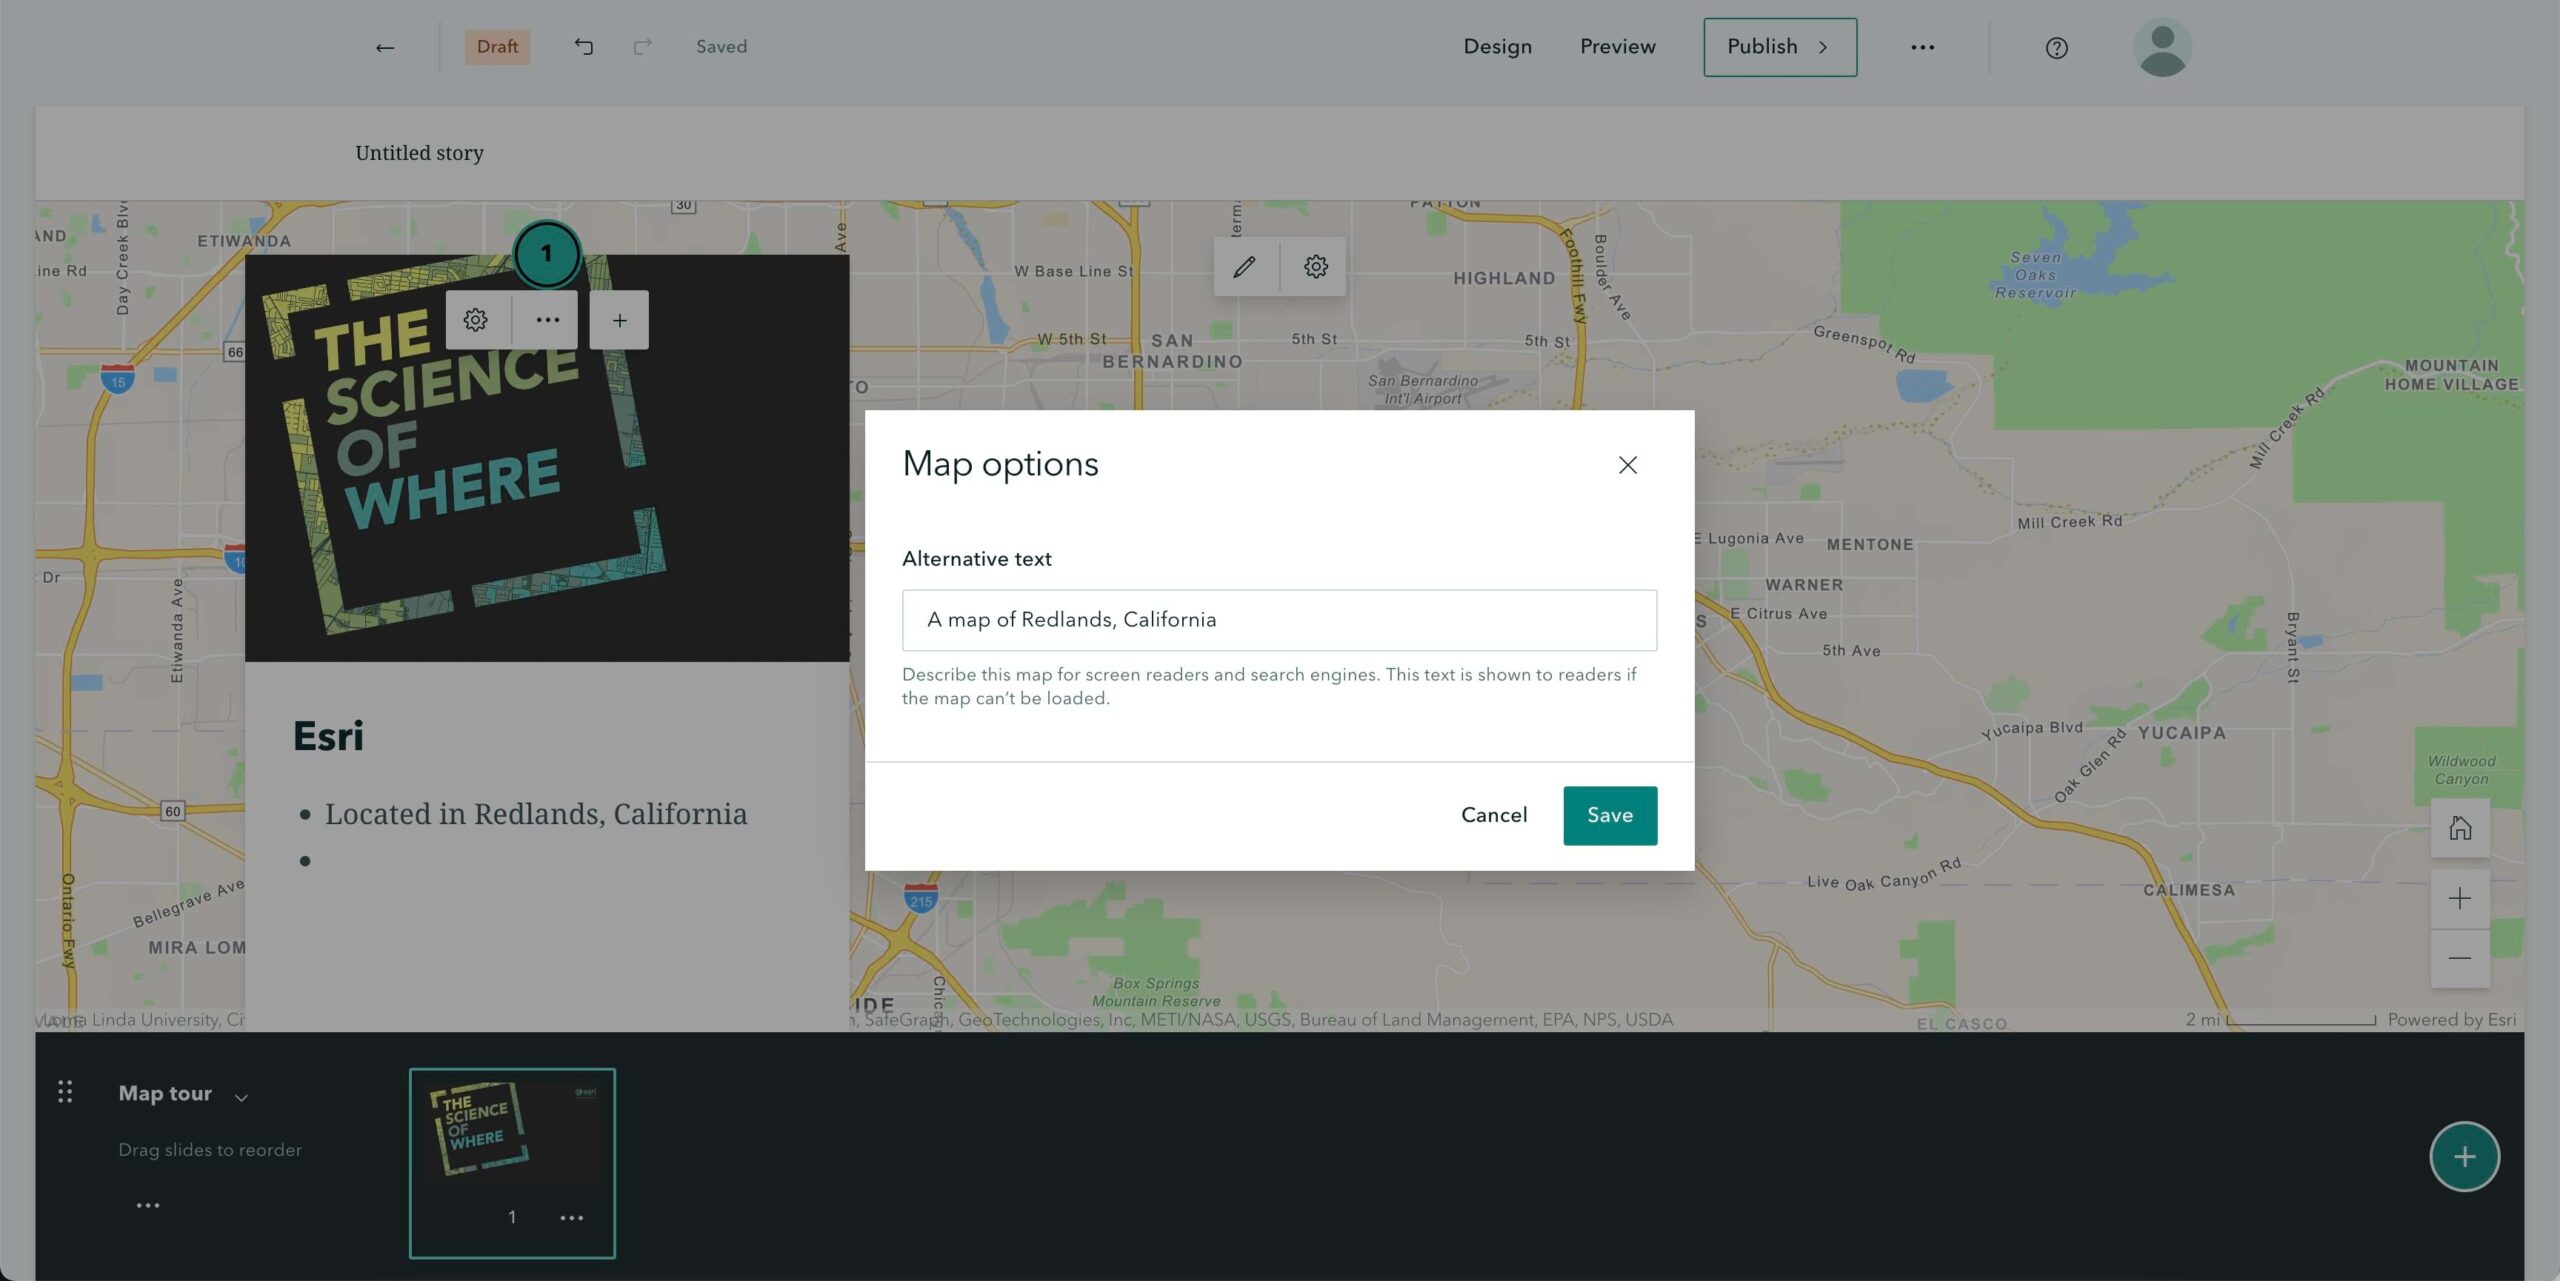
This is an update that came directly from your feedback. You can now add alternative text to the map in a map tour. To help ensure that your story is accessible to anyone using a screen reader, you should consider adding alternative text for all the images, videos, maps, and other media in your story. With the addition of this feature, there’s a small change in the map toolbar. Configuring the settings for the map in your map tour is now done via the Edit button (pencil icon), and alt text can be added using the Options button (gear icon). This makes the configuration toolbar of maps in map tours consistent with how it looks for other maps.

Collections
Collection Description
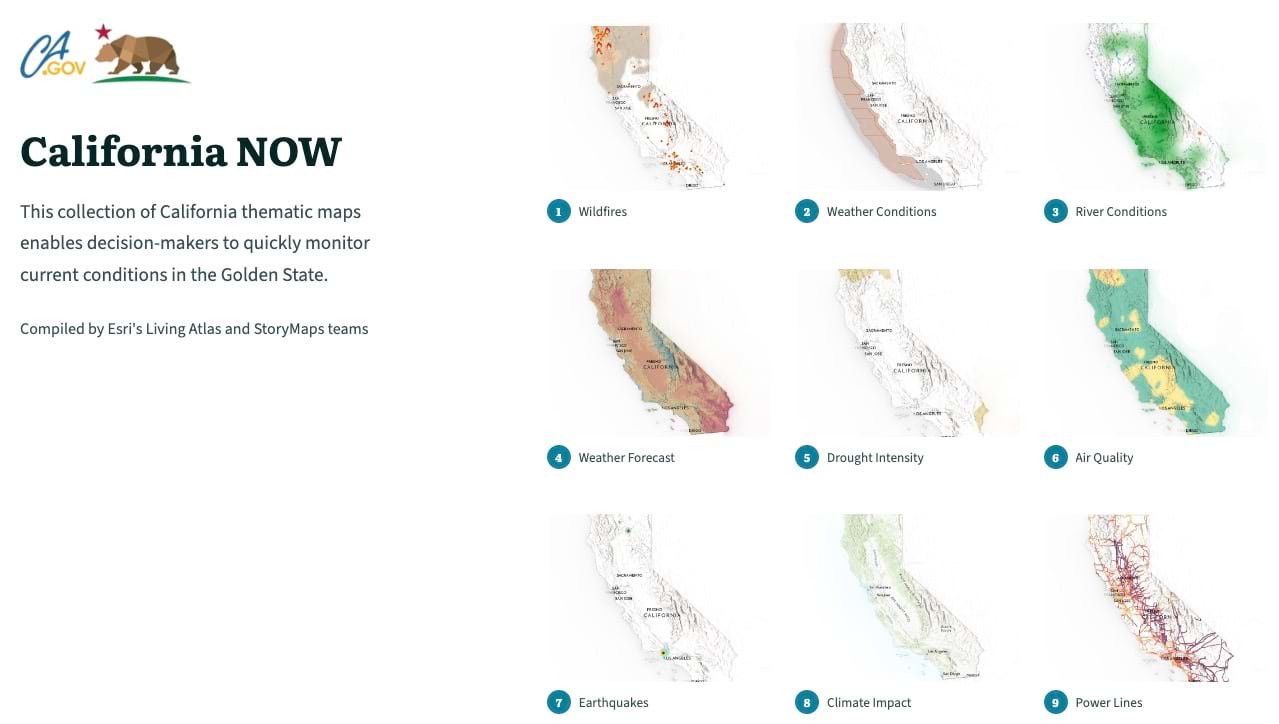
Collections are a great way to group together a set of stories and related resources. You can use them to create a set of tutorials, group stories on similar topics, or bundle stories that are chapters into one longer narrative. With this update, you now have more space to provide descriptive information for a collection. In addition to the title, byline/author name, and summary, there is now a new description field. While the summary is still ideal for providing a short subtitle for your collection, the description field is now available for adding a longer introduction or more background about the contents of a collection.
In addition to being longer than the summary, the new description can contain formatted text. Now you can include links, lists, and flourishes of color on the collection overview to communicate your message. To format text, just select it and use the toolbar or use one of the standard keyboard shortcuts. This collection has a description so you can see what it looks like in a live example: 2022 ArcGIS StoryMaps Competition Winners.
Video demonstrating how to add and format the new collection description field.
The summary and description fields are both optional, but we recommend including a summary for collections you plan to share publicly since that piece of information is shown when your collection is shared on social media sites or when people discover it via web search results. The three main fields on the collection overview page nicely match up with the corresponding ArcGIS item detail fields of the same names (title, summary, and description). When publishing, the description text will be automatically added to the description for your collection’s ArcGIS item details, but you can choose to disable this update in the publish options.
If you haven’t made a collection yet, check out Start Your First ArcGIS StoryMaps Collection or this tutorial to get started.

Customize collection item summaries
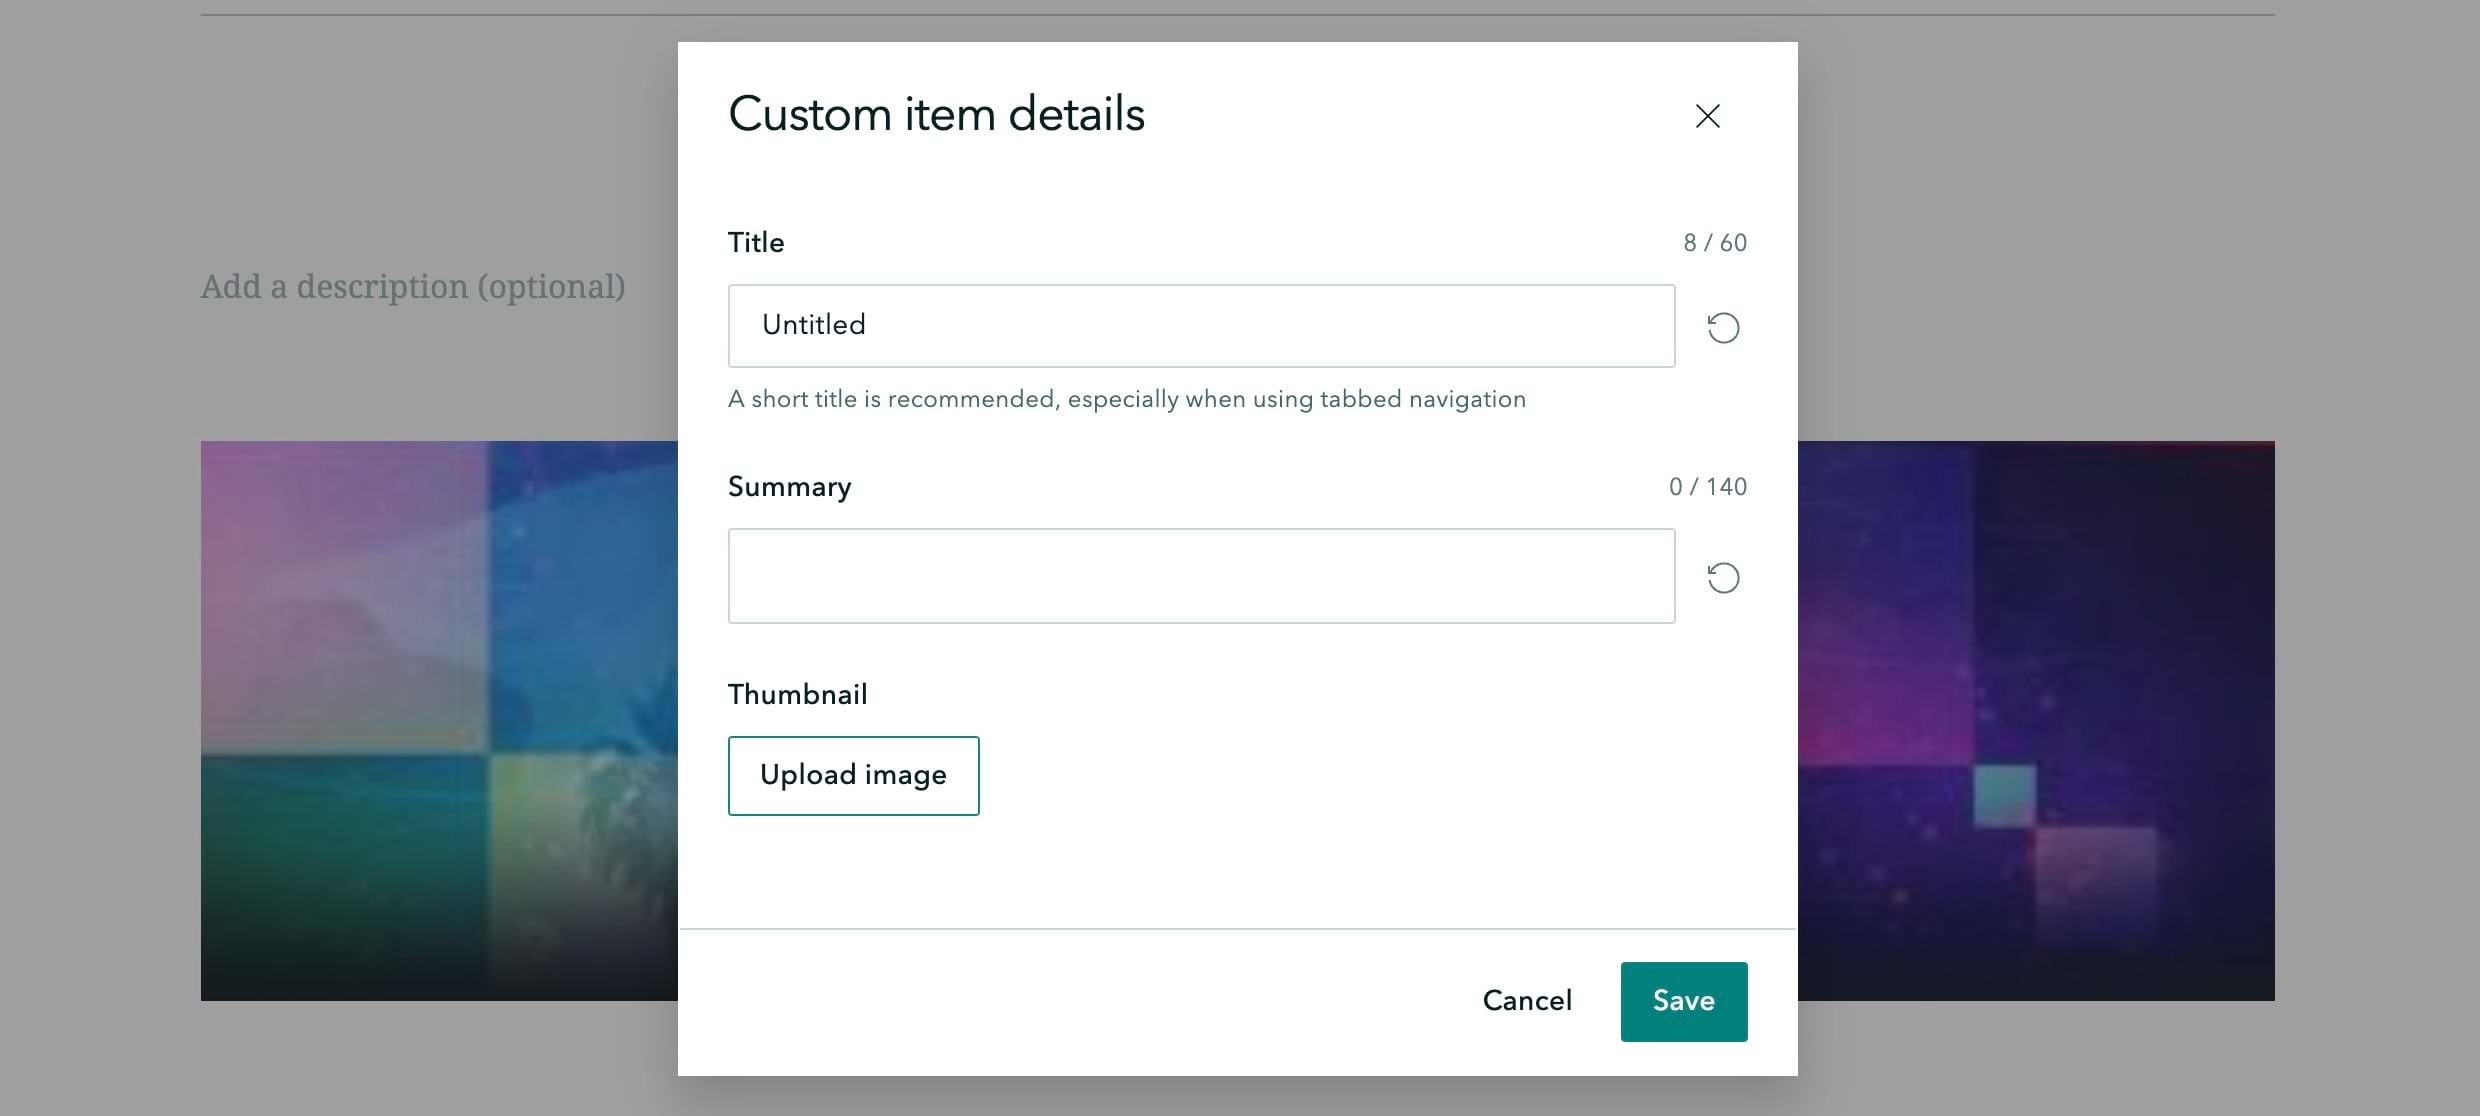
Collections allow you to create a set of stories to share with others. When building a collection, you can choose from three different overview page layouts: Grid, Magazine, or Journal. The Journal layout is unique among these three because it not only shows the title of each item but also a summary. You’ve already been able to customize the titles of collection items, and the summary is also now available for editing. If the current summary doesn’t apply in the context of your collection, you’re now able to modify it however you like. If you make changes that you want to roll back, don’t worry! There’s a handy reset button for that.
Video showcasing how to customize the summaries for items in a collection when using the Journal layout.
For additional tips on using collections, please see Enhance your ArcGIS StoryMaps collections.

Hide the “Get started” button and “Collection” heading
One small but often-requested feature that is now available is the ability to remove some of the elements from a collection overview page. This includes the “Collection” heading and the “Get started” button. These elements can be helpful in some cases, but they are not always useful. You can now easily remove them in the collection settings by selecting “Hide overview page elements.”
Video sharing how to hide the “Get started” button and “Collection” heading.
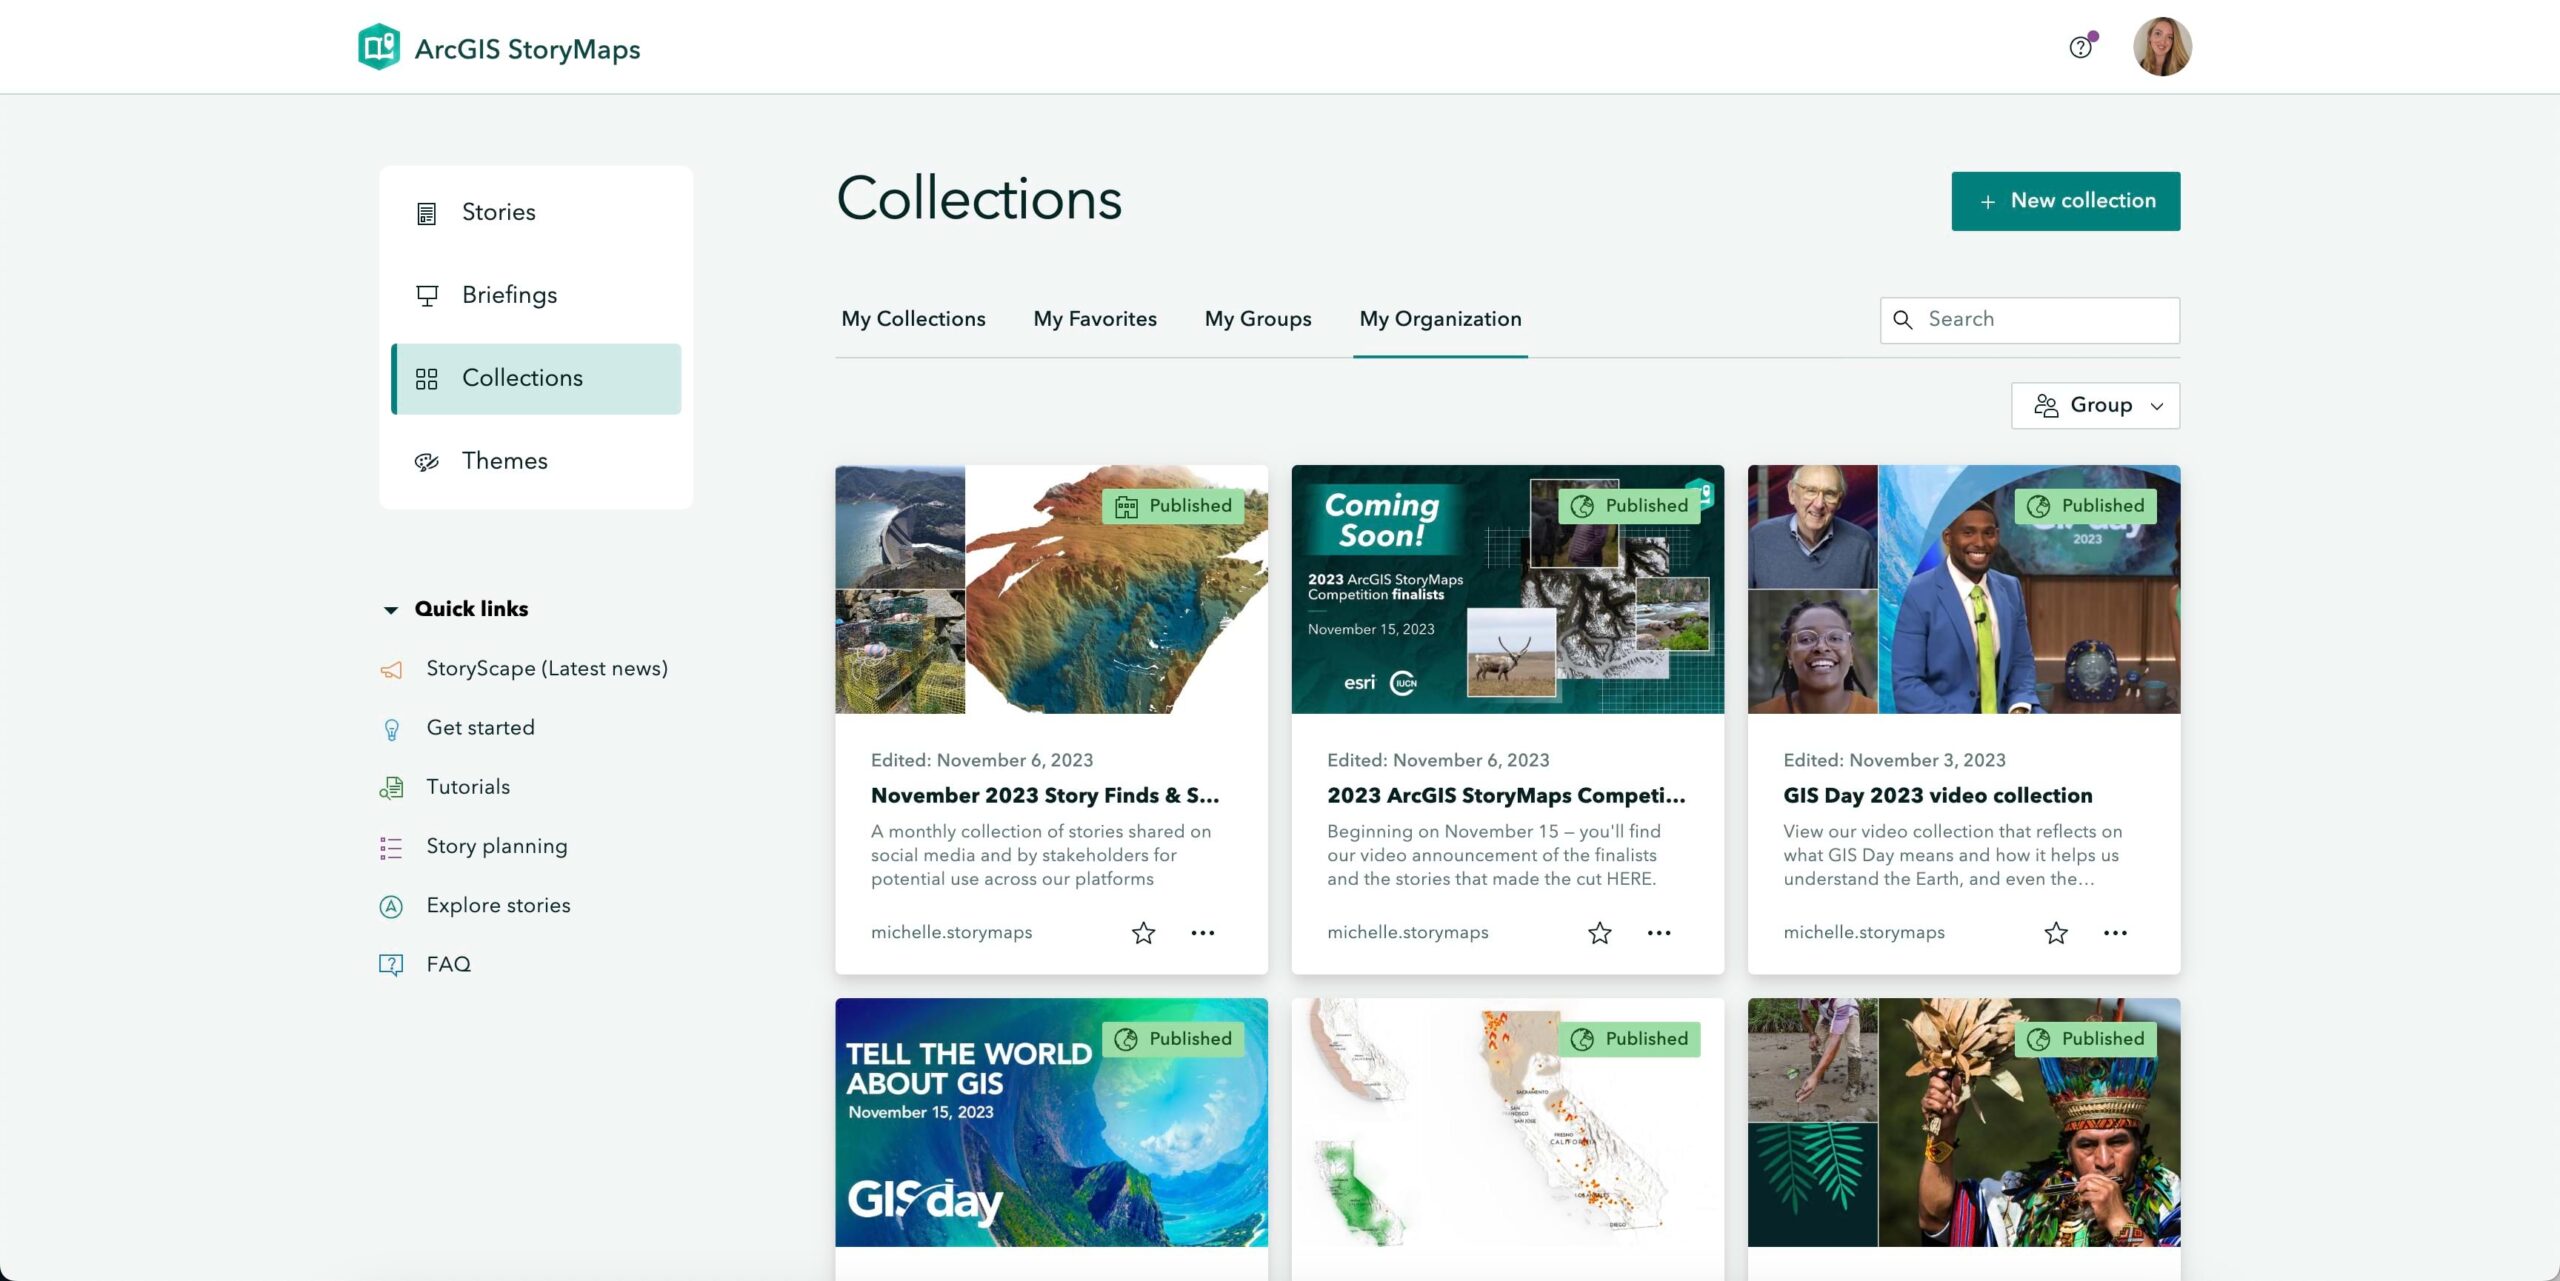
Please note that collections have their own item type name and icon to differentiate them from stories in your ArcGIS Enterprise portal.

Reminder about classic Esri Story Maps templates
As of ArcGIS Enterprise 11.0, new classic Story Maps can no longer be created, and existing Story Maps created with the classic templates cannot be viewed. There are lots of resources to assist you in your transition to using ArcGIS StoryMaps. Below are a few good places to start:


Article Discussion: