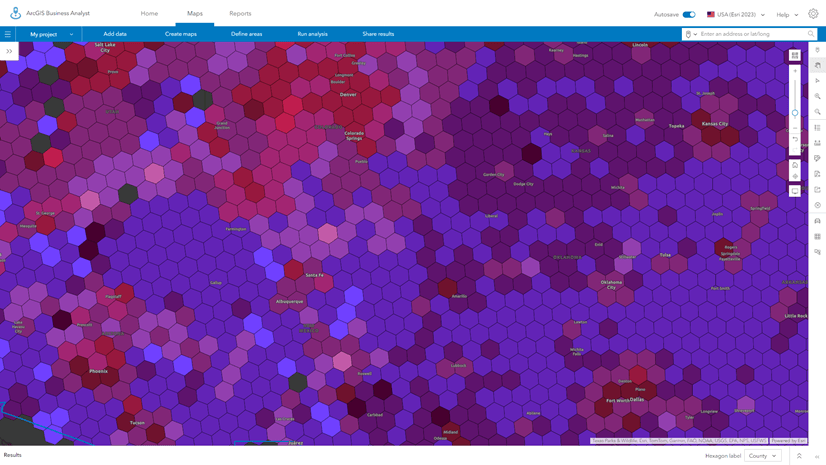
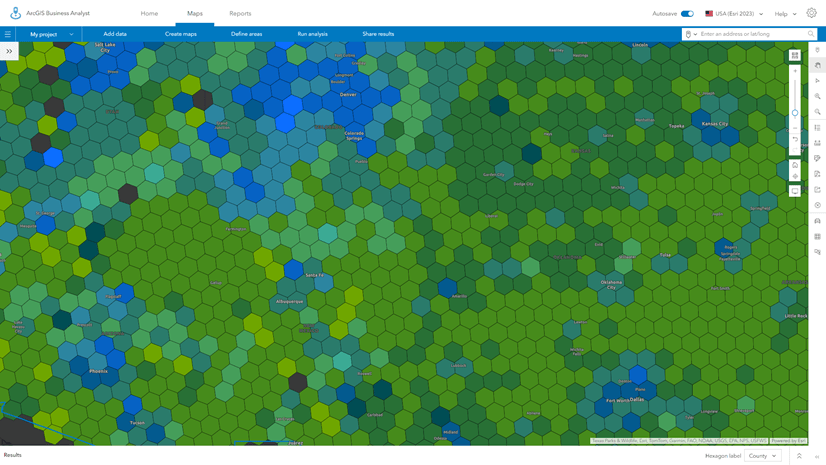
Business Analyst Web App users have been mapping with hexagons since February 2024, using them as a geography option in popular workflows: color-coded maps, smart map search, and suitability analysis. Although they are simple six-sided shapes, hexagons are actually quite complex mapping tools. This article will offer advanced information regarding hexagons’ relationships to their underlying data.
Can different hexagon datasets I create be joined together to form a continuous layer?
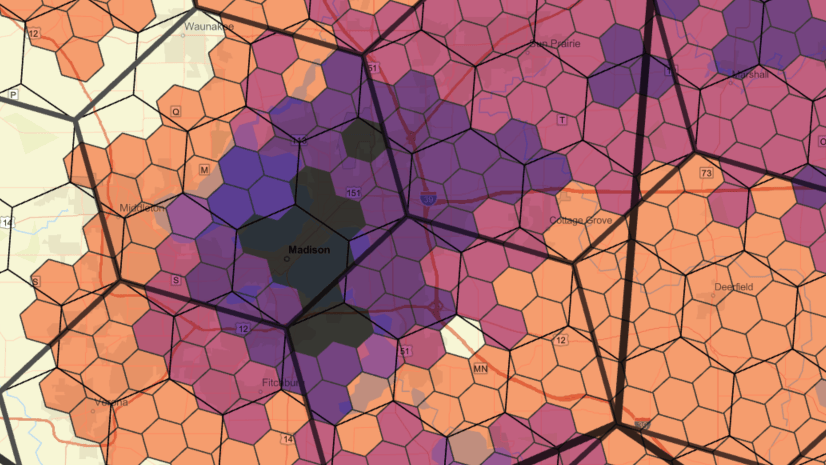
H3 hexagons can always be joined together, overlaid, or merged into a single continuous layer with no partial overlaps. The H3 hexagon model is designed to create a known continuous lattice without slivers independent of the area of interest in which the H3 hexagons are being mapped.
For example, you can create a map at H3 resolution 6 for Arizona using the state outline as the analysis extent and then overlay a previously built H3 resolution map of California. There may be hexagons that wholly overlap along the border that will need to be removed, but each individual hexagon at the edge of the Arizona map will exactly abut its neighbor in California. With other hexagon tessellation schemas, slivers and gaps are common.
Note that you cannot seamlessly join maps (layers) of H3 hexagons of different resolutions.
Can I use my own data in hexagon mapping and analysis?
Both smart map search and color-coded maps can also use hexagon grids when they have been added to the project (via Add web maps and layers) and are displayed on the map. You must select the Browse all variables option, and then use the Map layers category to select and add attributes that are stored in the map. You cannot use Esri’s attributes when using your own custom map data.
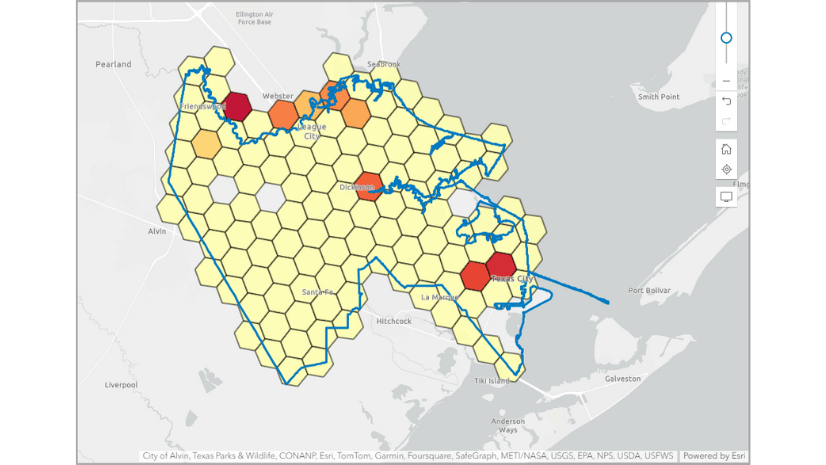
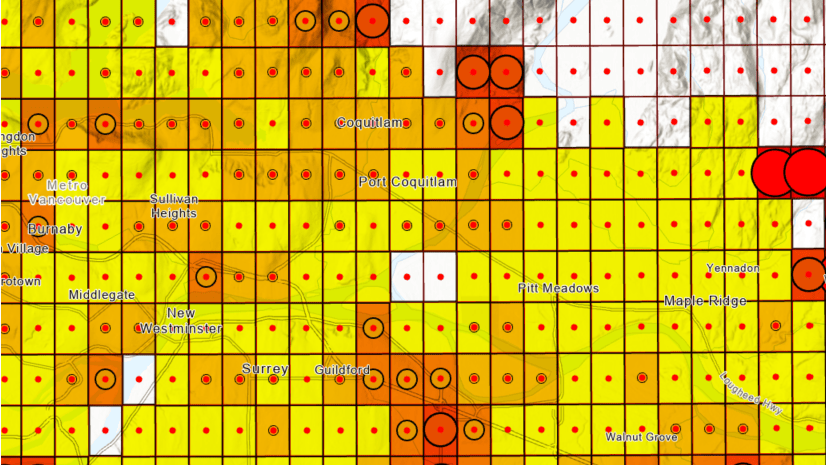
You can also use any grid tessellation in suitability analysis, up to a maximum of 10,000 features, to use as sites. This is best achieved by displaying the map first, and using the Features on the map option rather than picking individual sites from the table of contents. You can then use the prepopulated lists or create your own criteria for suitability analysis. The attributes used in the analysis criteria will be apportioned to the sites from Esri’s data catalog. As of February 2024, it is not possible to use the hexagon attributes that are contained within the map layer, as each hexagon is treated as a candidate site.
Can I export data for hexagons in Business Analyst Web App to Excel?
As of February 2024, you can export data in suitability analysis to Excel. Color-coded maps and smart map search do not permit the exporting of hexagon data.
Can I add data from Living Atlas of the World to use in hexagon mapping and analysis?
If hexagon maps, or other types of tessellated grids, are available as shared feature services in Living Atlas of the World or ArcGIS Online, you can use them in exactly the same way as described above for your own custom data. Feature services shared within your organization can also be used.


Article Discussion: