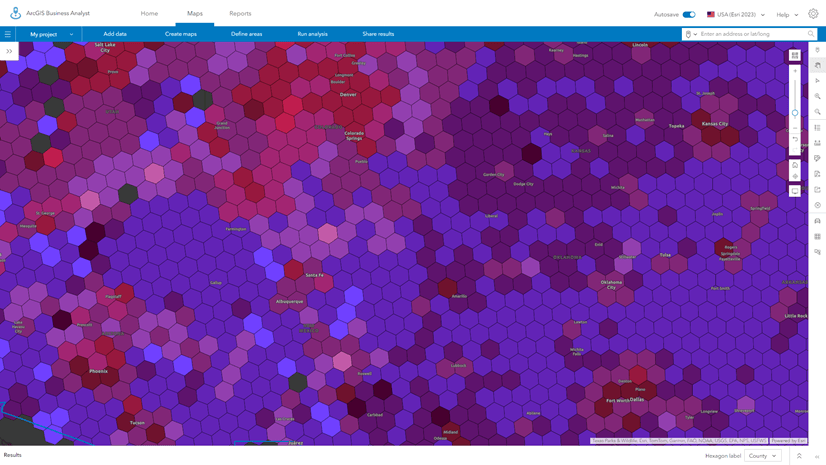
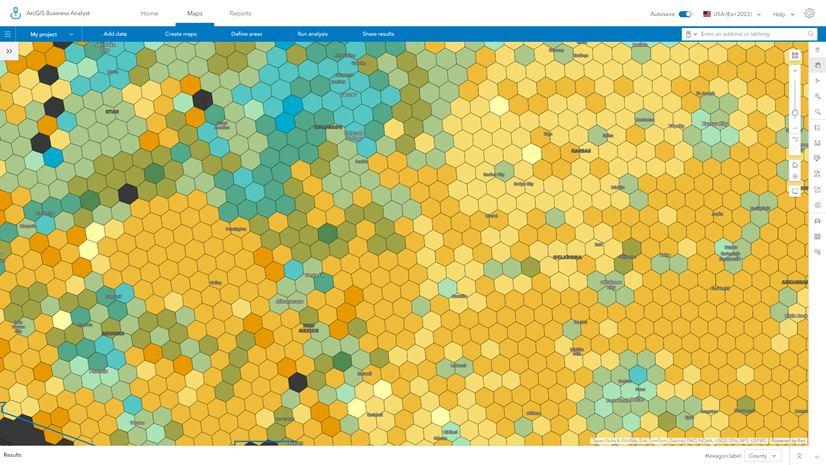
Business Analyst Web App users have been mapping with hexagons since February 2024, using them as a geography option in popular workflows: color-coded maps, smart map search, and suitability analysis. Although they are simple six-sided shapes, hexagons are actually quite complex mapping tools. This article will provide an introduction to hexagons and helpful terminology to know as you use them.
What are mapping hexagons and how are they supported in ArcGIS?
A hexagon is a shape used to create a tessellated grid of regular, commonly shaped polygon features that cover a given extent on a map. The types of gridded polygons that can be created varies across ArcGIS products. Independent of product, all tessellated grids fit into three common shapes (hexagon, square, or triangle) that can also be rotated to form other tessellated grids (transverse hexagon and diamond).

Square and diamond grids are often known as fishnet grids because they resemble fishnets, while hexagonal grids most resemble chicken wire.
Business Analyst users of both the Pro and Web apps most commonly use Uber H3 hexagons, which are a widely adopted global grid system, and abbreviated to H3 hexagons.
| Product | Hexagon capabilities |
|---|---|
| ArcGIS Pro | Supports triangles, squares, diamonds, hexagons, H3 hexagons, and transverse hexagons. Demographic attributes can be added to these shapes using the GeoEnrichment service. |
| Business Analyst Pro | Provides a geoprocessing tool, Generate Grids and Hexagons, to create squares, hexagons and H3 hexagon tessellations. Demographic enrichment can be performed at the same time by apportioning to the polygon shape or a buffer (distance, drive-time, etc.) around the shape centroid. |
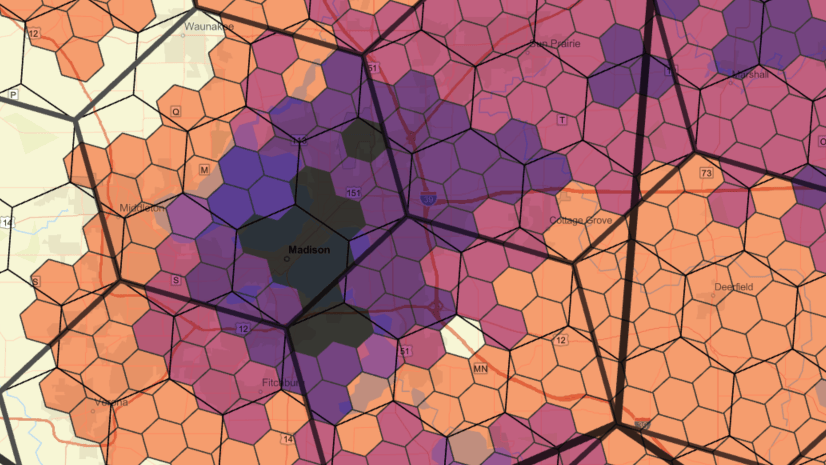
| Business Analyst Web App | Provides demographic data pre-tessellated into H3 hexagons for users with an Advanced license. Available for color-coded maps, smart map search, and suitability analysis. |
How do hexagon grids differ from square grids?
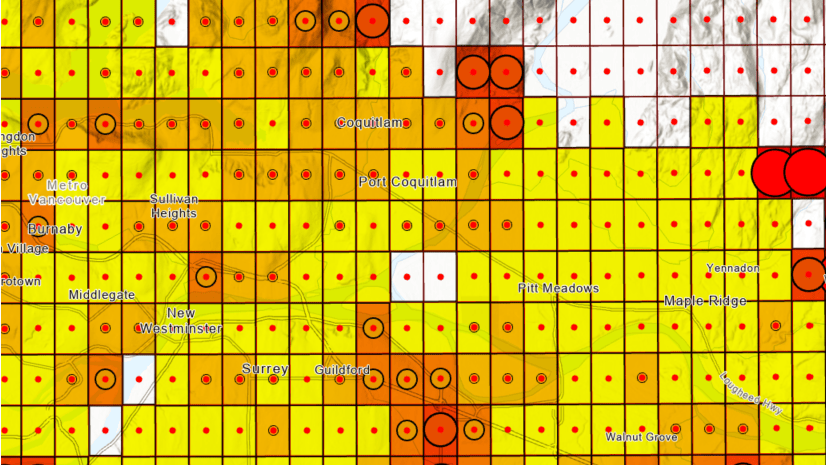
Hexagons are the most efficient way to tessellate a shape and reduce the sampling bias of square grids. Not only do squares have a high perimeter-to-area ratio, the distance from the centroid of the grid to its closest neighbors (enclosing eight cells) is different along the x- and y-axes, when compared to the diagonals.
A circle has the lowest perimeter-to-area ratio but cannot form a continuous grid without holes. Hexagons are the closest shape to a circle that can still form a grid without gaps. This property, known as circularity, allows it to represent continuous distributions (curves) in the patterns of your data more naturally than square grids.
Hexagons have a mathematically consistent model for proximity between the centroid of a hexagon and all its connected neighbors. Hexagons are more similar to a circle than other polygons, so any point within the hexagon is closer to the centroid of the hexagon polygon than any point outside of it. This is not true for squares, where points near the border and on the diagonals are further away from the centroid than those on the major axes. This is especially true of points near the vertices where four squares join, as shown in the images below.

Overall, this means that any point inside a hexagon is closer to the centroid of the hexagon than any given point in an equal-area square or triangle would be.
What are hexagon resolutions?
All tessellated grids are created by defining the area of the shape, the length of the edges, or the radius of the shape from the centroid to the nearest edge. The resolution is notation for how the grid is formed.
Most rectangular or fishnet grids use the area or the length of two edges. For example, a 1km square grid would be 1km2 in area and have 1km-long sides. A square grid with 10km2 area would have sides of 3.162 km, so is usually referred to as a 10km grid, as this is easier to understand and communicate. Different grids will use either total area or the length of the edge.

The H3 hexagon system simplifies this by using a concept called resolution, which specifies the average area and edge length for each of the 16 scales of hexagons. This means that when an H3 hexagon is referred to by resolution number, you can always determine the area, edge length, and apothem (distance from the centroid to the closest edge).
Business Analyst Web App uses the apothem, which is also the radius of an inscribed circle within the hexagon, as an easy description for each of the resolutions. So an H3 hexagon at resolution 2 with a radius of approximately 98.2 miles, will be labeled that way.
To make it easier to communicate size, Business Analyst Web App uses both imperial and metric units to express area and radius. The units used are those set in your application preferences.
What hexagon resolutions are supported in ArcGIS?
ArcGIS Pro and Business Analyst Pro allow you to create user-defined hexagons and grids at any resolution. Both products support all 16 H3 hexagon resolutions, through the Generate Tessellation tool (ArcGIS Pro) and the Generate Grids and Hexagons tool (Business Analyst Pro).
Business Analyst Web App provides data in six H3 hexagon resolutions, starting at resolution 2 (average radius of 98.2 miles) through resolution 7 (a 0.8-mile radius).
I don’t understand the differences in the resolution size.
Can you provide a comparable and understandable size chart?
| Resolution | Average hexagon area | Average radius (apothem) | ||
|---|---|---|---|---|
| 2 | 86,801.8 km2 | 33,514.4 miles2 | 158.1 km | 98.2 miles |
| 3 | 12,393.4 km2 | 4,785.1 miles2 | 59.7 km | 37.1 miles |
| 4 | 1,770.3 km2 | 683.5 miles2 | 22.6 km | 14.0 miles |
| 5 | 252.9 km2 | 97.6 miles2 | 8.5 km | 5.3 miles |
| 6 | 36.1 km2 | 13.9 miles2 | 3.2 km | 2.0 miles |
| 7 | 5.2 km2 | 2.0 miles2 | 1.2 km | 0.8 miles |
Are hexbins and hexagons different? I see them used interchangeably and it’s confusing.
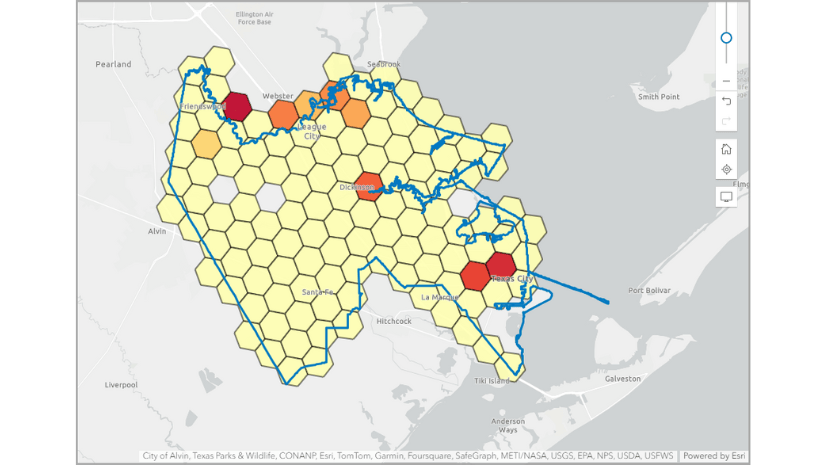
A hexbin uses the hexagon shape to summarize or apportion the underlying data and transform it into the hexagonal geography. The process of summarizing or apportioning is known as binning.
While the two terms are frequently used interchangeably to describe hexagons that contain mappable data, a hexbin is technically a hexagon that has been created or enhanced with some type of attribute data.
What is a hexagonal cell ID?
An H3 hexagon in Business Analyst Web App uses the H3 Index name, which is a 15-character (64-bit) hexadecimal string, like ‘8928308280fffff’. Each string is unique and refers to both the hexagon cell (polygon) and centroid for that hexagon.
The H3 Index can be read from left to right to understand the resolution of any cell, but it’s not very human-friendly. To improve readability and understanding, Business Analyst Web App provides a Cell ID pane that communicates the H3 hexagon resolution, H3 Index, and familiar geographic areas like ZIP Code, county, and state.
In the examples below, changing between resolutions 5 and 6, clicking on the same location returns different Cell ID panes that contain the H3 Index and geographic identifiers.

What’s the difference between hexagons, transverse hexagons, and H3 hexagons?
Hexagons in ArcGIS refers to a hexagon in which two of the six sides are horizontal. A transverse hexagon is rotated by 90 degrees and has two sides that are vertical. In a hexagon, the longest dimension is the x-axis and in a transverse hexagon it is the y-axis.

When creating hexagons or transverse hexagons in ArcGIS, the area of interest is subdivided by specifying the area of the hexagon, and the bottom left/top right of the area of interest. Different sizes of hexagons will result in different meshing of the hexagon grids at each scale of hexagon because of the way an exact number of whole hexagons are fitted into the area of interest.

The H3 hexagon system uses rotated hexagons with 16 predefined sizes, known as resolutions. None of the sides of an H3 polygon align with the x- or y-axis, but every hexagon cell follows the same alignment and rotation across all resolutions, so that the lattice is consistent across all scales.
Each finer resolution has hexagon cells with one-seventh the area of the coarser resolution. Due to the nature of hexagons, it is not possible to perfectly subdivide a single hexagon into seven smaller hexagons, so the finer hexagons are not wholly contained within a parent hexagon. However, the parent hexagon and each of the six external enclosed hexagons share a common vertex, which means that three of the hexagons in the smaller resolution join at a vertex in the larger resolution hexagon, as shown at left. (Diagram courtesy of Uber: https://www.uber.com/blog/h3/, Figure 8.)
What sort of hexagons does Business Analyst use?
As discussed above, H3 hexagons are common to Business Analyst Pro and Business Analyst Web App. Business Analyst Web App supports resolutions 2 to 7, while Business Analyst Pro supports all 16 resolutions. Any H3 hexagon map can be shared between Business Analyst Pro and Web App, and much of the functionality can be used in each of the products, independent of where the H3 hexagons were created or shared.
A Business Analyst Pro user can also create their own grids and hexagons, as described above. You can use Business Analyst Pro to create an empty hexagon lattice (H3, hexagon, or transverse hexagon) and/or use GeoEnrichment to populate the lattice with attributes from Esri’s demographics or your own statistical datasets. Hexagon lattices built in Business Analyst Pro can be used in Business Analyst Web App workflows—color-coded maps, smart map search, and suitability analysis—by adding them to a project under the Create maps and Run analysis menus.
What countries are hexagons available for?
H3 hexagons were introduced for the United States of America in February 2024. All 15,000+ demographic variables are available. Other regions and countries will be added as we advance the capabilities of Business Analyst Web App and our data coverage.


Article Discussion: