ArcGIS StoryMaps helps you tell remarkable stories with custom maps that inform and inspire. A story can effect change, influence opinion, and create awareness—and maps are an integral part of storytelling. ArcGIS StoryMaps can give your narrative a stronger sense of place, illustrate spatial relationships, and add visual appeal and credibility to your ideas.
We update ArcGIS StoryMaps regularly with new features and capabilities. Read on to learn about what’s been added this month…
- Support for new layer effects
- Time widget (beta)
- Pin legend open
- Show more places in map tour
- Map tour basemaps can use any projection
- Updated experience for adding media
Support for new layer effects
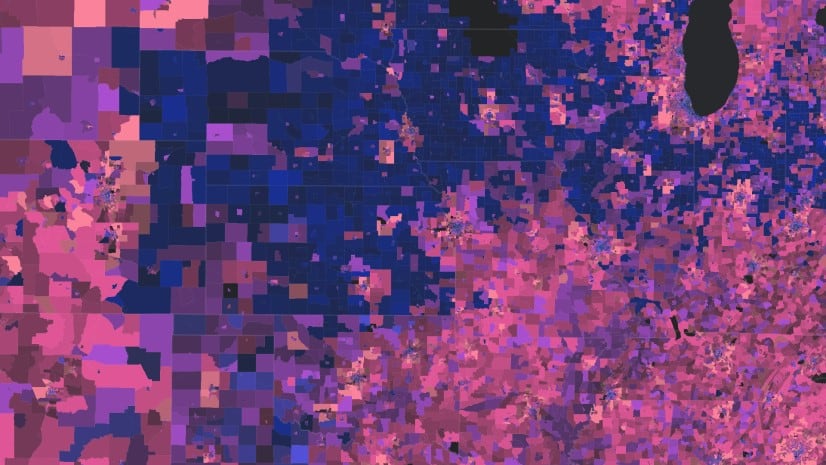
Yesterday’s ArcGIS Online update included some amazing new layer effects that take your maps to the next level and beyond. Today’s update to ArcGIS StoryMaps includes support for these effects. Any maps you create that include drop shadows, blooms, blur, or any of the other slick effects can be used in your stories. Here’s a story with a map that uses the new bloom effect to soften the edges of wildlife habitat ranges.

For more info on using layer effects to add some pizazz to your cartographic adventures, see Effects in Map Viewer.
Animate time-enabled maps with the time widget
An interactive map that shows changes over time can be a powerful storytelling tool. As part of this month’s updates, you can now provide readers with a simple way to experience time-enabled web maps.
If a map contains time-enabled layers, the new time widget (beta) will appear. This widget reads the time settings from the web map and enables readers to play and pause the map’s time animation. When the animation reaches the end, a reset button replaces the play/pause controls so readers can replay the animation if they like. If you don’t want the time widget to appear for your time-enabled map, simply switch it off in the map designer options panel.
The time widget is in beta and provides a very simple experience for readers to play and pause the map animation. If it’s not working the way you’d like or expect for your map, drop us a note on the Esri Community to let us know.
If you’re looking to give readers more control and allow them to freely explore your map’s temporal data, we’d recommend that you embed an ArcGIS app with time features into your story. The new Slider Instant App (currently in beta) or the Media Map app with a time slider are great choices for this. Learn more about these in What’s New in Instant Apps (September 2021) (esri.com) and Display time-enabled data in Media Map.
For more ways to incorporate time in your stories see Showing Time in Story Maps.
Pin legend open
Whenever I think of legends, I immediately think of this classic, hamster-filled John Nelson story. It shares several creative ways you can provide the information readers need to understand a map without using a legend. Just like there is a time and a place for hamsters, there are also times when a concise, standard legend is just what you need. And now you can ensure everyone notices your map’s legend by pinning it open.
In the map options, there’s a new toggle to Keep legend open that you can use when you want readers to see the legend as soon as they encounter a map.
Check out the video below to see how this works.
Show more places in map tour
Last year, ArcGIS StoryMaps gained the ability to create a map tour from a feature service containing survey results or field observations (we call these “data-driven tours”). Since these data layers can contain lots of places, some of you have asked to show even more places in a map tour. While initially 100 places are still shown when you create a data-driven tour, there are now two new options to show 150 or 200 places.

We made another small change to help tours look their best. When you create a data-driven map tour, it will now use the explorer tour grid layout with the widest panel size (50% panel / 50% map). These configuration options are optimal for tours with many places since they minimize scrolling for readers. You can always change to one of the other guided or explorer tour layouts if you have a smaller number of places. However, we strongly recommend using the grid layout for any tour with more than about 20 places and one of the wider panel sizes anytime you have more than about 40 places.
For tips on how to collect and share crowdsourced information see Crowdsourcing for digital storytelling.
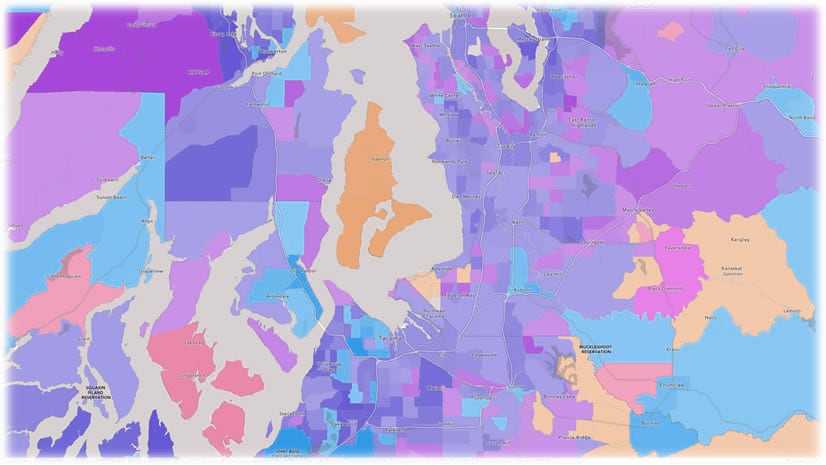
Map tour basemaps can use any projection
Many state and local governments publish custom basemaps using their own cartographic style and these also often use a local map projection. Until today, authors were limited to using only web mercator basemaps in their map tours. Now, when creating a new map tour, you swap out the basemap for any of your own basemaps in any projection you like. This also means you can use other projections like the Robinson projection for global tours, like the one of the most populous cities shown below.

This new feature applies to both guided tours and explorer tours. For more about map tour, see our tutorials for creating guided and explorer tours.
Updated experience for adding media
While working on your next story, you’ll likely notice the newly refreshed interface for adding images, videos, or audio. The new layout has a sidebar where you can choose how you want to add media.
Currently, the same options you’ve had in the past are available: you can upload media files from your computer and store them with the story and paste in links to media on the web.

This change doesn’t bring any new functionality…yet. However, it does lay the groundwork for some new capabilities we’re planning. So stay tuned for more on this in future updates!
And more…
See the release notes for a complete list of updates and fixes in every update.
Thanks to StoryMaps editorial team member Will Hackney for his contributions to this post.


Article Discussion: