Using time animation in web apps helps app authors showcase changes in their data over time. The Media Map configurable app includes an option to enable the time slider, which can be configured to show data cumulatively over time or in intervals within a set period of time.
Example
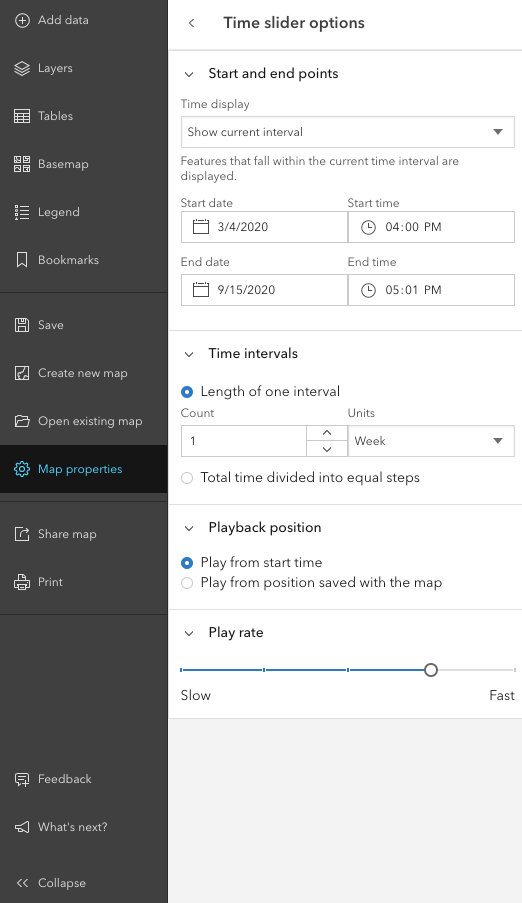
Let’s say state officials in South Carolina want to have an application that they can use as a tool to show COVID-19 cases over time by county. The app will need to show time intervals of one week and clearly display county boundaries. The GIS officials for the state have decided that the Media Map configurable app can provide these features. The map that is created to use in Media Map will use these settings created in Map Viewer Beta:
- One-week time intervals
- Play from start time
- Show current interval
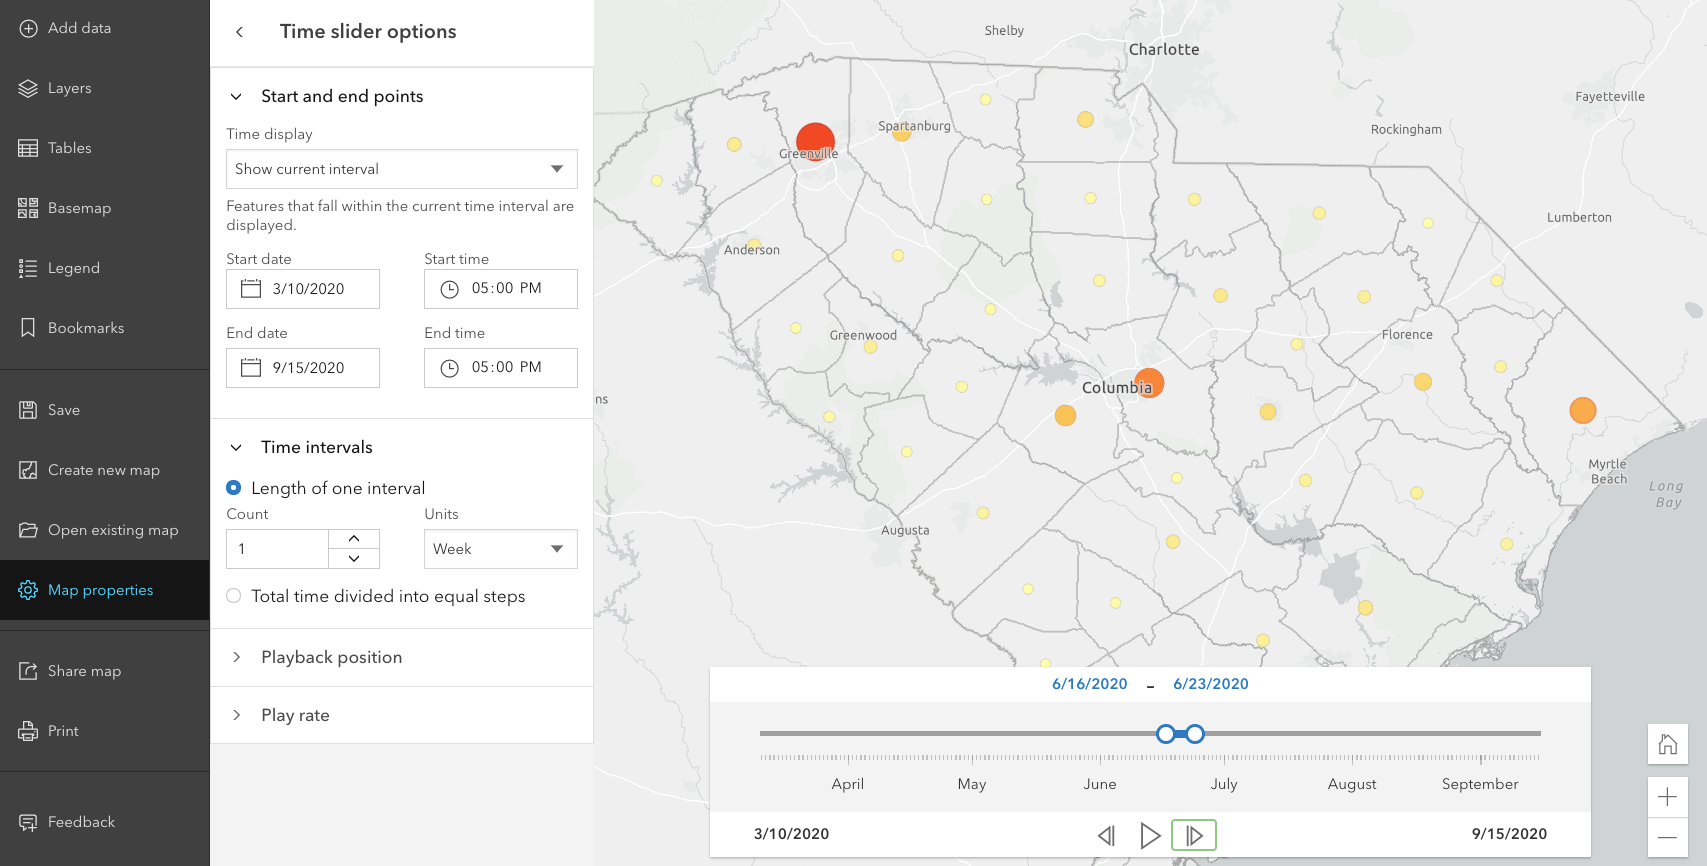
Once the map is set up with time and the county boundaries are defined, it is ready to be used in Media Map. Here are the time slider settings that were decided on:
- Play time animation in loop
- Expand time when app loads
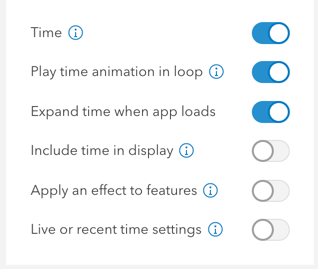
Here are the other settings that were added in the final app:
- Home: Return to the map’s default extent.
- Zoom buttons: Use the buttons to zoom in and out on the map.
- Share: Create URL links to the application or share directly using Facebook, Twitter, LinkedIn, or email.
- Horizontal Legend: Identify the counts and amounts of COVID-19 cases per county.
- Bookmarks: Have set locations that app users can quickly access without having to pan or zoom; these locations were configured in the map.
- Define Visible Map Extent: Set an exact extent that contains app users to an area of focus on the map.
COVID-19 Cases by County in South Carolina
Setting up a time-enabled map
The first thing that needs to be done in order to use the time slider is to confirm that the data is time enabled; this setting is on the item details page of the layer. Once the data is time enabled it is ready to be added to a web map. A web map has a set of time settings, including time span, playback speed, and time intervals, that can be configured in classic Map Viewer or in Map Viewer . Maps created with either Map Viewer will be compatible with the time slider in the Media Map template. Once the web map time settings are configured, the map is ready for assembly with the Media Map time slider.
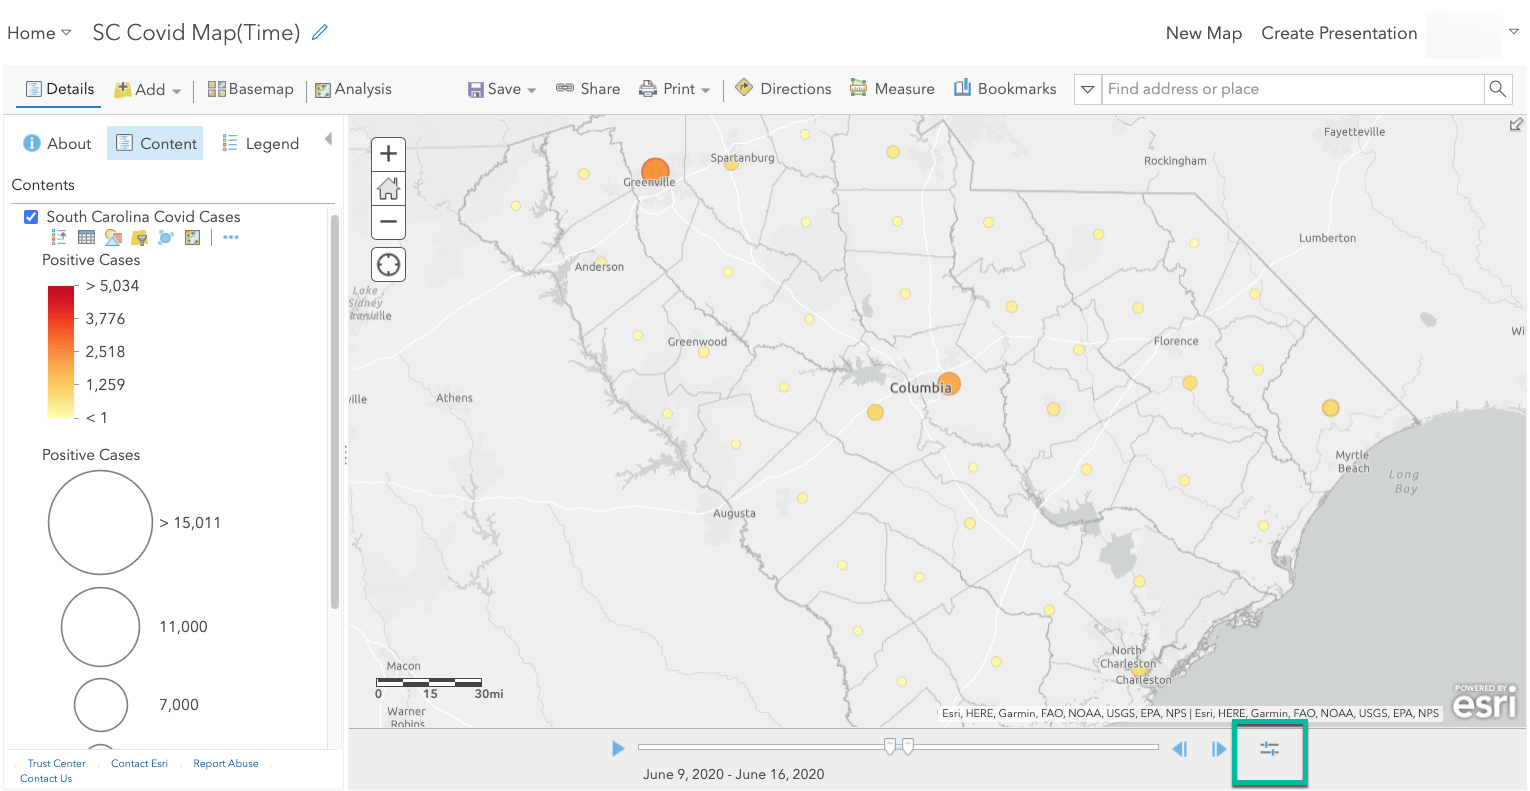
Accessing the time slider in Media Map
In the September 2020 release of ArcGIS Online, the Media Map configurable app will be included in the list of applications that use the new configuration experience. The new configuration experience includes Express Setup, which highlights the most essential settings to consider, and Full Setup, which provides access to all the settings supported by the app. The time slider in Media Map is located in Full Setup under the Interactivity section.
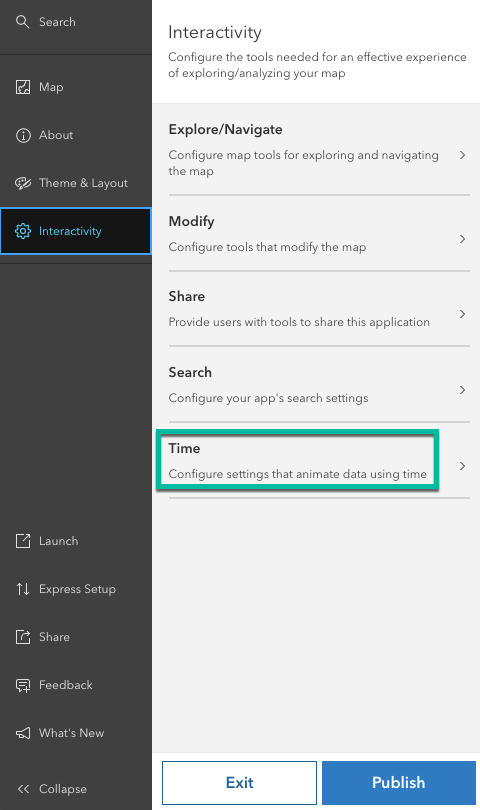
Time slider settings
To get started with the time slider and the settings associated with it, the Time setting will need to be enabled. When the Time setting is enabled, a set of options will appear. These options consist of the following:
- Play time animation in loop: The time will continuously play in a loop even after reaching the end of the time period.
- Expand time when app loads: The time slider will launch when the application loads.
- Include time in display: The time slider will show the time stamps along with the dates.
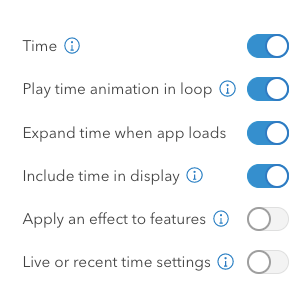
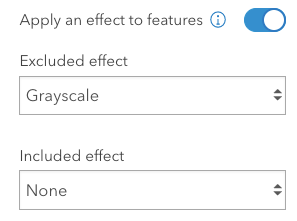
- Apply an effect to features: This option provides the ability to apply effects to features that are included in the time extent as well as to features not included in the time extent. For example, you have a map of car accidents occurring in a county that are displayed using weekly intervals for the last year. You want the car accidents on the map that are not in the active weekly interval to be dimmed. The Excluded effect setting would then be set to be Grayscale.
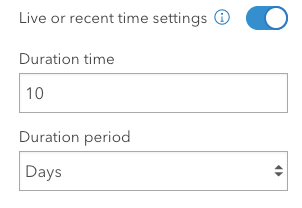
- Live or recent time settings: This option allows the data to be shown for a specified time duration and makes it possible to overwrite web map time settings. The duration options include time and period. For example, you may have a map showing road closures that are updated daily, and you want to see the data display consecutively for the next 10 days. The time slider in the app would show from the start time of the current day and the end time of 10 days from then. The configuration is Duration time = 10 and Duration period = Days.

Article Discussion: