Thousands of Data Variables Available with ArcGIS for Desktop Tool
Community Analyst Integrated with ArcGIS Desktop
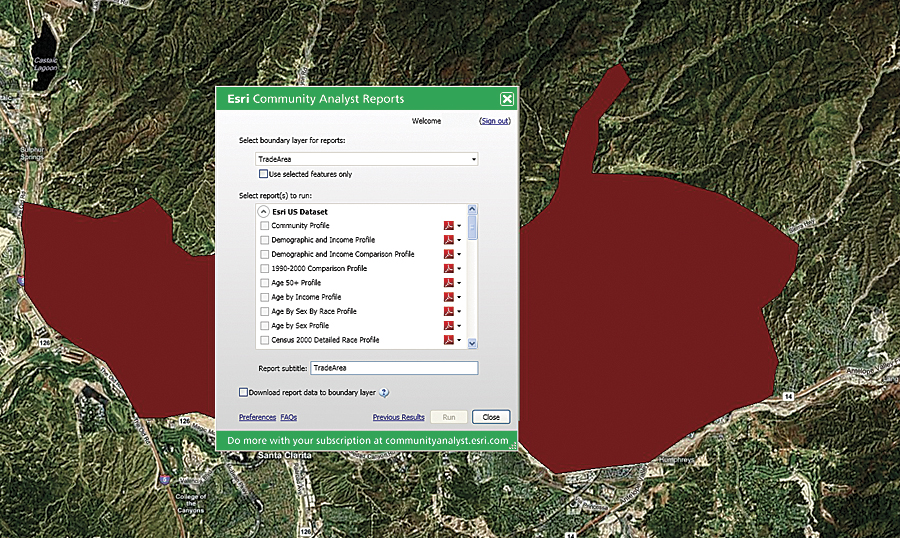
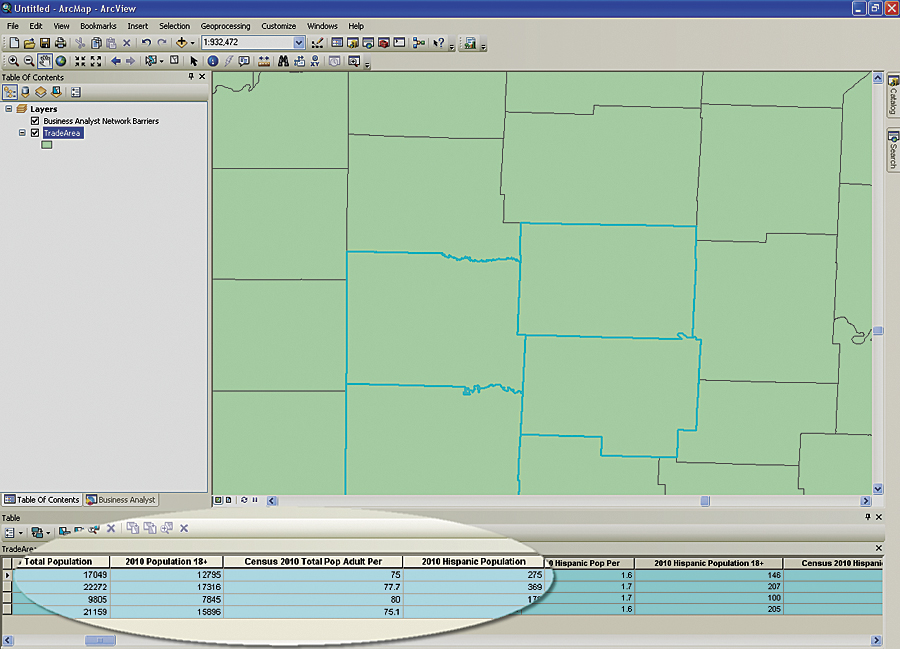
Above and below: Emergency responders can get a quick idea of how many people live in an evacuation area by running summary reports with the Community Analyst Add-in.
ArcGIS users can now quickly and easily add US data and reports to their GIS projects with the Community Analyst Add-in. The downloadable add-in connects ArcGIS for Desktop with the latest demographic, economic, supply and demand, health, business, and education data from Esri Community Analyst. A Software as a Service (SaaS) mapping solution, Community Analyst allows users to explore the unique characteristics that make up their communities and is completely hosted in the cloud by Esri.
GIS professionals can seamlessly leverage the data in Community Analyst to generate detailed reports for areas they have defined on their desktops. They can attach this data as attributes for use in their everyday ArcGIS mapping workflows. In addition, add-in users have access to the Community Analyst web application (communityanalyst.esri.com), where they can find areas that meet up to five customizable variables using the Smart Map Search tool, compare multiple sites, and create customized reports.
Cities and counties are using the single-age and one-year data categories in Community Analyst to better understand and address the needs of an aging population. Combining age data with Esri's Tapestry Segmentation data, which classifies neighborhoods into market segments, helps users understand the diversity and makeup of a community and describes lifestyle and lifestage information. This helps identify trends and allows users to better understand their constituents to supply them with the correct products and services and communicate with them through the most effective channels.
Health care professionals can easily track disease incidents using ArcGIS, and by adding demographic data from Community Analyst, they can now determine if the outbreak is related to age, ethnicity, income, or other demographic factors. The GIS analyst simply downloads and appends data to features in ArcGIS to generate reports and thematic maps to better visualize the situation, and officials can determine where to place services to best meet the needs of these groups.
The add-in provides desktop users with a straightforward and cost-efficient way to incorporate the latest data into their applications. As Esri's annual data updates are available in Community Analyst before being released in any other Esri desktop solutions, ArcGIS for Desktop users will always have access to the most current data for their GIS projects.
The Community Analyst Add-in is available as a free 14-day trial download. ArcGIS for Desktop users will then need to purchase a subscription to continue accessing the reports and data.
For more information and to download the Community Analyst Add-in, visit esri.com/caaddin.