Electric Utility's Dynamic Duo—SCADA and GIS
iPhone Application Mitigates Blackouts Due to Overhead Lines Affected by Strong Storms or Freezing Rain
Highlights
- An iPhone application uses GIS to check out-of-service stations and the number of affected customers.
- The GIS department displays SCADA information directly on a map.
- Changes in the network are propagated from the GIS to the SCADA system as a full update.
Known for medieval castles, snowcapped mountains, and world-famous beer gardens, the southeast German state of Bavaria aims to blend traditional with modern. Bavaria is home to Munich and is the largest German state by area and second most populous, with more than 12 million inhabitants and a steady stream of tourists.
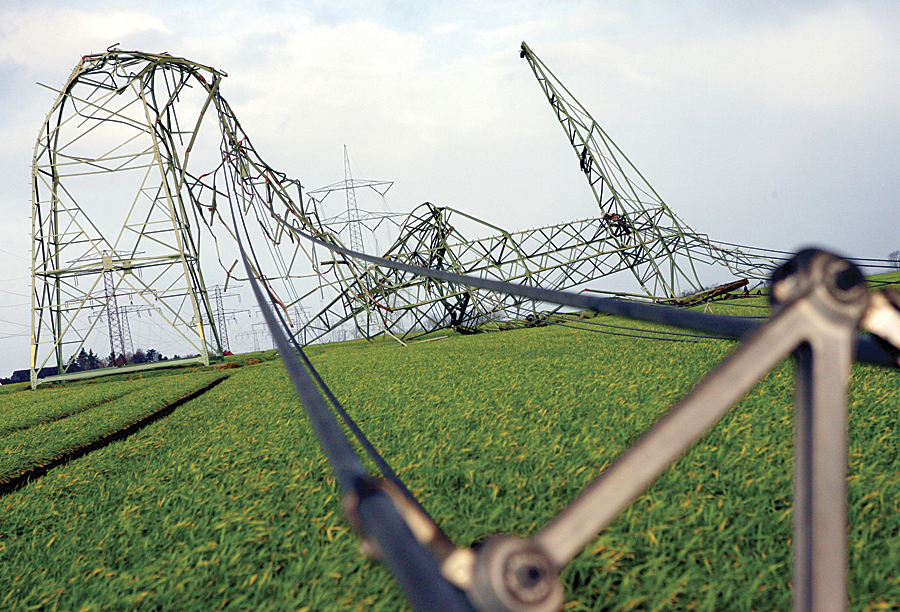
Lechwerke's overhead lines are vulnerable to natural hazards, such as strong storms or freezing rain, that have the potential to result in blackouts for customers.
Electric power is provided to part of this popular and well-populated region by Lechwerke, a Germany-based electric utility company. Lechwerke distributes electricity through low-, medium-, and high-voltage grids; generates electricity through 35 hydroelectric power stations; and is engaged in electricity trading, electricity and gas sales, and energy efficiency services.
Management at Lechwerke ensures reliable service by using an iPhone application to check out-of-service stations and the number of affected customers. The application is made possible by excellent data quality, a well-defined and stable data model, and a tight integration of GIS and the company's supervisory control and data acquisition (SCADA) information system.
The GIS department of Lechwerke has ambitious visions and a focused long-term plan that emphasizes data quality and system integration. Lechwerke's overhead lines are more vulnerable to natural hazards, such as strong storms or freezing rain, that have the potential to result in blackouts for customers. In these types of crisis situations, Lechwerke management works to curtail the impact on customers by minimizing the outage duration and number of customers affected.
Traditionally, management would request information about the degree of the crisis in the SCADA control center—the only place where all information came together. But the staff in the control center in a crisis situation is extremely busy attending to calls from the field and working to restore electricity to customers.
Staff in the GIS department decided it would be prudent to take the information provided by SCADA and display it directly on an ArcGIS software-based map, accessible via the iPhone application. For its documentation, the company uses the ArcFM UT product line, a solution developed by Esri Partner AED-SICAD (Bonn, Germany) using ArcGIS technology from Esri. Whenever there is a change in the network, the change is propagated from the GIS to the SCADA as a full update. Updates take roughly 40 minutes. A visual control is done before making the change live.
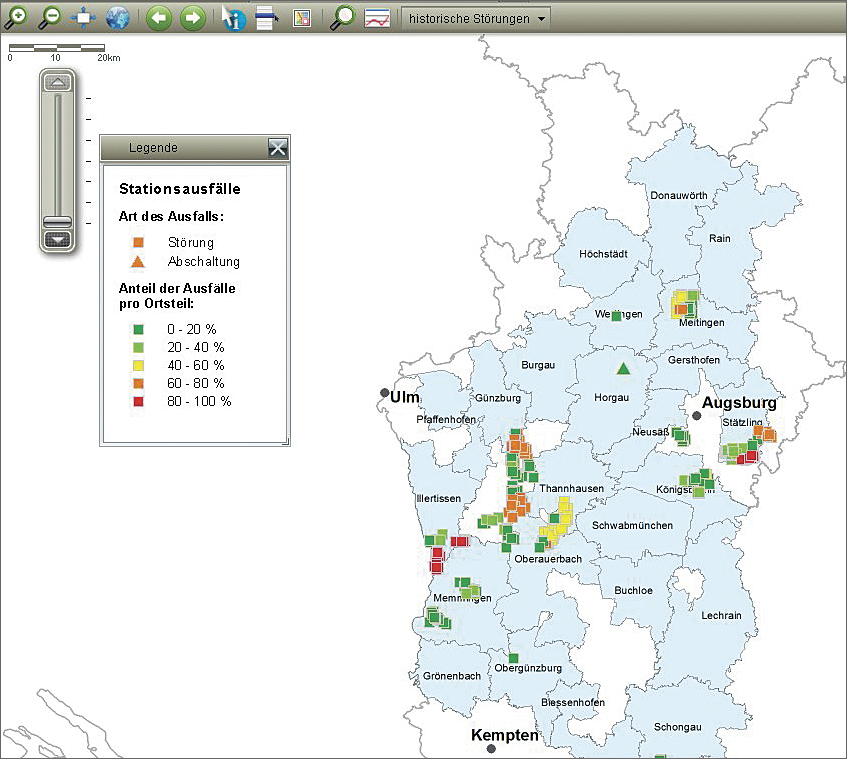
Lechwerke lessens the impact of natural hazards, minimizing the outage duration and number of customers affected. Here is a station outage situation on May 26, 2009, at 1815.
This process brought several key advantages. Data must be entered in only one system. Errors in the old schema plan of the control center were detected. And all assets have the same unique ID in the GIS and the SCADA.
Having in mind that the stations in the SCADA and the GIS "know" each other, it was not a big step to use the same robust ASCII interface of the SCADA to send an ASCII file containing the status messages from the SCADA to the GIS every three minutes. Via SQL, this list was filtered and aggregated to obtain one SQL record containing only key information per outage. This record is then written to an Esri feature class and displayed in a small application.
Through a visual web interface, the end user (in a crisis situation, this would be the company CEO) can select a certain theme, such as outages, and receive an overview of the distribution area. All out-of-service stations are displayed in colors ranging from green to red depending on the percentage of the affected district or city. Key attribute information is also available from the map view. Once data is in the GIS, it can be accessed using the iPhone application.
This web solution was implemented by AED-SICAD subsidiary and Esri Partner BARAL Geohaus-Consulting AG (Reutlingen, Germany). It used ArcGIS for Server together with the brand-new ArcFM UT Server V10 JavaScript client, caching all basemap data, only providing out-of-service stations and the geoschematic layer as dynamic layers. Basemap data is displayed instantaneously, and the dynamic layers are visible after an approximate five-second delay.
"If you want to bring new apps to your end users, they must be better than the old ones," says Martin Thoma, GIS manager at Lechwerke. "Here, we have brought completely new information content paired with greatly improved performance through the latest ArcGIS technology. Thus, we could achieve end-user acceptance of this new technology."
Thoma is convinced that SCADA and GIS will continue to grow together in the near future. He sees this type of integration as the productive basis for implementing lightweight and rapidly developed web interfaces, which bring users exactly the content and functionality they need for a certain task. But Thoma stresses the fact that the fundamentals must be there: the good, stable, and well-known UT data model; excellent data quality; and the combined know-how of IT and utility business processes.
For more information, contact Martin Thoma, Lechwerke (e-mail: martin.thoma@lew.de), or Peter Gr�ninger, BARAL Geohaus-Consulting AG (e-mail: peter.grueninger@baral-geohaus.de).