Three-Dimensional Spatial Analytics and Modeling Is Now SOP for the City of Forth Worth, Texas
By Havan Surat, GISP
Highlights
- The City of Fort Worth depends on ArcGIS for presenting difficult information to the public in a very easy format.
- ArcGIS 3D Analyst for Desktop helps produce three-dimensional city zoning maps.
- Three-dimensional transparency maps are useful for estimating comparisons between current and allowable building heights.
Fort Worth is the second-largest city in the Dallas-Fort Worth metro area in the United States of America. Located in the state of Texas, Fort Worth's population is comparable to other cities in the state, such as Austin, Houston, and Dallas. Since 2000, Fort Worth has been the fastest-growing city with a population of more than 500,000 people in the nation. According to the US Census Bureau, its population increased by more than 200,000 people during the last decade.
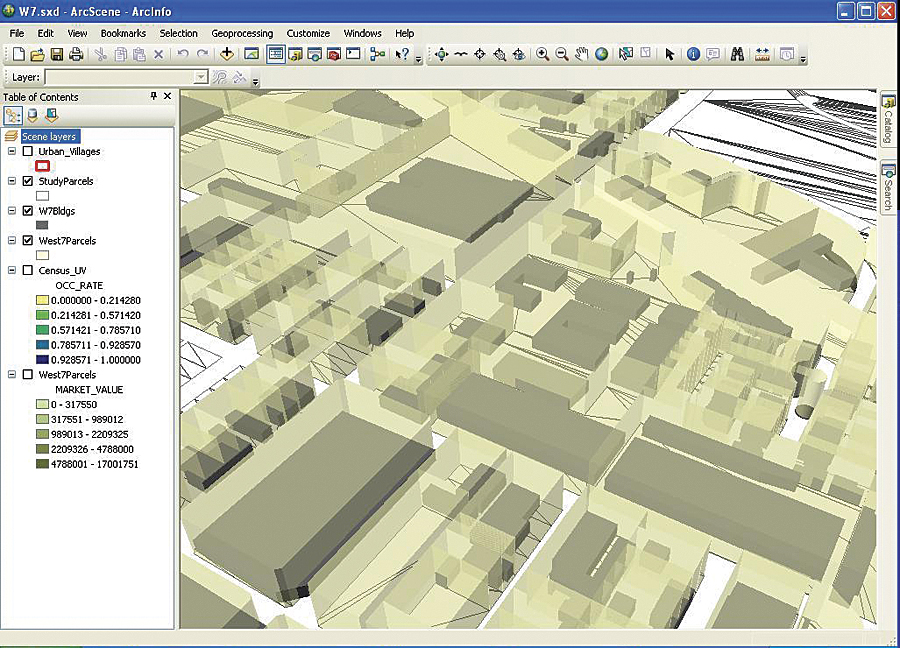
A three-dimensional transparency study in the downtown area shows the difference between existing and allowable building heights in the City of Fort Worth, Texas.
Fort Worth has a rich history of planning. The Planning and Development Department received credits for innovative planning area studies from the national American Planning Association. The department consists of two divisions: Planning and Development. The Planning division is further divided into sections based on current and long-range planning activities in the city. The Urban Design team in the comprehensive planning section primarily focuses on the urban design-related activities in the planning areas along with the production of graphic illustration and three-dimensional visual studies.
The city has created 16 urban villages and a few urban design districts within the city of Fort Worth. The city anticipates mixed-use development patterns and walkable environments in these areas with emphasis on pedestrian-oriented approaches and buildings related to human scale. To make the city's efforts understandable to the public and developers, the Urban Design team has been asked to produce three-dimensional building models that resemble the desired developmental patterns in the prominent areas of the city.
Another request for the development of 3D models came from the zoning section team, which was finding it difficult to explain the city zoning codes to the public. It felt that the development of building 3D models that explain the codes and regulations could assist the public to interpret the content of the zoning codes. As the mixed-use zoning codes in the city have been revised recently, the city is looking to prepare a new brochure for the mixed-use zoning district that consists of 3D graphics to illustrate the content of the codes.
The city has ArcGIS users in all departments using GIS for multiple mapping tasks. The Urban Design team has found, in particular, that ArcGIS 3D Analyst for Desktop is the perfect tool for creating both 3D building models and performing three-dimensional analysis with one or more feature datasets.
Three-Dimensional Analytic Maps
In addition to building 3D models, 3D tools have been utilized to produce a variety of three-dimensional analytic maps. One analysis represents the gradual variation of the population density in the vertical direction, with the assistance of 3D tools, for better illustration purposes in planning documents. Another study produces the three-dimensional zoning maps that replace the traditional zoning maps. Traditional city zoning maps are usually represented with specific colors depicting appropriate use allowed in the zoning districts. When existing building models have been shaded with the city zoning color symbology, the final 3D maps would add building height information to the zoning content. The Urban Design team has seen the potential of presenting the 3D information to reveal the existing development patterns, in addition to the future development proposals, to the developers, consultants, and the public.
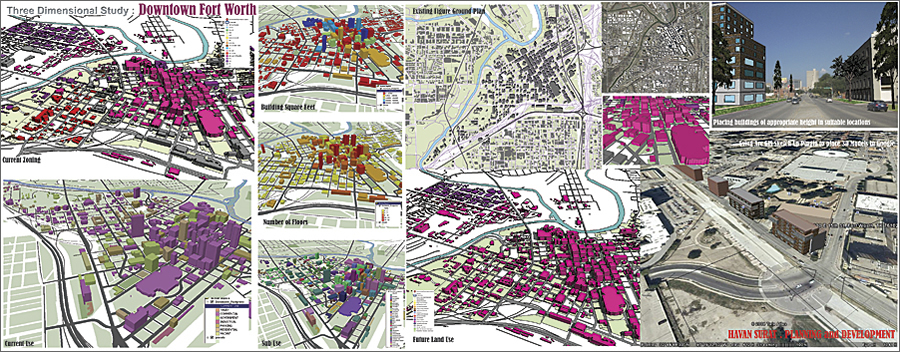
The building models in the downtown area have been studies in terms of current zoning, future and current land use, building square feet, and number of floors.
The three-dimensional transparency study is another product generated with the aid of 3D tools. This study is useful, as it provides a medium to interpret the current development patterns with the future possibilities in the downtown area. The City of Fort Worth supports mixed-use codes and regulations in the denser areas where the developer can build to a higher number of building stories by following mixed-use codes when compared to proposing a single use in a building. If the building has a mix of uses within it, then the building can be taller. In other words, a mixed-use building can be taller than the single-use building. The idea of strengthening mixed-use buildings is depicted in the three-dimensional transparency map.
First, the outer parcel is extruded to the maximum building height allowed in the mixed-use zoning code, and then the existing building footprint is pushed to the actual existing building height. The parcel 3D model is set to transparency so that the inside building model is visible. This study reveals to the viewer the difference in heights between the building and parcel models and hints that the building can still rise taller by following the city zoning codes and regulations.
Generally, spatial analytic patterns are displayed two-dimensionally, but if presented in a three-dimensional format, the analysis could be more readable for the public. The city incorporated these maps in zoning code brochures and planning documents. The City of Fort Worth depends on ArcGIS for presenting difficult information to the public in a very easy format with the assistance of ArcGIS extensions.
About the Author
Havan Surat is a former planner on the Urban Design team in the comprehensive planning section in the Planning and Development Department with the City of Fort Worth. He holds dual master's degrees in urban planning and urban design from the University of Texas, Arlington, and University of Texas, Austin, respectively.
For more information, contact Greg Webb, GISP, RPLS, GIS Analyst II, City of Fort Worth (e-mail: greg.webb@fortworthtexas.gov).