ArcUser
Fall 2012 Edition
Harnessing the Power of Query Layers
By Alex Zhuk and Wing Tse, ITSI Gilbane Company
This article as a PDF.

Editor's note: Query layers, added at ArcGIS 10, give users direct access to data in a relational database without requiring the contents of that database to be exported into a geodatabase. Query layers use an SQL query. They can be used to display data like any other layer, used as input for a geoprocessing tool, or accessed programmatically using developer APIs. A query layer can be saved as a layer file or used to create a layer package. ITSI Gilbane Company of Walnut Creek, California, which offers environmental management as well as construction, fuels, and energy services, uses GIS to map project site data.
ITSI Gilbane maintains a custom data portal, which is based on a Microsoft SQL Server 2008 R2 database. This portal has an extended interface where users (scientists, engineers, and regulators) can, at any time, find all sorts of information, raw or prepackaged, about a particular site/job. Esri's ArcGIS suite is ideally suited for dealing with thousands or millions of analytical samples taken in soil, air, groundwater, and facilities.
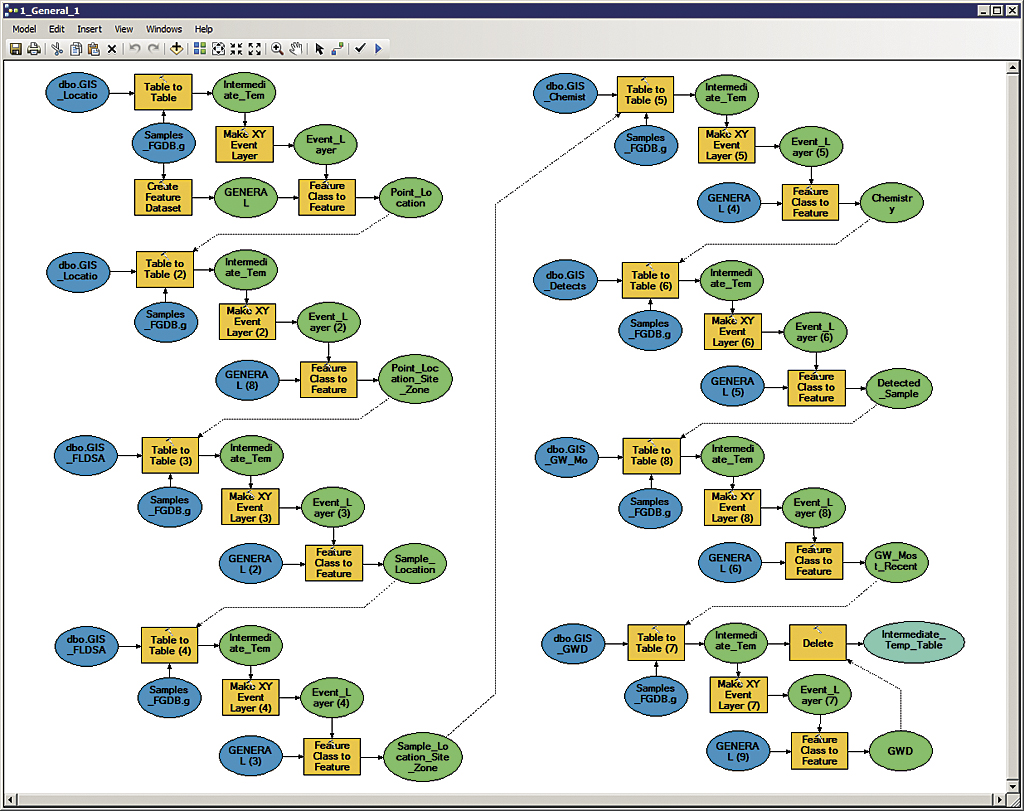
Prior to ArcGIS 10, a typical geoprocessing model was used to import data tables into a file geodatabase in a semiautomated way.
Mapping environmental conditions at project sites uses data stored in the portal's relational database. Most of ITSI Gilbane's database projects are built from a single template. It makes administration easier and uniform and allows for rapid deployment of new projects. This template includes dozens of tables with multiple fields carefully arranged in the most efficient manner.
For years, the firm's GIS users relied on a limited set of GIS-related dynamic composite database views that the administrator had developed specifically for mapping purposes. Tabular data could be brought into maps using Event Layers or Display XY Data or by converting the database views into either geodatabase feature classes or shapefiles. These methods are still widely used, but they had serious drawbacks for ITSI Gilbane. For example, Event Layers are not selectable. Also, converting database views was time-consuming and created a disconnected static dataset.
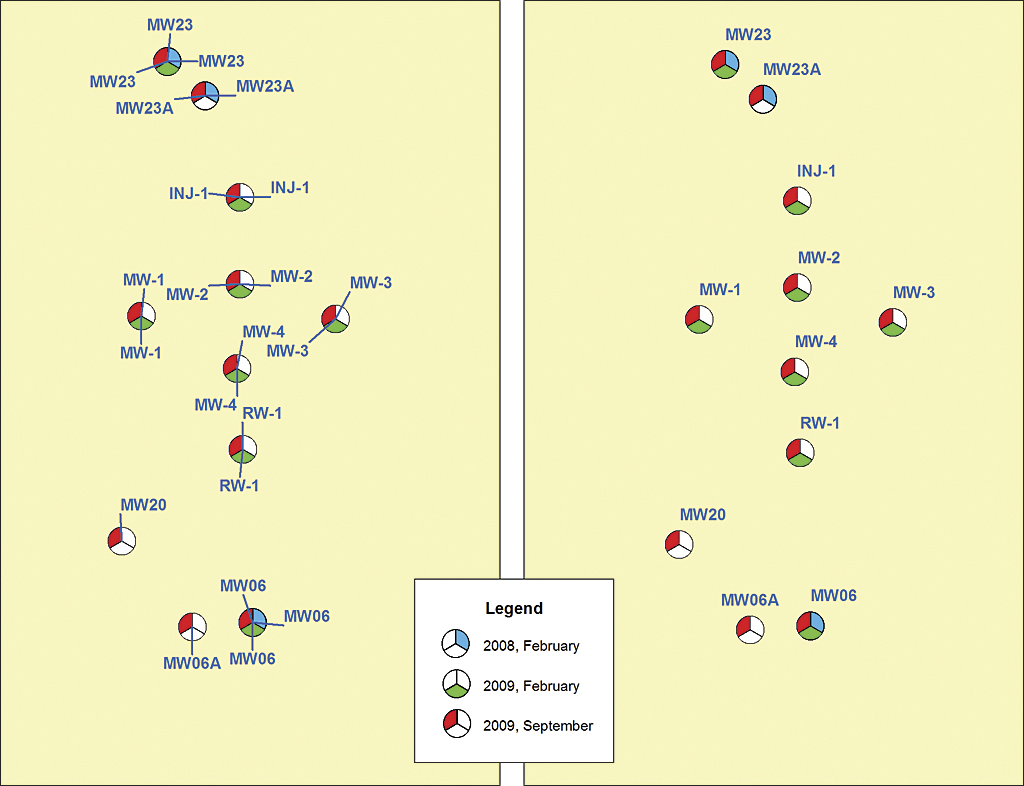
With query layers, the clutter has been reduced, but the map has dynamic labels.
Prior to ArcGIS 10, ITSI Gilbane's GIS group preferred the conversion approach and had developed a set of geoprocessing models for importing data tables in a semiautomated way. Import procedures were initiated manually as needed. The disconnected nature of those geodatabases sometimes caused outdated data to be used unwittingly.
A Workable Solution
Many GIS users yearned for a fundamentally new approach and wanted a full-fledged, direct database-to-GIS mechanism. The Query Layer tool in ArcGIS 10 was the answer.
Although it was a breakthrough from a user's perspective, some sophisticated preparation work was necessary. To geoenable the data in the SQL Server database required adding the Geometry/Geography data type to the database views, creating a unique index field, and adding a spatial index. To add the Geometry/Geography data type, a new column called SHAPE was added to the view. Adding the SHAPE column can be scripted using the database syntax in Listing 1.
geometry::STPointFromText('POINT(' + CAST(ECOORD AS varchar(20))

+ ' ' + cast(NCOORD AS varchar(20)) + ')', 1) AS SHAPE
Listing 1: Adding the SHAPE column to the database view. ECOORD and NCOORD are the field names for x and y in the Location table, one of the base tables that forms the view.
The second task—adding the unique index field (GIS_ID)—turned out to be much trickier. Creating a view from multiple tables is not a difficult task as long as the tables are properly joined using key fields in a script. However, adding a column with a unique number in a view is not easy in SQL Server, especially if the view has been created by using different base tables. The primary key from any base tables—assuming the keys are numeric—cannot be used in the unique number field because it will probably be replicated in the view. After much research, using the ROW_NUMBER function from Transact-SQL was the solution. It allowed a unique number column to be incorporated in a view without requiring a user-defined function. (A detailed description is beyond the scope of this article. See MSDN at msdn.microsoft.com for more information.)
The last task was the addition of a spatial index to boost mapping performance. SQL Server is one of several database systems that supports spatial gridding. Although the code is relatively simple, it took some creativity to apply, especially considering that these indexes (under certain circumstances) must be rebuilt. Listing 2 shows the text used to add the spatial index.
create spatial index MyTABLE_shape on MyTABLE_tbl (shape)

USING GEOMETRY_GRID WITH (BOUNDING_BOX = (Xmin,Ymin,Xmax,Ymax))
Listing 2: Adding the spatial index
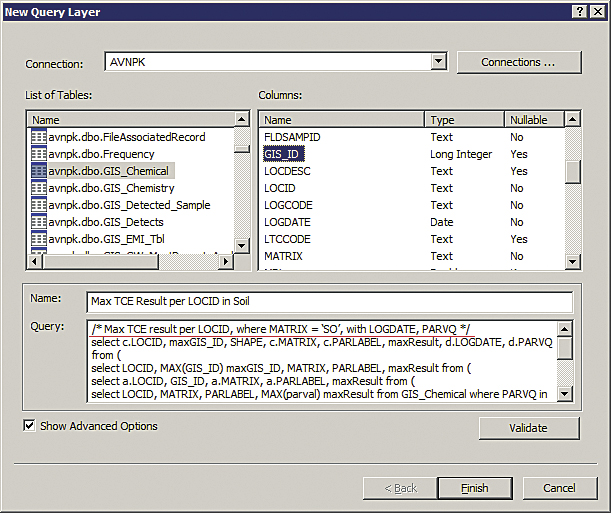
Now a description and complex nested query can be entered in the New Query Layer dialog box.
Occasional performance issues can be easily solved by targeted querying. Instead of calling a table that may consist of hundreds of thousands (or even millions) of records, a user can narrow down to just one specific subset of the entire table. After that, a more refined selection can be displayed using a definition query if needed.
Unfortunately, database views could not be used as a basis precisely because of their dynamic nature. The Query Layer tool can only use real tables. To overcome this problem required that all database views, relevant to GIS, are automatically converted twice a day. Although this sounds as if it contradicts the original objective, it lets GIS users avoid dealing with dozens of tables to get just the limited chunk of data they needed. This was a compromise solution that did not provide real-time access, but owing to hardware and network limitations, it is as close as is currently technically possible. As the company continues improving its IT infrastructure, more frequent updates will become feasible. However, this change has eliminated the manual geodatabase import routine except for individual urgent cases that can be handled by a database administrator.
Results
Because almost all processing happens on the SQL Server database side, rather than the GIS/map side, powerful new possibilities, such as complex nested queries, open up for GIS users. The amount of work needed to get data in a particular format is minimized as is the chance of error. In many cases, the need to resort to using Microsoft Excel or third-party utilities has been eliminated.
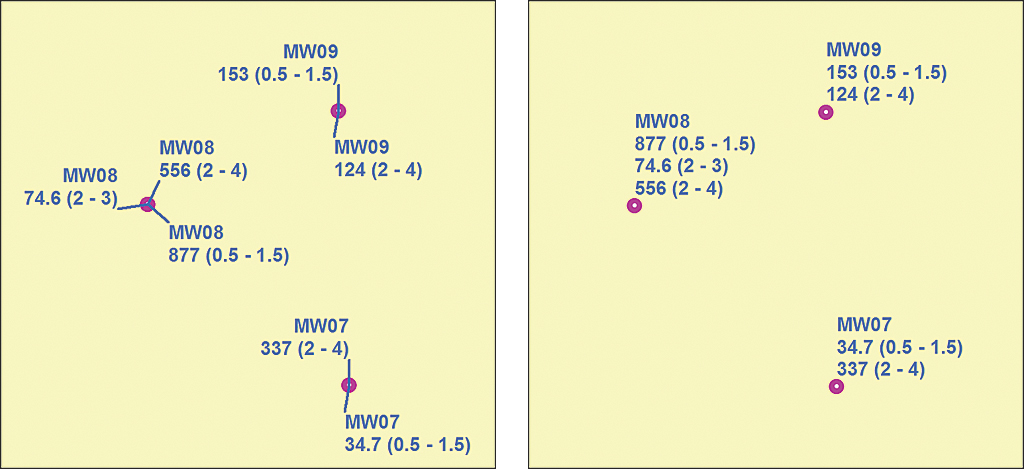
Seven discrete samples/records in one table were combined into three samples/records by conversion of the second table in SQL Server. This operation simplified labels and improved readability. The labels here indicate location IDs, with analytical results and depth ranges in parentheses.
One of the advantages of this protocol, from a GIS analyst's point of view, is the greater reliance on the underlying database. The GIS analyst now can focus more on other aspects of the job rather than making sure that the correct query was put together. That task (or most of it) can be left to the database administrator, who usually is more familiar with the intricacies of the data. Usually this approach produces more accurate results and less blame to go around—something many GIS users can appreciate.
One small (but very nice) benefit is that a user can now enter a coherent query description in a query layer's Properties using proprietary database syntax (which is still not allowed using the standard Definition Query tool). This description can be very useful when dealing with complicated data calls. It is also very gratifying to see a map immediately display the most current point dataset as soon as the underlying database table is updated. All it takes now is just a click of the Refresh button. Another important benefit is that near real-time sampling data for some projects can be accessed not just by GIS professionals using desktop GIS but by a wide pool of users, both inside and outside the company, 24/7 via the online maps.
For more information, contact Alex Zhuk at 925-946-3366 or Wing Tse at 415-882-4518, ext. 108.
About the Authors
Alex Zhuk, MS, has 8 years of experience in mechanical design and architecture and more than 15 years of experience in CAD and GIS for the environmental industry.
Wing Tse, MS, has 25 years of experience in designing, developing, and maintaining database systems for government agencies and private industry. Over 20 years of his database experience are related to environmental work.