ArcWatch: GIS News, Views, and Insights
July 2012
Create Customized Mapping Applications Using Esri's Web Map and Application Templates in ArcGIS Online
Learn about Using the Montgomery Botanical Center Champion Tree Application as an Example
An ArcGIS Online web map and easy-to-configure application template were used to create the Montgomery Botanical Center Champion Trees application using a step-by-step process that was simple, straightforward, and required no programming.
The 120-acre Montgomery Botanical Center in Coral Gables, Florida, is home to a unique collection of palms and cycads from around the world, including the Barbados Silver Palm, the Swollen Silver Thatch Palm, Marlberry, Queen Crepe Myrtle, and Burmese Rosewood. The application, created by Esri to demonstrate how organizations can quickly get an application like this up and running, offers users a way to explore the center virtually. Just click the trees to view pop-ups containing more information such as the scientific and common names of the trees and photographs of each one.
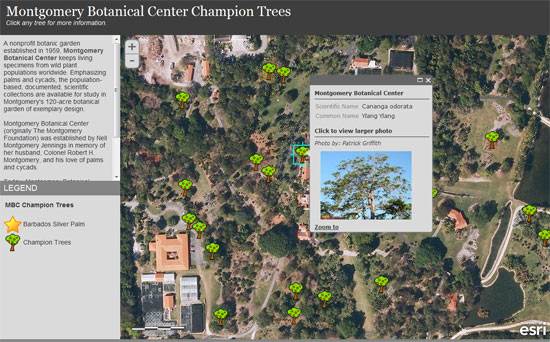
The Web Map Created for the Montgomery Botanical Center
You can create your own application by following the simple steps that were used to create the Montgomery Botanical Center Champion Trees application.
Step 1
Collect and organize your data. First, key data from the Montgomery Botanical Center was obtained from the center's staff members, notably the GPS locations of the champion trees, photographs of each tree with photo credits, and other information such as the tree's scientific and common names. This information was organized in a Microsoft Excel spreadsheet, which was saved as a comma-separated value (CSV) file. This CSV file provided the core information used to place the trees on the map and configure the information pop-ups.
Two versions of photographs were used: one a smaller, resized version for use in the pop-up and another full-size version that could be opened from the pop-up thumbnail. The photos were placed at a web location, and the URL to each was added to the spreadsheet. An earlier blog post provides several tips for displaying the photos in pop-ups.
The crown jewel of the champion tree collection, the Barbados Silver Palm, needed to be highlighted. To uniquely symbolize this tree, another column named ID was added to the CSV with a unique value for this particular tree.
Step 2
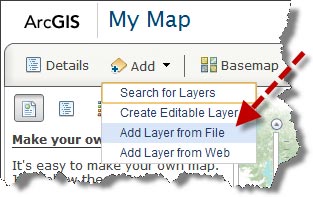
Add data to a new map. After opening a new map in ArcGIS Online, the World Imagery Map was chosen from the map viewer's basemap gallery. Then the CSV file was dragged onto the map. Note that Internet Explorer currently does not support the drag-and-drop feature, so an alternative method in Internet Explorer would be to choose Add, click Add Layer from File, and then browse to the location of the CSV file:
Step 3
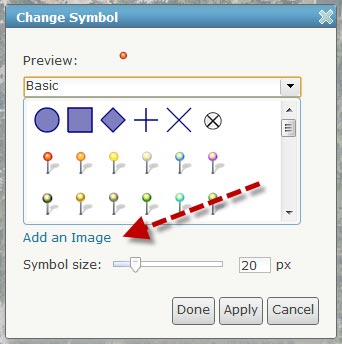
Configure the layer. In this step, the symbols and information pop-up for the trees added in step 2 were configured. Custom symbols were created to represent the Barbados Silver Palm (a star) and the other trees (a generic tree symbol). To make the symbol background transparent, PNG files were used. These were placed in the same web folder as the photographs.
In Contents, Change Symbols was clicked. Unique Symbols was chosen, and the ID field added in step 1 was selected. This enabled the Barbados Silver Palm to be represented uniquely from the other trees. Using Change Symbol, Add an Image was clicked, and the URL was entered to the desired symbol (which was already placed in the web folder).
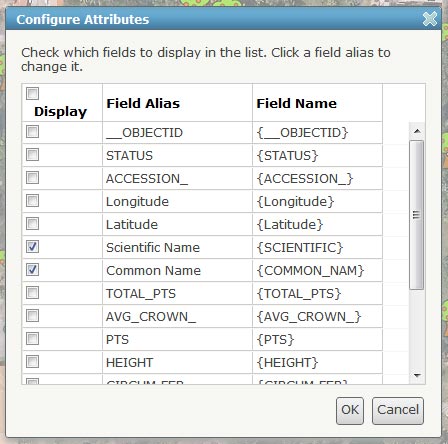
Next, the pop-up was configured to display the desired information. In Contents, Configure Pop-up for the layer was chosen. In Pop-up Properties, a title was entered for the pop-up using the Add Pop-Up Title box. In the Pop-up Contents box, field names were displayed in all caps, so they were adjusted to display in mixed-case, using user-friendly names. Only the desired fields (scientific name, common name) were kept visible.
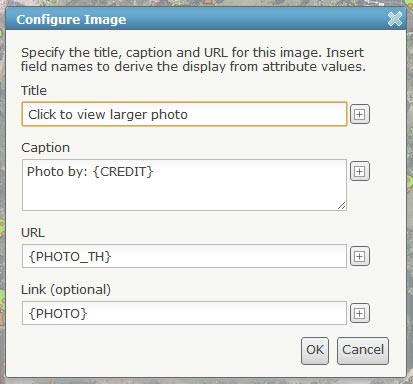
In the Pop-up Media section, an image was added and configured to display a title, credits to the photographer, the thumbnail photo (from the field {PHOTO_TH}), and a link to the larger photograph as shown below:
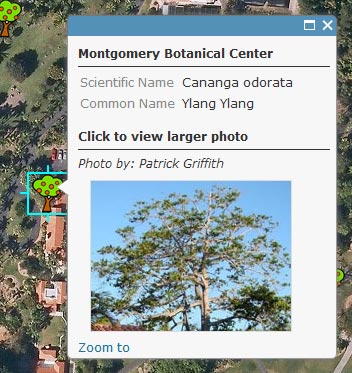
This provided the desired look for the pop-up:
Step 4
Make the custom application. After saving and sharing the web map publicly in ArcGIS Online, a template was selected for publishing the application by clicking Share, and then Make a Web Application. A choice was made from among the story map templates found in the template gallery:
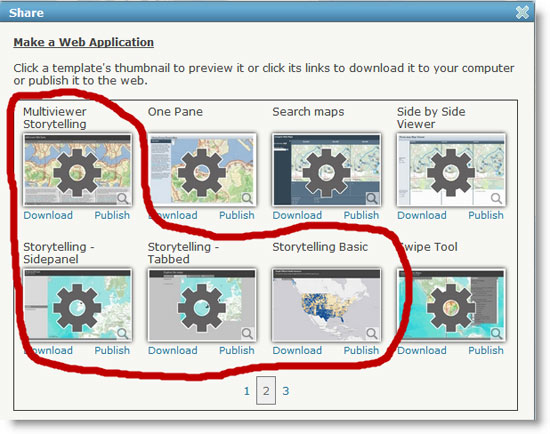
The application could have been hosted from an ArcGIS Online account by choosing Publish and then configuring the application to suit, but since the application needed to be maintained on a server, the choice was made to download the Storytelling - Sidepanel template instead:

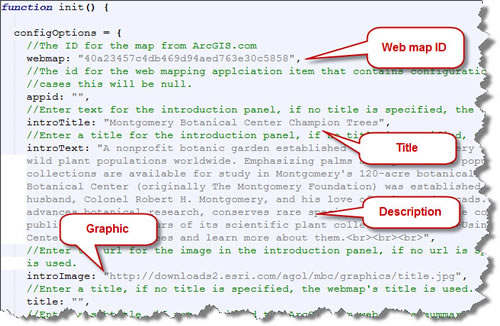
The template includes a splash screen that opens first and offers an opportunity to deliver more information and context for the map users. The graphic was crafted for the splash screen using Adobe Photoshop, and then a few edits were made to the index.html file to add the map via its unique ID and change the title, description, and graphic.
Here's the final splash screen:

Step 5
Publish the custom application. The last step was to take the customized application template and host it from a server. The application templates are ready to host, and all you need to do is copy all files to a web-accessible location.