ArcWatch: GIS News, Views, and Insights
October 2012
Below the Sea
Visualizing Bathymetric Data Using the Esri Ocean Basemap
The excitement surrounding the landing of the National Aeronautics and Space Administration's (NASA) rover Curiosity on Mars exemplifies our inquisitive human nature and our eagerness to explore the unknown. However, some of the greatest mysteries lie closer to home: the world's vast oceans. Esri is bringing GIS to this last frontier on earth by launching its Ocean GIS Initiative. One of the first projects undertaken in this exciting new initiative was the creation of a common basemap representing the ocean floor.
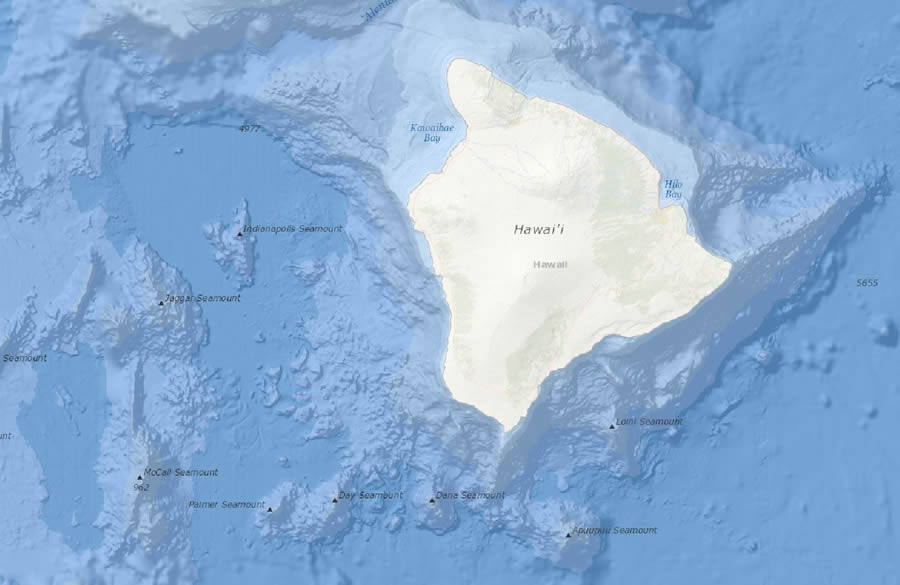
Detailed NOAA bathymetry can be seen surrounding Hawaii.
The Ocean Basemap includes marine water body names; subsurface feature names such as trenches, seamounts (underwater mountains rising from the ocean floor), and depth values in meters; and bathymetry. It serves as a powerful geospatial reference tool to help marine GIS professionals unveil some of the mysteries below the sea by visualizing bathymetric data as one continuous surface. Detailed bathymetric data is contributed via Esri's Community Maps Program from organizations such as the National Oceanic and Atmospheric Administration (NOAA).
NOAA's National Geophysical Data Center (NGDC) is the US national archive for bathymetric data and currently contains over 15.7 million nautical miles of ship track lines—representing more than 1,187 surveys. NGDC's data contributions have helped enrich the Ocean Basemap into a comprehensive and informative tool. As a result, it acts as a useful background for ocean-related data, applications, and web maps.
The Ocean Basemap serves as the foundation for several of the map viewers, such as the Bathymetry Data Viewer, used by NGDC to aid in the discovery of and access to ocean mapping and natural hazards data.
"The Ocean Basemap serves as an excellent reference layer for our viewers, providing context for our maritime data layers," says John Cartwright, geospatial systems architect at NGDC. "In the case of the Bathymetry Viewer, it allows the users to better orient themselves and find the location of the bathymetry datasets which we are offering."
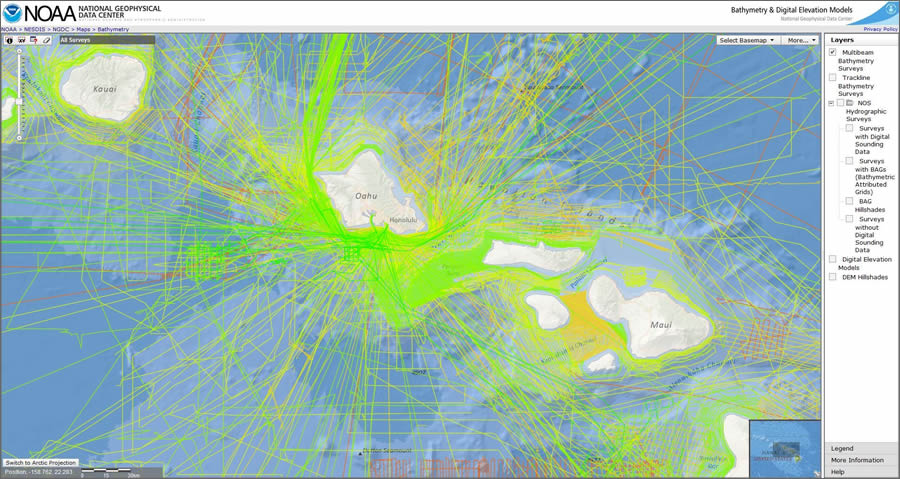
The Ocean Basemap Displayed in NOAA's Bathymetry Data Viewer, with Multibeam Bathymetry Surveys Applied
Multibeam sonar bathymetry is collected using a complex system that begins with sending sound pulses from transducers installed on a vessel. Precisely measuring the two-way travel time and returning angle of the sound allows a depth, or sounding, to be determined in an array across a swath under the vessel. After applying corrections for draft, water level, sound speed, and vessel attitude, the corrected depth soundings are formed into a bathymetric surface, typically a gridded map.
"Underlying many of the research, hazard mitigation, and resource management efforts key to NOAA's mission is a good understanding of the depth, shape, and geophysical characteristics of the seabed and subseafloor, information provided by multibeam sonar bathymetry," says Susan McLean, chief of NOAA's Marine Geology and Geophysics Division.
Ocean data from federal, academic, and non-US mapping agencies is available to the public from NOAA's NGDC, which creates an excellent opportunity for GIS professionals and organizations looking for detailed bathymetry to complement and geographically reference marine data.
NOAA recently added the capability to visualize hillshaded bathymetry from high-resolution surveys that use the open source Bathymetric Attributed Grid (BAG) surface and metadata format. BAG files are collections of gridded, multidimensional bathymetry data that contain position and depth grid information. Depth grid information (metadata) embedded in the BAG format helps users better understand the limitations and proper use of the high-resolution grids.
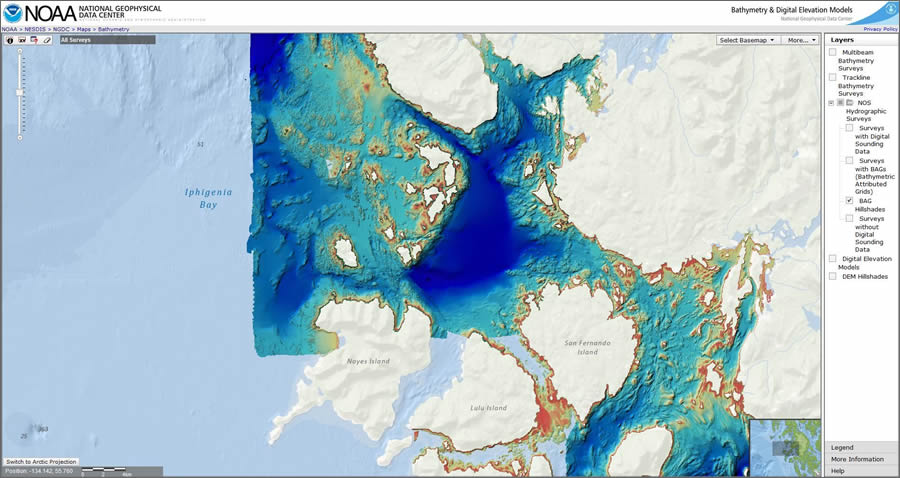
An Example of Hillshaded BAG Data Used in the Ocean Basemap
Bathymetry is not only used as an accurate backdrop for marine data but also utilized by organizations for disaster prevention and management. "These digital elevation models [of the seafloor] are used to forecast, plan, and mitigate the impacts of coastal flooding due to tsunamis, hurricanes, and storm surges," says McLean. "Bathymetry data collected to support delineation of the US extended continental shelf is being used to map and manage marine monuments in the Pacific." The United States maintains jurisdiction over many islands in the central Pacific Ocean that potentially extend the country's maritime border as part of the extended continental shelf, per Article 76 of the UN Law of the Sea.
While many scientific discoveries are undoubtedly waiting to be uncovered on the surface of Mars, even more may lie beneath the surface of our oceans.
"With so much of the ocean floor unmapped with modern methods, you never know when a new seamount, smoker [hot spring on the ocean floor, where heated fluids exit from cracks in the earth's crust], or underwater landslide might be discovered," says McLean. The use of NOAA data in the Ocean Basemap not only helps marine professionals visualize the seafloor quickly and easily but also fuels the imagination to discover what lies beneath the surface.