ArcWatch: Your e-Magazine for GIS News, Views, and Insights
December 2011
'Track It. Map It. Use It.'
South Carolina Shares Public Health Data
"If you want to learn about the health of a population, look at the air they breathe, the water they drink, and the places where they live."
—Hippocrates
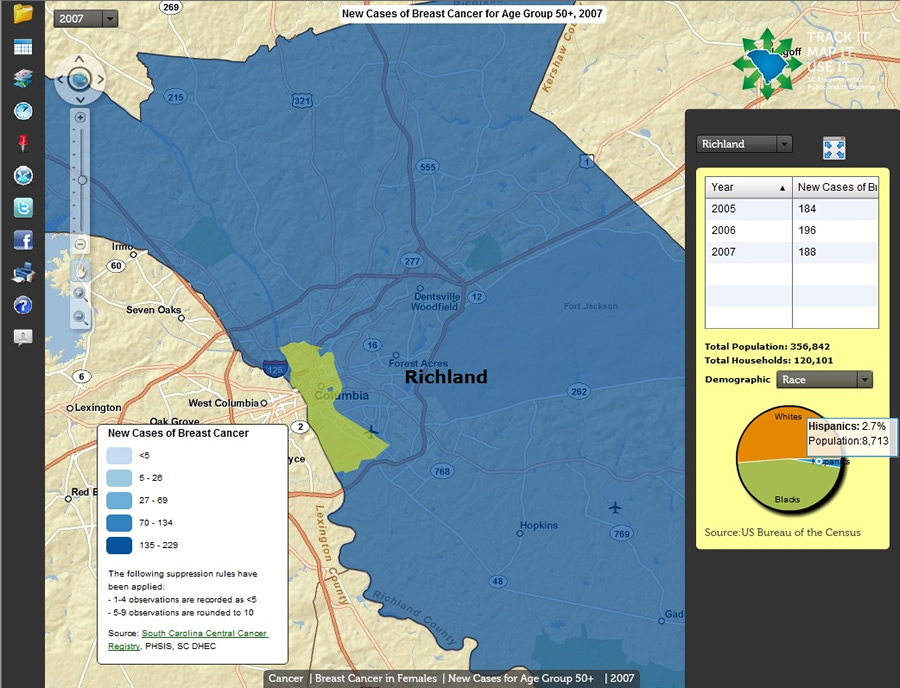
A demographics tool shows new cases of breast cancer for people 50 years of age while displaying each county's population by race, age, and gender.
South Carolina residents can now quickly track environmental public health information via an interactive website developed by the South Carolina Department of Health and Environmental Control (DHEC) and Esri partner US Computing using ArcGIS technology from Esri.
The site, created as part of the National Environmental Public Health Tracking (EPHT) Network initiative, aims to improve the health of communities by helping identify trends and promote healthier decisions.
"Environmental public health tracking is a way of incorporating data for analysis and reporting," said Jared Shoultz, deputy director, Public Health Statistics and Information Services (PHSIS), DHEC. "We set out to design a mainstream website with a rich user interface and decided to leverage our ArcGIS investment. Our overall goal is to provide information to help improve public health where people live, work, and play."
Content areas established by the Centers for Disease Control and Prevention (CDC) include air and drinking water quality, birth defects, cancer, carbon monoxide poisoning, childhood lead exposure, hospitalization data, and information about mothers and babies.
Visitors to the South Carolina DHEC site can access information by county, such as the number of fire-related carbon monoxide poisoning deaths and breast cancer cases and the hospitalization rates for heart attacks and asthma.
The site's tag line says, "Track It. Map It. Use It." And users can do just that, viewing and creating maps, graphs, and charts, along with community data, to help make better choices for health and the environment.

This chart shows new breast cancer cases for residents over 50 years of age in select South Carolina counties. The data can be displayed in the form of a chart, bar graph, or trend lines.
"We put this information in context so people can understand it better," Shoultz said. "Different types of data are used to learn how the environment affects public health."
Shoultz and his team pulled together data from sources such as the Environmental Protection Agency, CDC, Poison Control, the US Census, and numerous internal DHEC program areas. Within the GIS, the team then built the datasets related to CDC-determined content areas.
CDC provided funding to 23 US state and local health departments, including South Carolina's, to develop local tracking networks. These networks feed into the National EPHT Network and provide information about the following types of data:
- Health effects: Data about health conditions and diseases such as asthma and birth defects
- Environmental hazards: Data about chemicals or other substances in the environment such as carbon monoxide and other air pollutants
- Exposure: Data about the amount of a chemical in a person's body, such as lead in blood
- Other: Data that helps people learn about relationships between exposures and health effects (for example, information about age, sex, race, and behavior or lifestyle choices that may help explain why people have particular health problems)
Environmental causes of chronic diseases have heretofore been difficult to identify. The National EPHT Network could change that by providing the ability to measure the amount of hazardous substances in the environment in a standard way, trace the spread of these substances over a specific time periods and geographic regions, see how the substances show up in human tissue, and understand how they may cause illness.
For more information, contact the South Carolina EPHT Program at epht@dhec.sc.gov.