ArcWatch: GIS News, Views, and Insights
December 2012
Learn to Use Hidden Layers for Web Map Pop-Up Windows
How do you display a layer in your legend while you enable pop-up windows for a completely different set of information in a map you create in ArcGIS Online? There is an easy technique to give people the ability to retrieve information from sources other than the layers visible in your map.
This example illustrates how a map was created to show the counties in the northeastern United States that were impacted by superstorm Sandy while displaying a pop-up window with demographic information for a different layer. In this case, the demographic information is about the population age 64 years and older in that area.
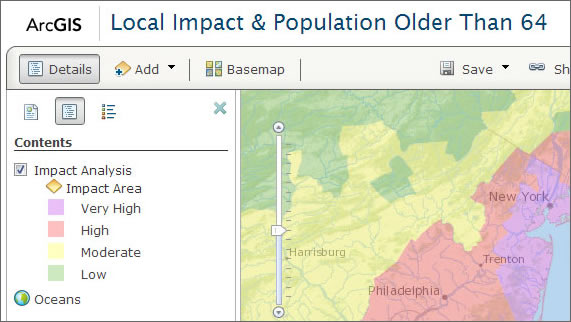
The goal was to show only the impacted counties in the legend and just the demographic data in the pop-up window. The map includes a layer from the Federal Emergency Management Agency (FEMA) showing impacted counties (shown below). Learn more about the impact analysis layer.
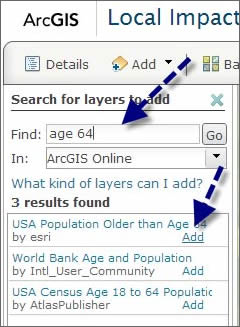
To add a demographic layer from ArcGIS Online for population over the age of 64 years, click Add and search for the layers to add. In this example, USA Population Older than Age 64 was added.
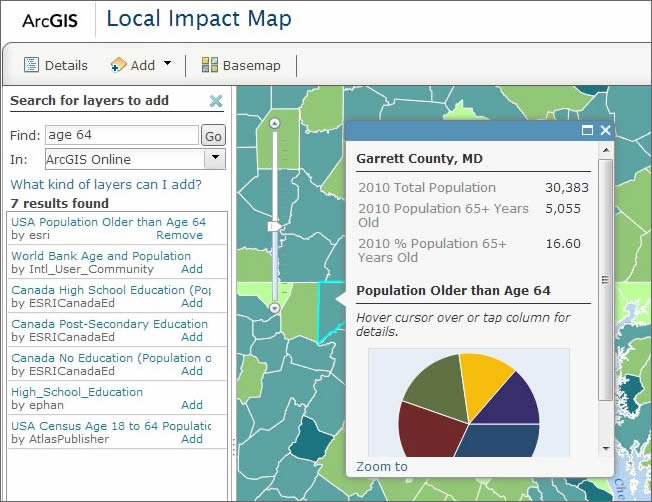
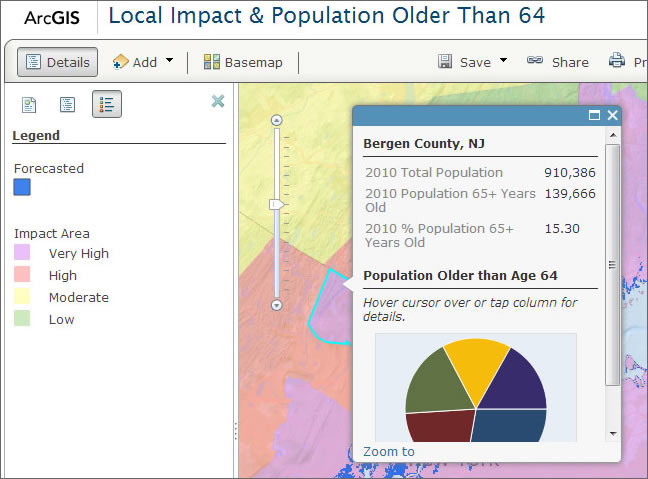
Below is the map with the demographic layer that shows its pop-up window:
A storm surge layer was also added to the map. Next, hide the legend for the demographic layer because it's going to be invisible on the map. You'll want users to retrieve the demographic information by clicking the map to see the information in the pop-up window.
The next three steps will show you how to do the following:
- Disable the pop-up windows for the storm surge and impacted-area layers (These layers only need to appear in the legend and should not act as a pop-up source.)
- Make the demographic layer invisible except to appear as information in the pop up window
- Remove the demographic layer from the legend
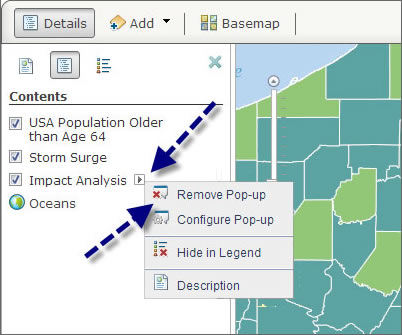
Step 1: To disable the pop-up windows for the impacted-area analysis and storm surge, first go to Contents. Look for Remove Pop-up from among the layer options when you hover over a layer name to reveal the arrow next to it. Note that if you have sublayers, you will need to click the layer to reveal them and then hover over the sublayer to reveal the arrow.
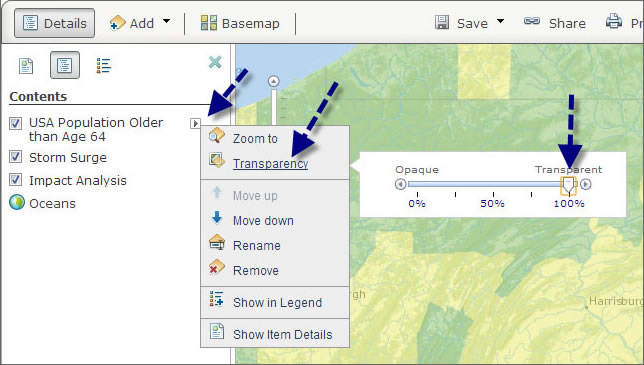
Step 2: Make the demographic layer invisible on the map. To do this, adjust the transparency to 100 percent using the layer options.
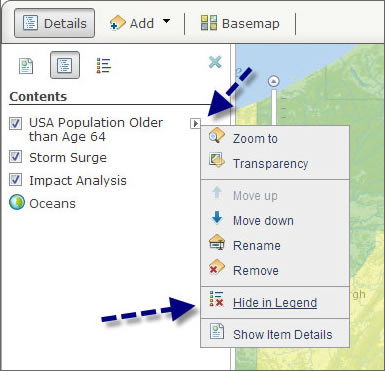
Step 3: Hide the legend for the demographic layer. You will find Hide in Legend when you click the arrow next to the layer name under Contents.
The final map enabled the impacted-area and storm surge layers to be displayed in the legend, with the pop-up windows coming from the invisible demographic layer as shown below.
Go to About Working with Layers for more information. You can also view the story map application about superstorm Sandy, which uses several web maps that employ this technique.