Use an AI Assistant to Explore the Pickleball Market
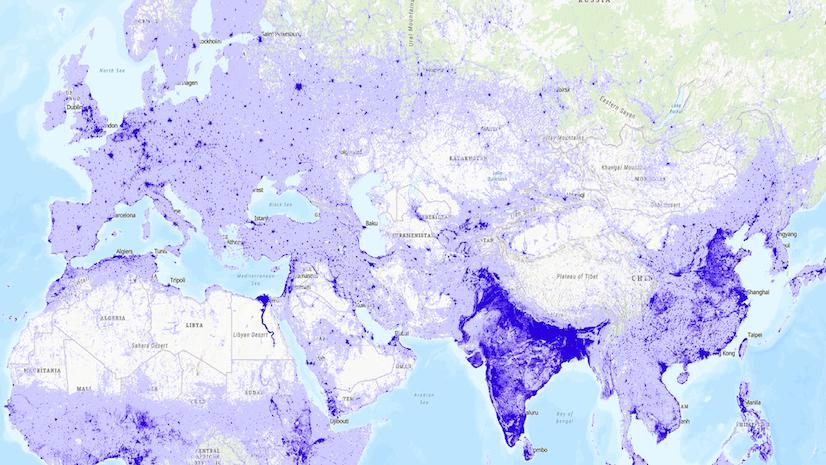
Create a color-coded map to find where potential customers play and determine the ideal location for a pickleball equipment store.
Create a color-coded map to find where potential customers play and determine the ideal location for a pickleball equipment store.
Has your data source ever been moved, renamed, or deleted? Here’s how to remedy this type of error.
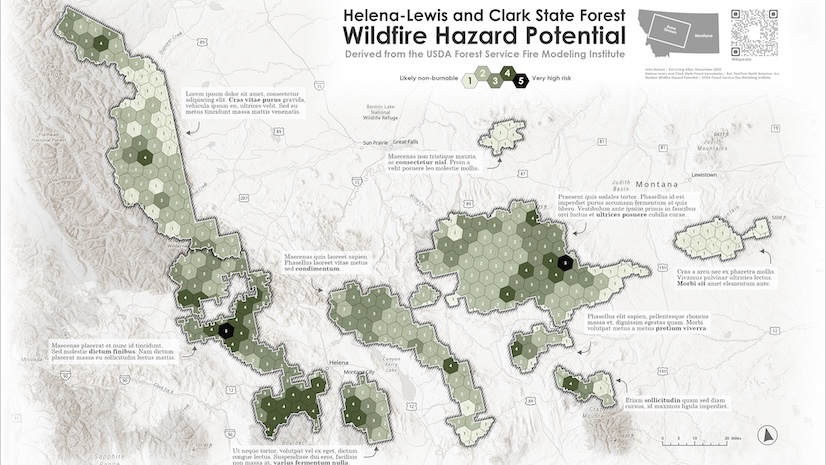
Physics-based simulations of floods help decision-makers understand data and assess risk.
Cloud platforms provide easy access to a variety of geospatial data, making it simple to enhance analyses and visualizations.
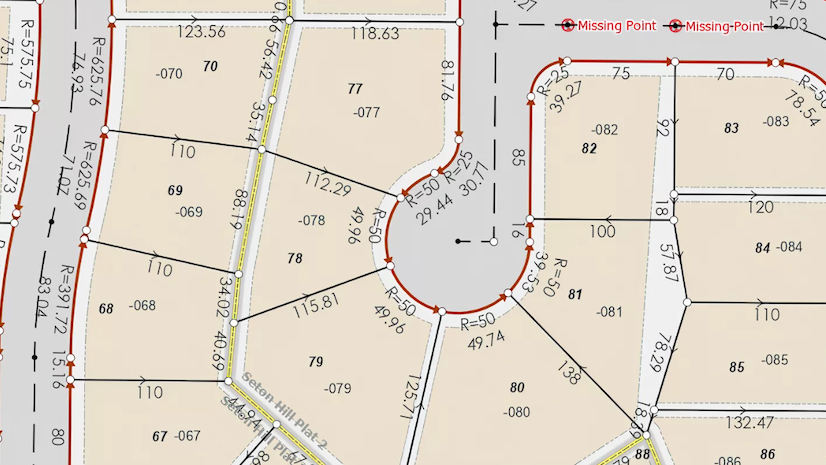
From tracking parcel configuration changes to a flexible data model, this parcel mapping and management solution has key features.
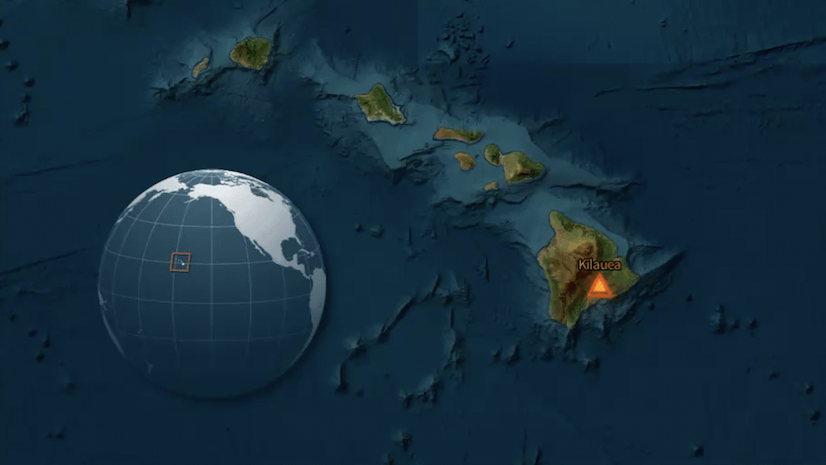
Find out how to convey motion, create atmosphere, and add visual cues in Map Viewer using a multimedia story about the volcano Kīlauea.
New enhancements streamline the analysis of hyperspectral imagery and simplify how users can extract meaning from complex imagery datasets.
Watch this video to learn the three key elements of assembling a well-balanced map layout and how to create your own stunning design.
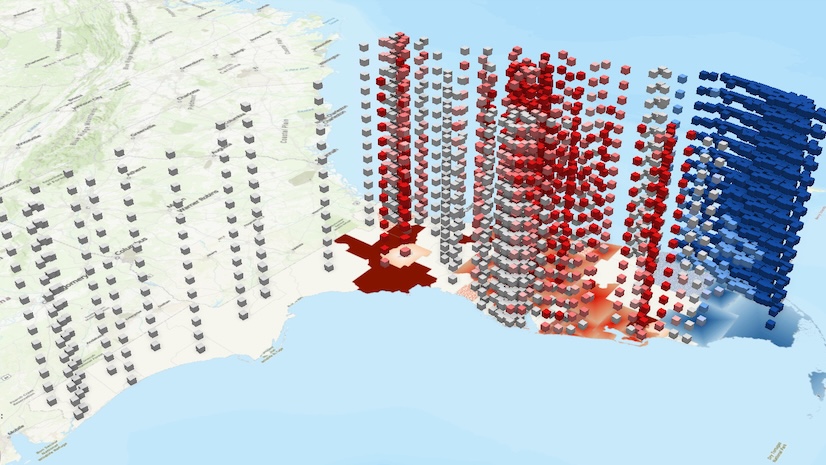
In this tutorial, learn how to analyze spatiotemporal data by visualizing changing homeownership rates over time throughout Florida.
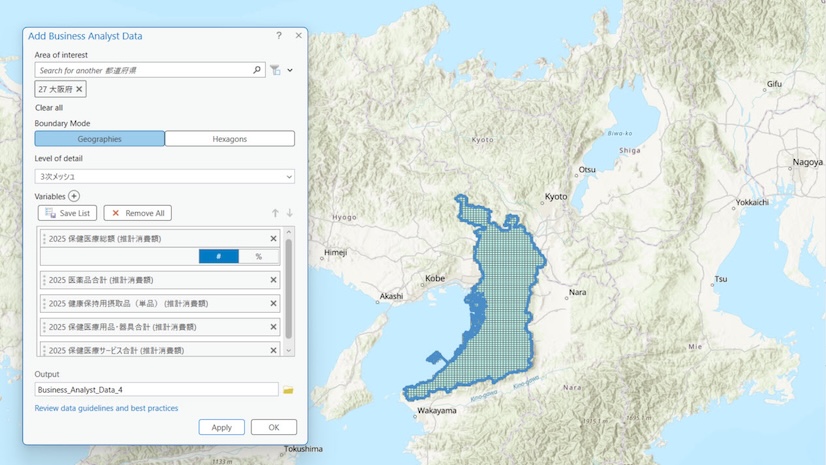
The Add Business Analyst data utility streamlines the data preparation process by allowing users to create enriched datasets for analysis.
Segmentation data includes geographic and demographic data and reveals the hidden patterns in how people live, work, and spend their time.
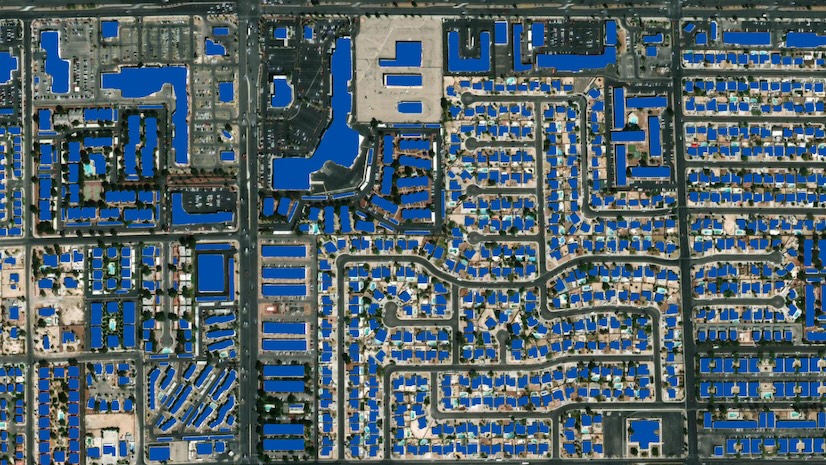
Discover the core and advanced imagery capabilities available in ArcGIS Pro.