ArcGIS Online helps you understand the world around you by using interactive maps to connect people, locations, and data. You get smart, data-driven styles and intuitive analysis tools that deliver location intelligence. ArcGIS Online gives you the ability to make maps and apps to share your insights with your organization or the world. You can use it as a complete, cloud-based solution or to complement the capabilities of ArcGIS Pro and ArcGIS Enterprise.
Don’t have an ArcGIS account? See Create an ArcGIS Account.
The June 2025 update includes new capabilities in Map Viewer, user type updates, AI assistants in preview, streamlined analysis workflows with ModelBuilder, imagery analysis in ArcGIS Excalibur, along with other enhancements and new functionality throughout ArcGIS Online. Highlights are provided below.
ArcGIS Online is updated three times each year. See the ArcGIS Online blogs to learn more about previous updates to ArcGIS Online and new functionality and enhancements you may have overlooked.
For more information and additional details about this release, see the What’s new help topic or view all posts related to this release.
Don’t have time to read the blog article? View the video below instead.
Quick links
Use the links below to jump to sections of interest.
- Map Viewer
- Analysis in Map Viewer
- Scene Viewer
- AI Assistants (preview)
- User type updates
- Content management
- Accounts and administration
App Builders
Apps and Extensions
- ArcGIS Web Editor
- ArcGIS Notebooks
- ArcGIS Data Pipelines
- ArcGIS Velocity
- ArcGIS Excalibur
- ArcGIS GeoBIM
- ArcGIS Workflow Manager
Ready-To-Use Content
Map Viewer
Using Map Viewer, you can author, explore, edit, and share web maps. Map Viewer is used to perform common GIS tasks, such as to explore the contents of a web map, change the basemap, add data layers and styles, perform measurements, and execute different types of data analyses. It features responsive mapping and supports real-time updates to the map as you work.
Here’s an overview of new features and enhancements to Map Viewer delivered with this update.
Drag and drop
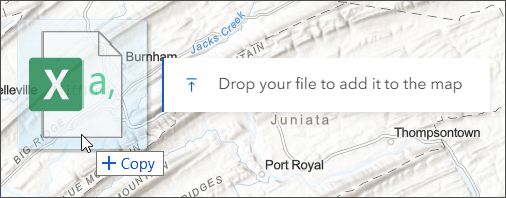
Map Viewer now supports adding layers using a new file drag-and-drop capability. Drag and drop files directly onto the map to initiate the New item workflow without going to My content or using Add layer. See Adding files to Map Viewer.
Easily share any map
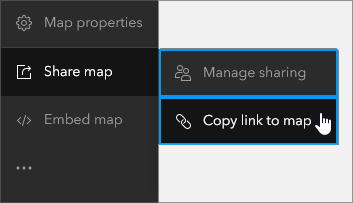
You can now easily share any map in Map Viewer using Copy link to map, a new option from Share map on the Contents (dark) toolbar. The Map Viewer short link preserves the map at its current extent and makes it easy to share the link to the map with others in your organization, or publicly. Note that for public sharing the map must be shared publicly.
Embedding maps
When embedding a public map using ready-to-use HTML code, you can now preserve the map scale. This ensures that the map opens at the preview scale, preserving the relative size of features across devices. Otherwise, the scale varies to show the features in the preview extent. Both options allow you to embed different views of the same web map based on what you see in the preview without creating multiple copies.
Spike theme
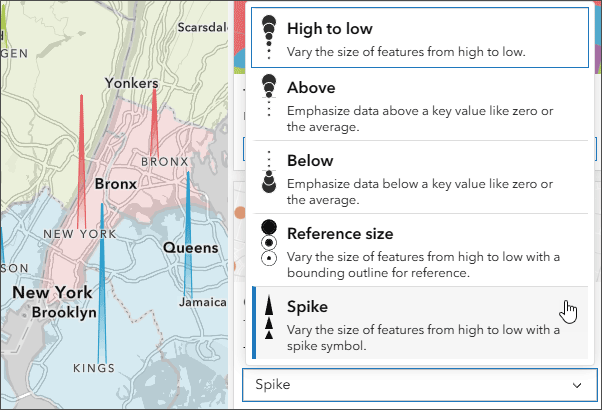
Proportional symbols can be visualized by height using a new smart mapping Spike theme. Upwards protruding spikes symbolize values and can be configured in a variety of ways. Smaller spikes indicate smaller values and taller spikes indicate larger values.
Extent-based styling
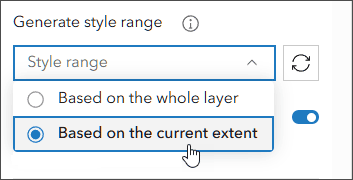
When applying styles to layers, the entire value range of what you are symbolizing is considered. You now have the option to generate the style range based on the extent of the entire layer, or based on the current map extent. This determines what data will be used to generate the visual range for a given style and is useful when you are working with nationwide data, but are interested in authoring local maps and exposing local data nuances.
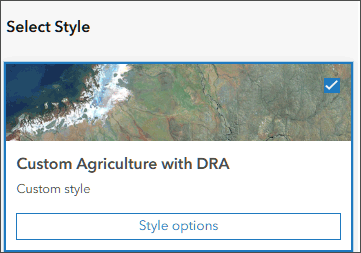
Preset styles for imagery layers
When styling an imagery layer, processing template, or variable, you can now register your changes as a preset style, which allows you to switch between different layer visualizations. These visualizations can be configured in Map Viewer or ArcGIS Pro.
Once saved, they can be selected and applied by anyone working with the map. This is especially useful for creating visualizations for additional variables in multidimensional imagery, allowing you to switch between different layer visualizations without reverting to default styling.
Editing enhancements
When editing features, you can now select multiple features using the rectangle and lasso selection tools. Bulk feature selection allows you to delete features, update feature attributes, and move several features at once instead of individually.
Charts
Like maps, charts help uncover patterns, trends, and relationships in data. When used in conjunction with maps, charts can help you tell a more complete story about your data. With this update, charts have been improved with the following:
- Charts now support the following data types: timestamp offset, data only, and big integer.
- You can now reorder charts in the Charts pane.
- Charts have been updated for better rendering performance.
- The Export button is now available on the chart toolbar and can be used to export the chart as an image or a table. Learn more about interacting with charts.
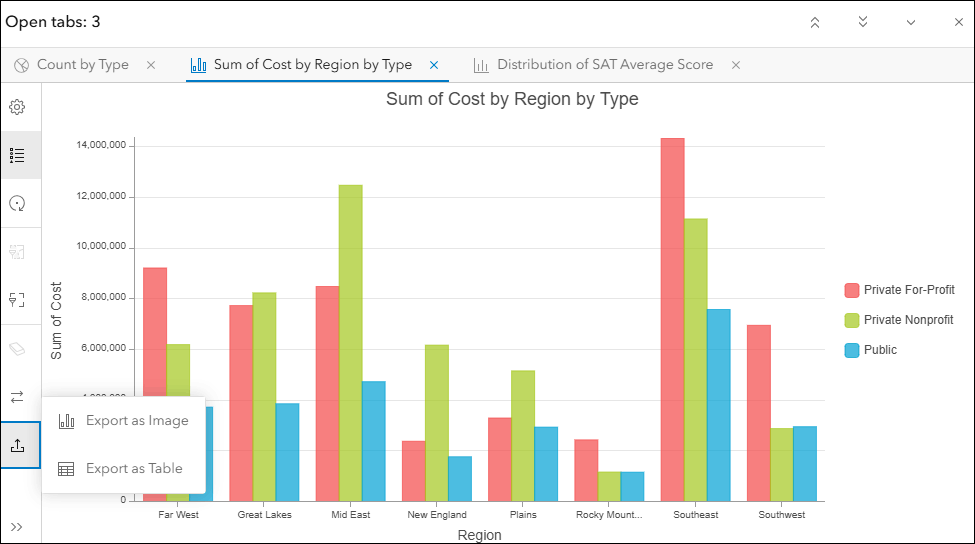
For more information, see Configure charts.
ArcGIS Arcade assistant (beta)
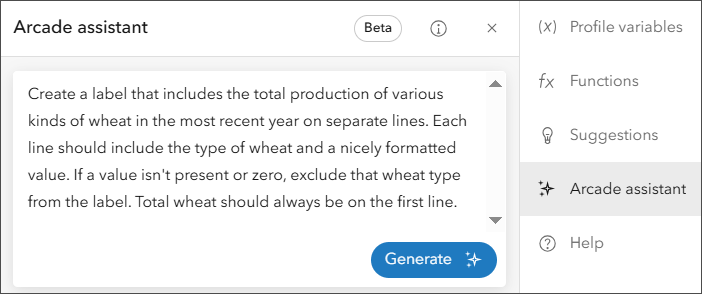
An Arcade assistant (beta) is now available that helps in generating code to perform certain tasks using AI. For example, you can ask a question about your data or describe what you want to do and the assistant will generate the Arcade from your prompt. Example prompts might be:
- Change the values in the field “NAM” to sentence case and append “National Park” to the string.
- Compute the change in oil production from the current feature with the average of all features within 5 miles. Include the production value for the current feature, the average production within 5 miles, the total change and percent change. Use HTML to format values in bold and colored so an increase uses green text and a decrease uses red text.
- Create a label that includes the total production of various kinds of wheat in the most recent year on separate lines. Each line should include the type of wheat and a nicely formatted value. If a value isn’t present or zero, exclude that wheat type from the label. Total wheat should always be on the first line.
Other new features and enhancements
Labeling has been improved to provide better conflict resolution and positioning, especially when multiple label classes are present.
Multipoint geometry labeling is now supported.
Map image layers can now be saved as a new layer item. When a layer is saved, current settings and configurations are saved and the layer can be used in other maps without making additional modifications.
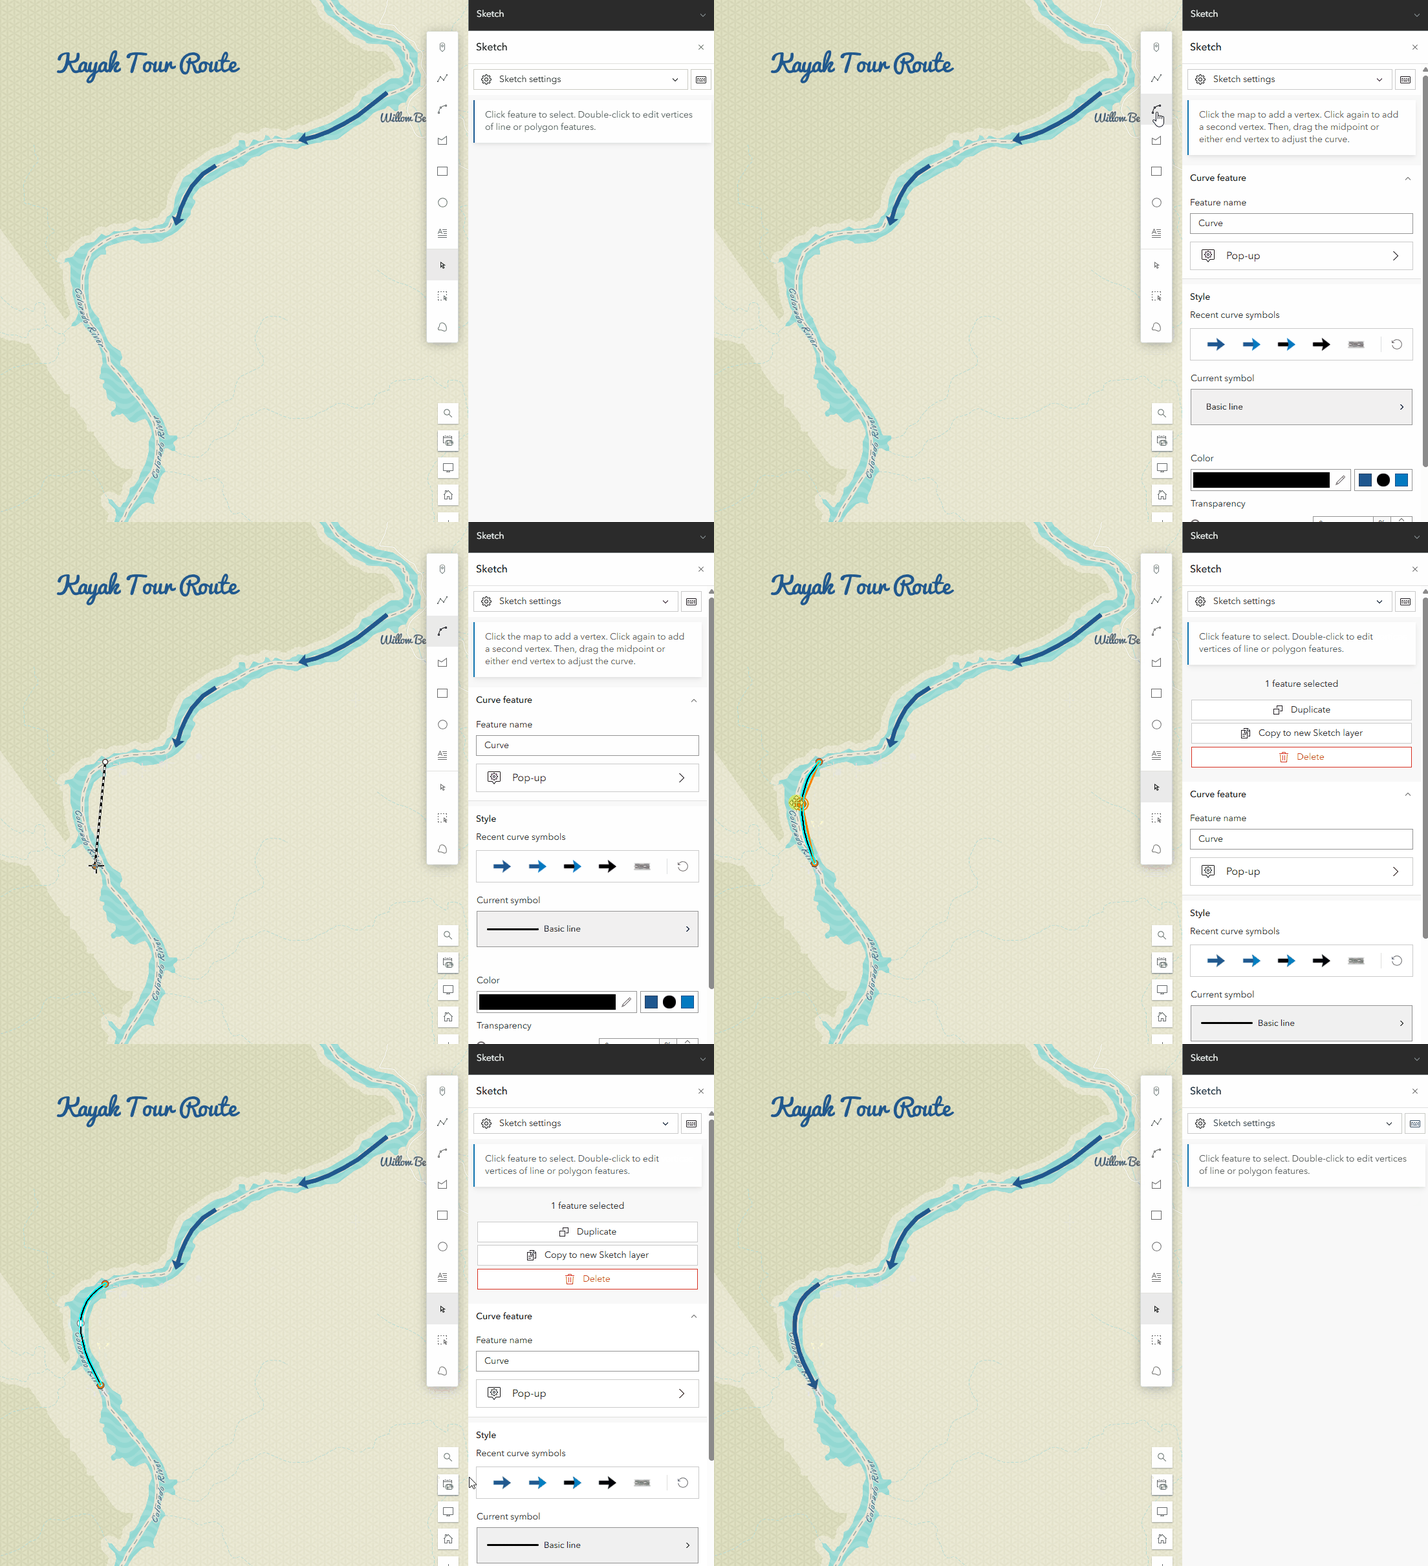
Bezier curve support has been added to Sketch layers, allowing you to add curved arrows or paths to your map.
Time configuration has been updated to present a consistent experience between Map Viewer and Scene Viewer. These updates also include support for instant time mode (current time) in Map Viewer.
Members with appropriate privileges can now fully configure Indoors Positioning (IPS) data directly within Map Viewer. You can now enable smoothing, enable GNSS, enable Apple IPS, and enable path snapping with a distance tolerance threshold. Previously, these configurations were only possible using ArcGIS Pro.
Analysis in Map Viewer
Map Viewer’s spatial analysis tools allow you to quantify patterns and understand relationships in your data. Feature and raster analysis tools and raster functions are available to all members with the appropriate privileges.
ArcGIS Living Atlas imagery layers optimized for analysis
Select Living Atlas imagery layers have been optimized for analysis. The spatial extent for analysis has been expanded to state-wide, country-wide, or even global scale, and these layers can be used in conjunction with one another for multisource analysis. This enhancement unlocks powerful workflows such as change detection, land cover classification, urban heat analysis, and more, all without the need to download or manage any source imagery.
This capability was previously introduced in beta and is now in general availability. As of June 2025, the following layers have been optimized for analysis:
- Landsat Level-2
- USA NAIP Imagery
- Sentinel-1 RTC
- Sentinel-2 Level-2A
- Sentinel-2 10m Land Use / Land Cover Time Series
The list of optimized layers will continue to grow. The full collection of currently optimized layers can be found in the Living Atlas Imagery Layers Optimized for Analysis group.
For more information, see Understand imagery layer settings for analysis.
New and updated analysis tools
The Distance Accumulation and Distance Allocation tools and raster functions have improved performance when using the Vertical factor and Horizontal factor parameters.
The Zonal Statistics tool and raster function and Zonal Statistics as Table tool now use the cell size of the value raster as the analysis cell size for both raster and feature zone input by default, ensuring accuracy since the value raster is the primary raster that influences the output results. You can accept the default cell size setting or specify different numerical values, a raster dataset, or a keyword setting. Tools that use Maximum of inputs or another setting as the default continue to do so.
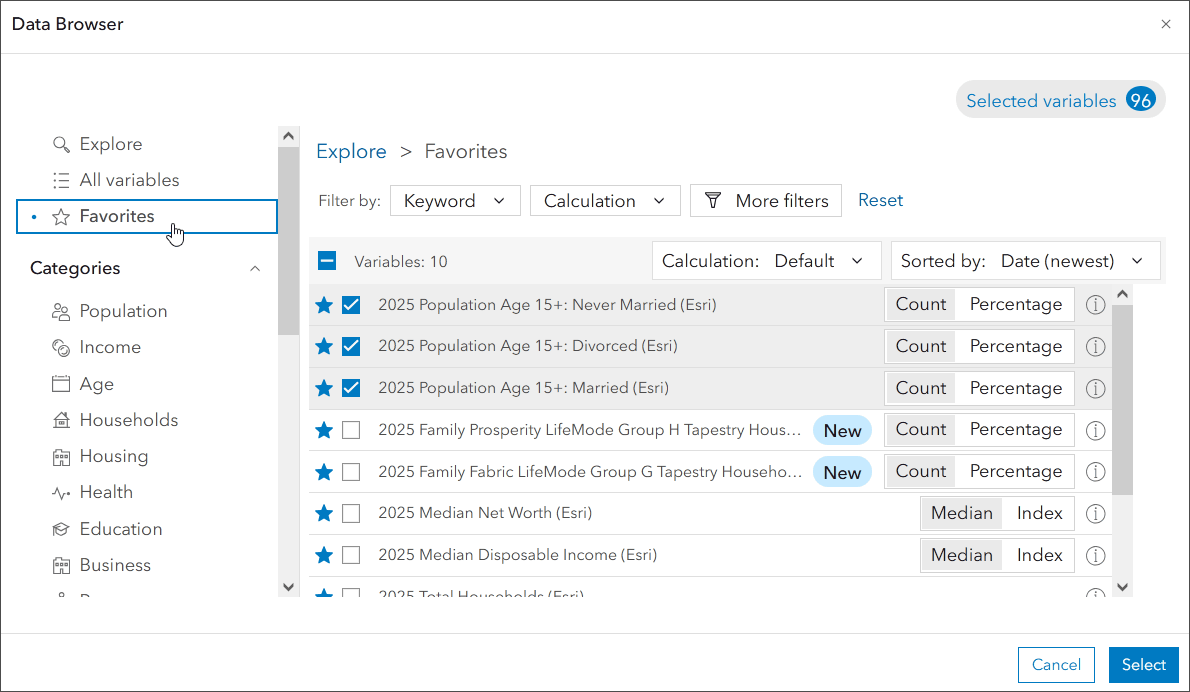
The data browser used by Enrich Layer now supports adding variables to a Favorites list and has improved search functionality. Many number variables now support choosing a statistic (count, percentage, or index) to calculate within the enrichment areas.
When creating route layers, turn-by-turn directions for multi-stop routes now include a travel time estimate for each stop along the route.
Tools and raster functions that honor the Cell size environment now support an empty option.
Parameters in a raster function templates are now only visible as variables in the Analysis pane if IsPublic is enabled. Previously, if IsPublic was not enabled for any parameters, all parameters were exposed as variables to run the function template.
The style of the Raster Function Editor has been updated to provide a consistent experience across the website.
ModelBuilder
ModelBuilder is an interactive canvas for building analysis workflows using the analysis tools available in Map Viewer. Models are created by chaining together data and analysis tools into workflows, where the output of one tool becomes the input for another tool. These workflows can range from routine data management tasks to complex spatial analysis.
With ModelBuilder, users can design, execute, and share complex multi-step analysis workflows—entirely within a browser and without writing a single line of code.
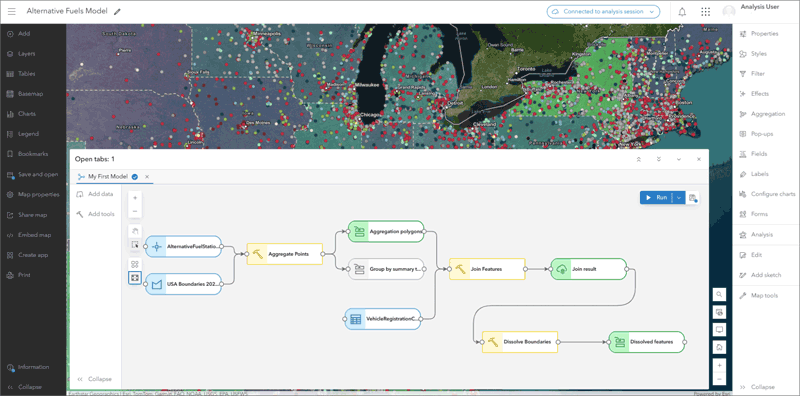
ModelBuilder is now out of beta and in general availability. Key enhancements with this update include the following:
A new Filter by Attributes tool enables users to filter data and focus on the relevant features in their analysis workflows within the model, without needing to work outside ModelBuilder. Filter by Attributes creates an output data variable of features that meet attribute criteria.
ModelBuilder also introduces a new view-only mode, so users can understand what the model does and the processes and workflows behind them, without establishing a session and consuming credits.
Input data variables in models can now be updated to reference a different hosted feature layer or table.
For more information, see ModelBuilder exits beta: now generally available in ArcGIS Online.
Scene Viewer
Scene Viewer is ArcGIS’s dedicated web app for visualizing geospatial data in 3D, from local web scenes to large-scale digital twins. With this update, Scene Viewer has been enhanced with new capabilities and features, including the following.
Focus areas
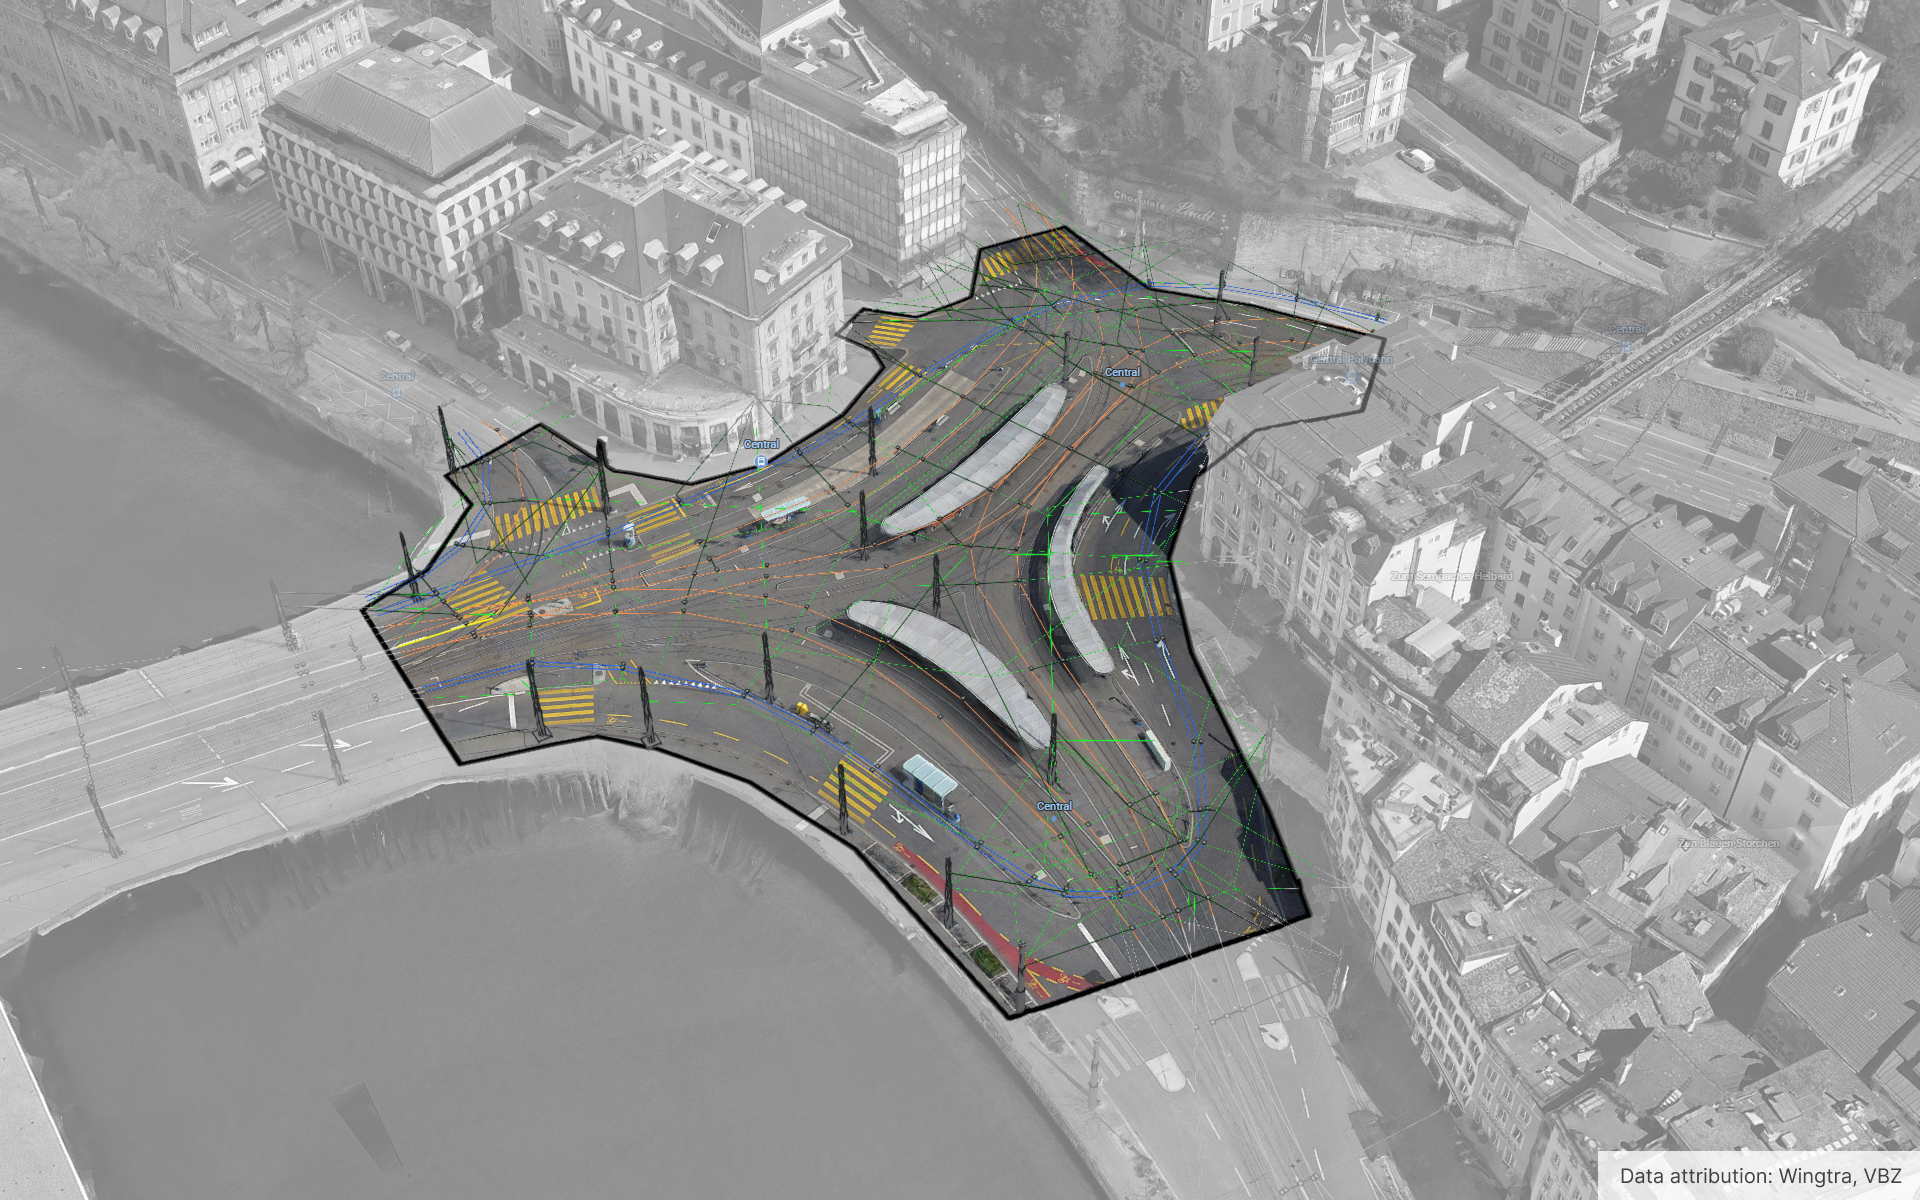
Add focus areas to your scene presentation to highlight your project area. Your project area is masked to emphasize certain details inside, while everything outside fades to the background. This helps to guide your audience’s attention to the right places and puts your work into focus.
Slice and pop-ups in presentations
Make your scene more accessible to everyone and use presentations to guide your audience through important viewpoints. You can now capture slides that include pop-ups and 3D slices to display important information and reveal what is inside or underneath the scene.
Share your scene or specific slides in presentation mode to make it easy for anyone to view.
3D tiles integrated mesh
3D tiles integrated mesh layers support modifications and can be added to Scene Viewer via a URL. You can cut holes, mask, or adjust the height of the integrated mesh to combine it with other layers. For example, if you have an integrated mesh of a city area, you can cut a hole in the mesh to remove an existing building and replace it with a 3D model of the proposed building.
Updated 3D buildings in basemap gallery
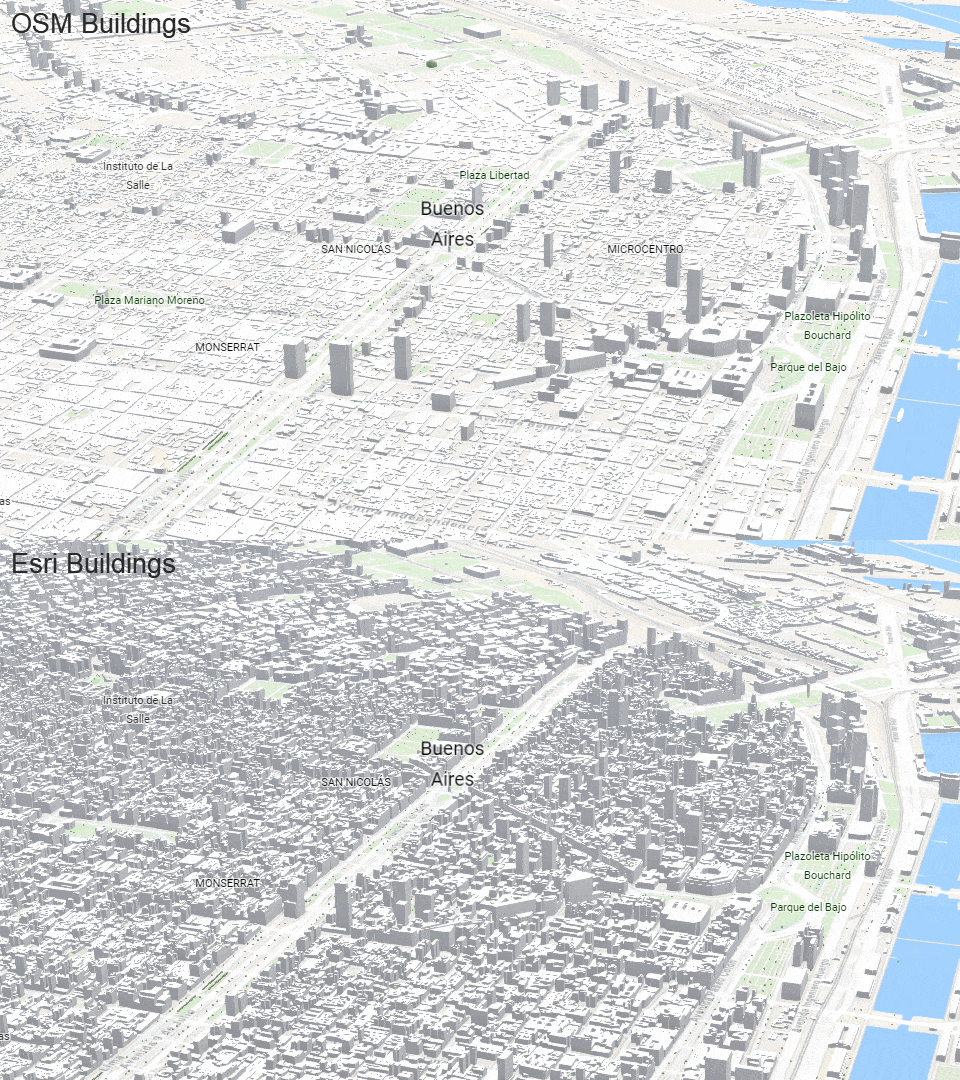
Using 3D buildings data acquired from Maxar and TomTom, as well as Esri Community Maps Contributors, new Esri 3D buildings layers have been incorporated into basemaps in the Scene Viewer basemap gallery, and include updated 3D buildings for large parts of the world.
AI Assistants (preview)
Previews gives you the opportunity to use AI assistants in your ArcGIS environment for a limited duration, until they become generally available. The following AI assistants are available in preview:
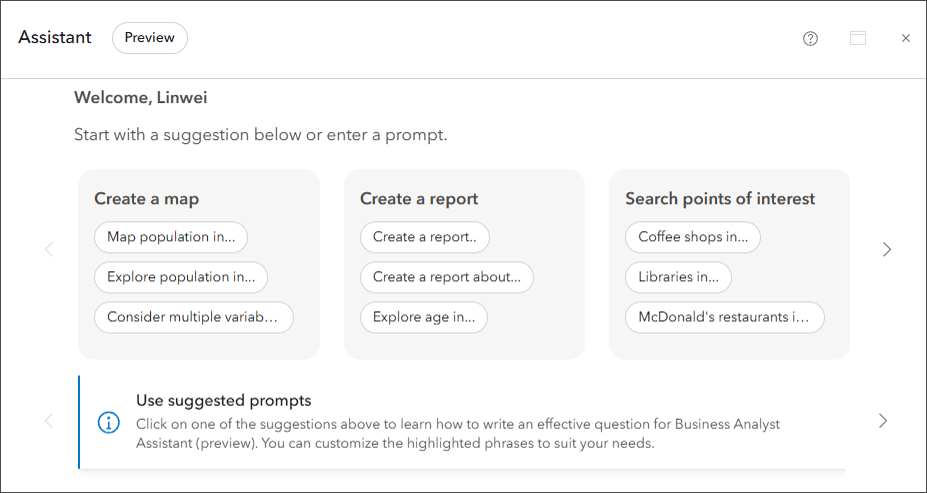
ArcGIS Business Analyst Web App assistant
This powerful productivity tool that uses artificial intelligence to recommend popular workflows, data, infographic reports, and tips. It provides intelligent suggestions and understands geographic context through prompts or search queries, making your work more efficient.
ArcGIS Survey123 assistant
This conversational experience helps you draft Survey123 forms, which you can later refine and publish using the Survey123 Designer. This tool makes creating surveys quicker and easier.
ArcGIS Survey123 and ArcGIS Instant Apps translation assistant
Translate your forms and apps into multiple languages, leveraging state-of-the-art machine translation to ensure your content is accessible to everyone.
User type updates
User types are the primary way to access ArcGIS, the comprehensive geospatial platform for creating, managing, analyzing, mapping, and sharing all types of data. User types have been updated to include access to additional ArcGIS capabilities, apps, and services. The following products are now included in user types:
- ArcGIS Business Analyst Web App Standard: Location-based market and community intelligence is now included in the Creator, Professional, and Professional Plus user types.
- ArcGIS CityEngine: 3D city design software is newly included in the Professional user type (and is already included in Professional Plus).
- ArcGIS Urban: 3D scenario modeling and impact assessment for communities, cities, and regions is now included in the Professional Plus user type.
- ArcGIS Navigator: Advanced navigation and routing for your workforce is now included in the Mobile Worker, Creator, Professional, and Professional Plus user types.
For more information, see User types overview.
Content management
ArcGIS Online provides content management tools for your organization. With this update, the following changes have been made:
Improved item pages
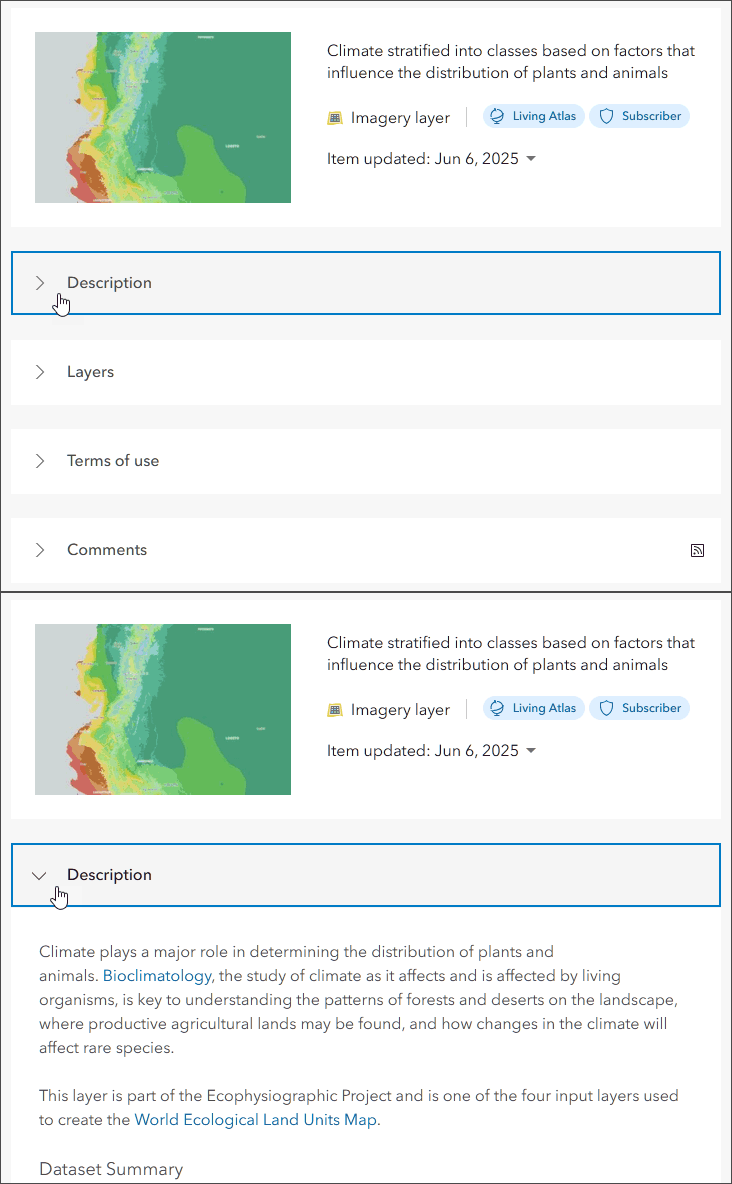
The item pages are improved to match the style used in other parts of ArcGIS Online. Long menus or sections on the Overview tab that required scrolling are now grouped inside collapsible sections. Click the arrows to open or close sections.
Data tab updates
The Data tab of the item pages for hosted feature layers and hosted tables includes the following improvements:
- The Update data button allows you to access the interface to add or update data from the Data tab.
- Options to define a calculation expression are available from the Tables view and Fields view in multiple locations.
- When defining a calculation expression from the Data tab, you can preview the changes before you calculate. You can also apply filters so that the expression applies to only certain features.
- Value lists and ranges have been renamed to list and range domains to align with the terminology in ArcGIS Pro.
- The workflow for defining and editing domains is improved and expanded. You can define list or range domains for date, date only, and time only fields in a hosted feature layer. When defining a list domain for a field in a hosted feature layer, you can import a comma separated values (CSV) file that includes the label and code to use.
Metadata improvements
When using the metadata editor from the ArcGIS Online item details, users can select the synchronize option to sync attribute information (field name, display name (alias), field descriptions, field type, field length) to their metadata, streamlining metadata authoring. See Sync attribute fields using the Metadata Editor for more details.
A new metadata style is supported—Dublin Core+. Administrators can configure the organization to use this metadata style, or others, in the Metadata section in the Items tab of the organization settings.
For more information, see Metadata in ArcGIS Online.
Other updates and improvements
You can update features in a hosted feature layer to include new attachments from a source file geodatabase.
Accounts and administration
You can now create custom sign-in experiences for the organization and for registered apps, helping you better organize and control the sign-in options for app users and organization members. For more information, see Customize your organization’s sign-in experience.
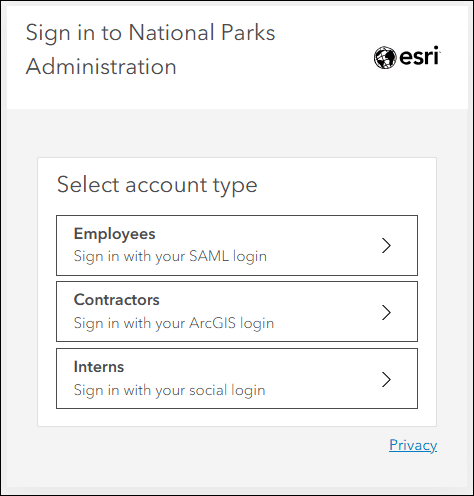
Members with ArcGIS logins can now personally reset their multifactor authentication if they are in an organization that has enforced multifactor authentication. To reset multifactor authentication, members must sign in using their current credentials and second-step verification.
ArcGIS Instant Apps
ArcGIS Instant Apps are lightweight, configurable web applications that allow users to quickly create and share interactive maps and apps without the need for extensive coding or development skills. The templates feature a streamlined experience that lets you build apps quickly and easily using express or full setup modes. All Instant Apps templates can be found on the searchable Instant Apps home page.
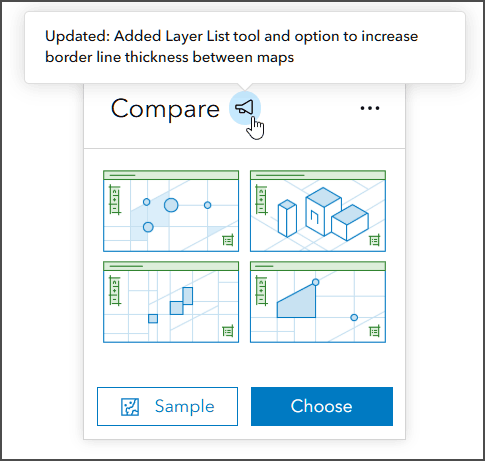
ArcGIS Instant Apps templates are regularly updated. On the Instant Apps home page, look for and hover over the announcement badge or card to learn more about any new, updated, or beta apps.
Instant Apps updates
Atlas enables organizations to highlight a collection of curated maps and layers. It’s an effective way to enable non-GIS users to make their own maps and explore your organization’s content. Atlas has been updated with the ability to toggle labels in map layers.
Basic enables you to create an app quickly with a minimal interface, allowing you to share your map or scene with any audience. Basic now replaces Media Map and all functionality has been merged, including sketch tools and swipe. The new merged app is named Basic (Media Map). Existing Media Map apps will continue to function and can be configured.
Compare delivers the ability to choose between modes to compare multiple maps at the same location, or compare multiple locations in the same map. Compare now includes a Layer List tool and an option to increase border line thickness between maps.
Manager offers users the ability to review and edit features on a map. Users can also edit attributes, attachments, and related feature records. Manager adds support for bulk attribute editing and a layer visibility tool.
Public Notification allows users to create a list of features based on a single location or drawing an area of interest. The list can be exported to a CSV or PDF file. Public Notification now includes attribute filtering.
Reporter enables users to submit issues or observations about a specific area using a smart form. Forms are then added to the map and can be configured to allow collecting comments and voting. Reporter now includes the ability to set a boundary for reports.
Sidebar provides a side panel layout next to the map that can be configured with various tools that can be used to add and update features. Sidebar now adds support for bulk attribute editing and sketch tools.
Streamflow Viewer Streamflow Viewer allows app viewers fast visualization to explore your streamflow forecasts. This app includes two streamflow services: the GEOGLOWS Streamflow forecast service, a 10-day river forecast from the European Centre for Medium-range Weather Forecasting (ECMWF), or the United States National Water Model, a 10-day river forecast from the National Weather Service. Streamflow Viewer has been updated with the ability to filter the stream service.
Instant Apps beta
Web Editor is introduced in beta as an early access app. Use the Web Editor template to offer focused data editing capabilities for both GIS and non-GIS users. The app can be configured with a wide array of editing tools to add, update, or remove features. Forms can be used to auto-populate attribute values and enforce your organization’s data rules to ensure data accuracy. This Instant App complements ArcGIS Web Editor by offering a customized way to deliver editing capabilities to specific members of your organization.
For more information, see What’s new in Instant Apps (June 2025).
ArcGIS Experience Builder
Use ArcGIS Experience Builder to build modern mapcentric or non-mapcentric web apps and webpages without writing code. Start building from scratch, or choose from an extensive library of templates that you can customize.
You can add functionality to any template with widgets you can drag, drop, and configure. You can also add custom widgets, themes, and actions with low-code development to further extend your web app.
New widgets connect to Autodesk Construction Cloud
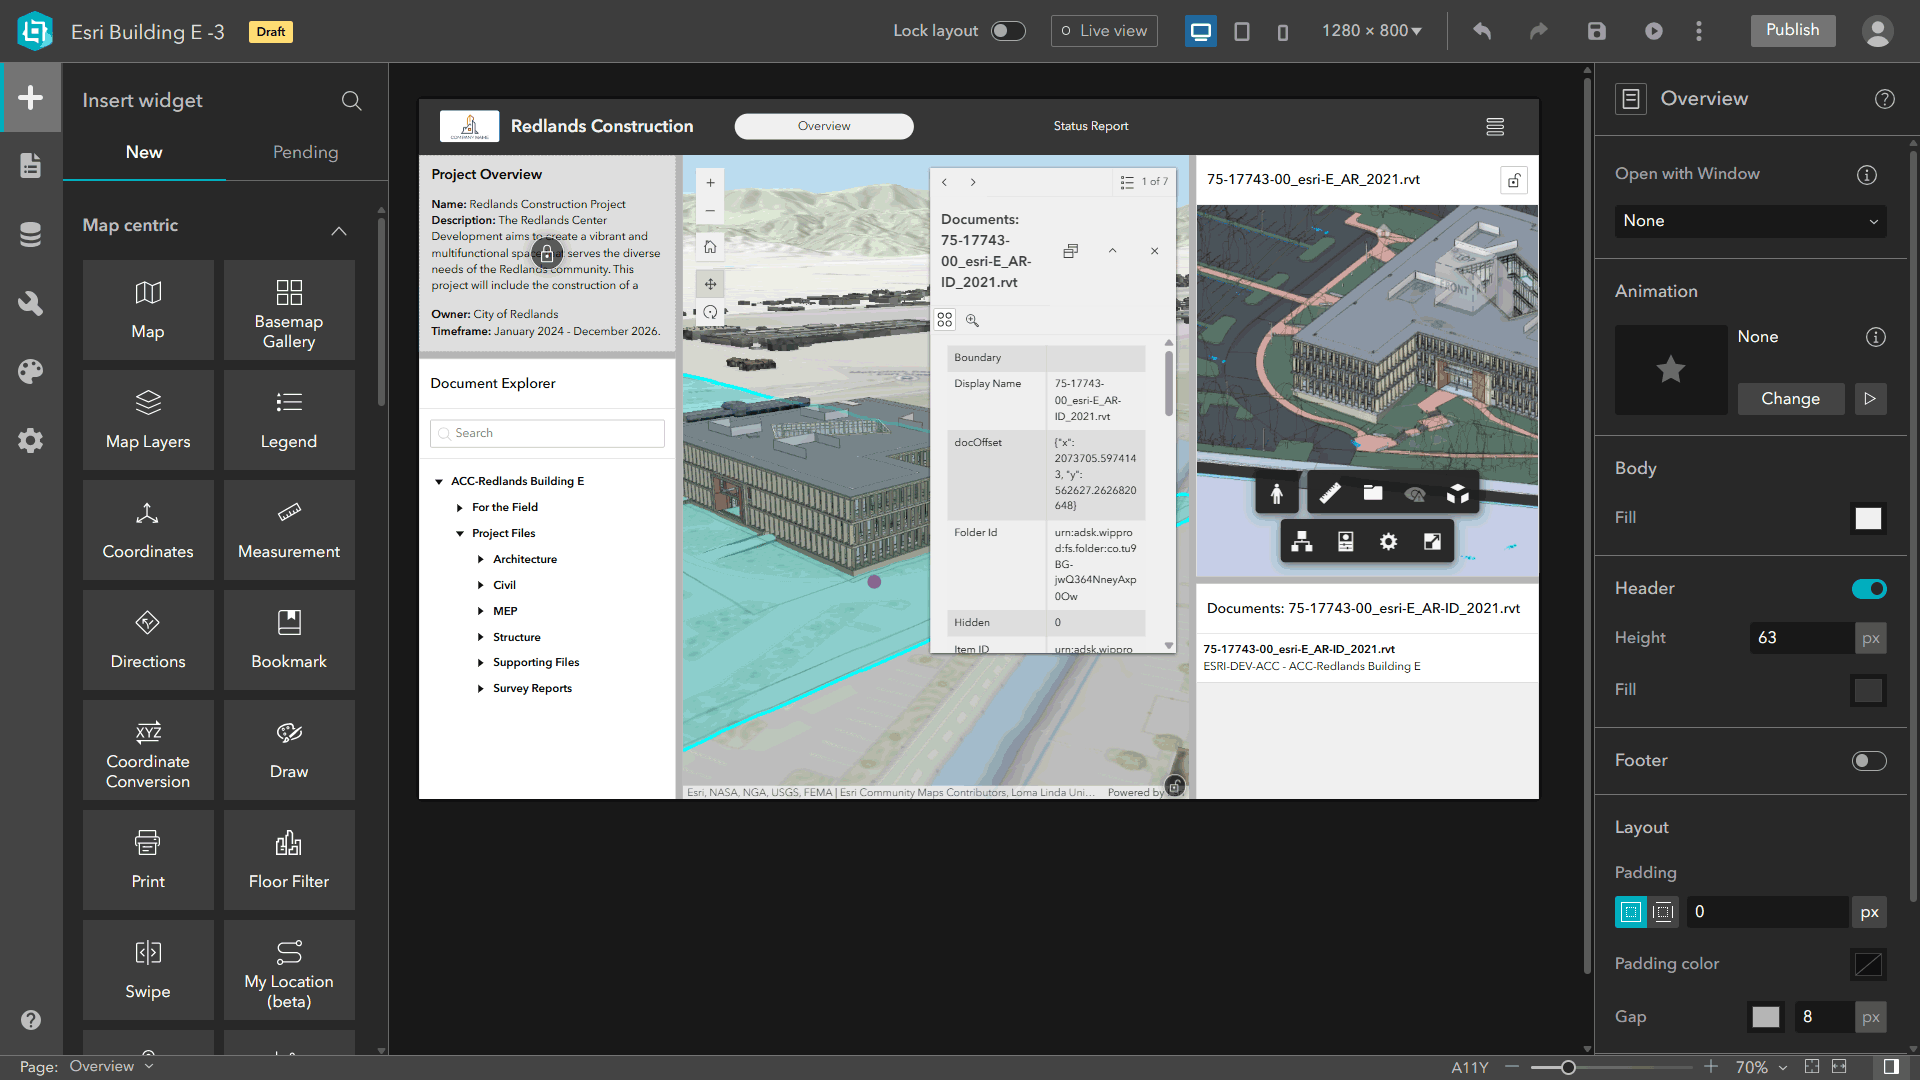
ArcGIS Experience Builder includes new widgets that improve the integration of architecture, engineering, and construction (AEC) data from Autodesk Construction Cloud (ACC). Widgets used to support integration with ACC include: Document Explorer, Document Viewer, and Link Explorer. These widgets bring the ArcGIS GeoBIM experience to a custom app builder environment and provide more ways to explore BIM models, CAD drawings, and related documents through custom web apps.
Arcade expression support
ArcGIS Experience Builder adds support for Arcade expressions. You can use Arcade to add data sources and display dynamic content and styles.
Other updates
The Edit widget supports batch attribute editing, allowing you to perform bulk updates to data.
The new Display Order widget defines the rules for mosaicking and displaying overlapping images from an image layer.
Other enhancements include the ability to export data to more file types including shapefiles, geodatabases, and .kml files, and support for saving the app state.
For more information, see What’s new in Experience Builder.
ArcGIS Dashboards
ArcGIS Dashboards enables users to convey information by presenting location-based analytics using intuitive and interactive data visualizations. Dashboards are used to help make decisions, visualize trends, monitor status in real time, and inform their communities. With this update, ArcGIS Dashboards includes several new capabilities and enhancements.
Header styling
Dashboard authors can now customize the font, font size, and color for header text, as well as the header’s foreground color. These settings apply to dashboard areas such as elements, sidebar, splash screen, and information windows.
New date type fields
ArcGIS Dashboards now supports the following new date field types.
- Date only (EsriFieldTypeDateOnly) for storing dates (day, month, year)
- Time only (EsriFieldTypeTimeOnly) for storing time values,
- Timestamp offset (EsriFieldTypeTimestampOffset) for storing date and time values with UTC offset information.
For more information, see What’s new in ArcGIS Dashboards.
ArcGIS Web Editor
ArcGIS Web Editor is a web-based editing app that provides a focused, efficient editing experience in ArcGIS Online. Web Editor combines tools you’re already familiar with, such as snapping, templates, and forms, along with new capabilities.
Web Editor Instant App (beta)
Create and share a custom editing app using the Web Editor (beta) template in Instant Apps. This allows organizations to build user-friendly, focused, streamlined editing applications while also removing unwanted capabilities.
Field calculation
Calculate an attribute field on a hosted table or hosted layer using calculate fields.
Support shared templates from hosted services
You can now access shared templates published to ArcGIS Online in Web Editor, including group and preset templates.
Other updates and improvements
- Add spatial and non-spatial records by creating a record in a table.
- Open and view subtype group layer sublayer tables by opening a table.
For more information, see the ArcGIS Editor What’s New help or watch the Introduction to Web Editor video to learn how to access Web Editor and select and edit features.
ArcGIS Notebooks
ArcGIS Notebooks provides a Jupyter notebook experience optimized for ArcGIS, allowing users to combine sophisticated spatial algorithms with powerful open-source Python libraries to develop advanced spatial data science models. ArcGIS Notebooks reduce time spent managing dependencies across data science ecosystems and increase cross-team collaboration and transparency.
Updates for Notebooks include:
- New versions of ArcGIS API for Python, ArcPy, and Python libraries are now available in the notebook runtimes.
- Workflows in the notebook editor have been simplified and the Advanced settings have been reorganized.
For more information, see Get started with Notebooks.
ArcGIS StoryMaps
Use ArcGIS StoryMaps to combine maps, 3D scenes, embedded content, multimedia, and more into an interactive narrative that can create awareness, influence opinion, and affect change. The easy-to-use builder helps you create digital stories and presentations (called briefings) that incorporate your GIS work and external content. Stories and briefings can also be organized into collections and customized with themes.
The following are highlights of recent changes and enhancements.
Rearrange and edit briefing slide layouts
Creating slides with dynamic maps and apps using briefings in ArcGIS StoryMaps has been improved with flexible slide layouts. More than 30 new layouts are available, and you can now add, resize, and remove panels to change the layout without needing to create a new slide.
Infographics
Infographics simplify complex information by combining visuals and text, helping viewers better understand your narrative and keeping them engaged. Using the Infographic block, it’s easy to add and configure informative graphics in your stories and briefings.
360 images
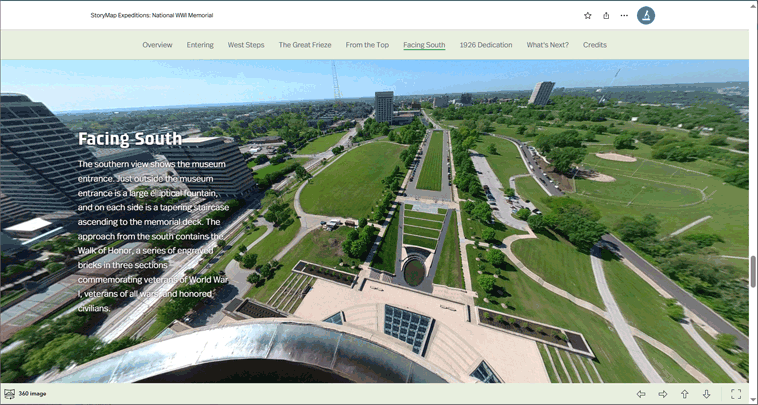
You can now add 360-degree images (PNG or JPG) to your story from the block palette. 360 images provide a more immersive way to explore a place. As viewers hover near the top of a 360 image, additional navigation tools are presented, including full screen mode. 360 images can be added to any story or briefing.
Map tour enhancements
Creating a map tour by batch uploading a large set of photos has been optimized, now taking seconds instead of minutes. There are also new configuration options for tours created from feature services, design updates to simplify and improve navigation, and a new grid layout for categorized tours.
Other new features and enhancements
- Seven themes have been added to the Featured themes gallery.
- Video playback options have been added to briefings.
- Axis customization is now supported for charts.
ArcGIS StoryMaps is updated regularly. For more information, see the update blog articles listed below:
What’s new in ArcGIS StoryMaps (June 2025)
What’s new in ArcGIS StoryMaps (May 2025)
What’s new in ArcGIS StoryMaps (April 2025)
ArcGIS Data Pipelines
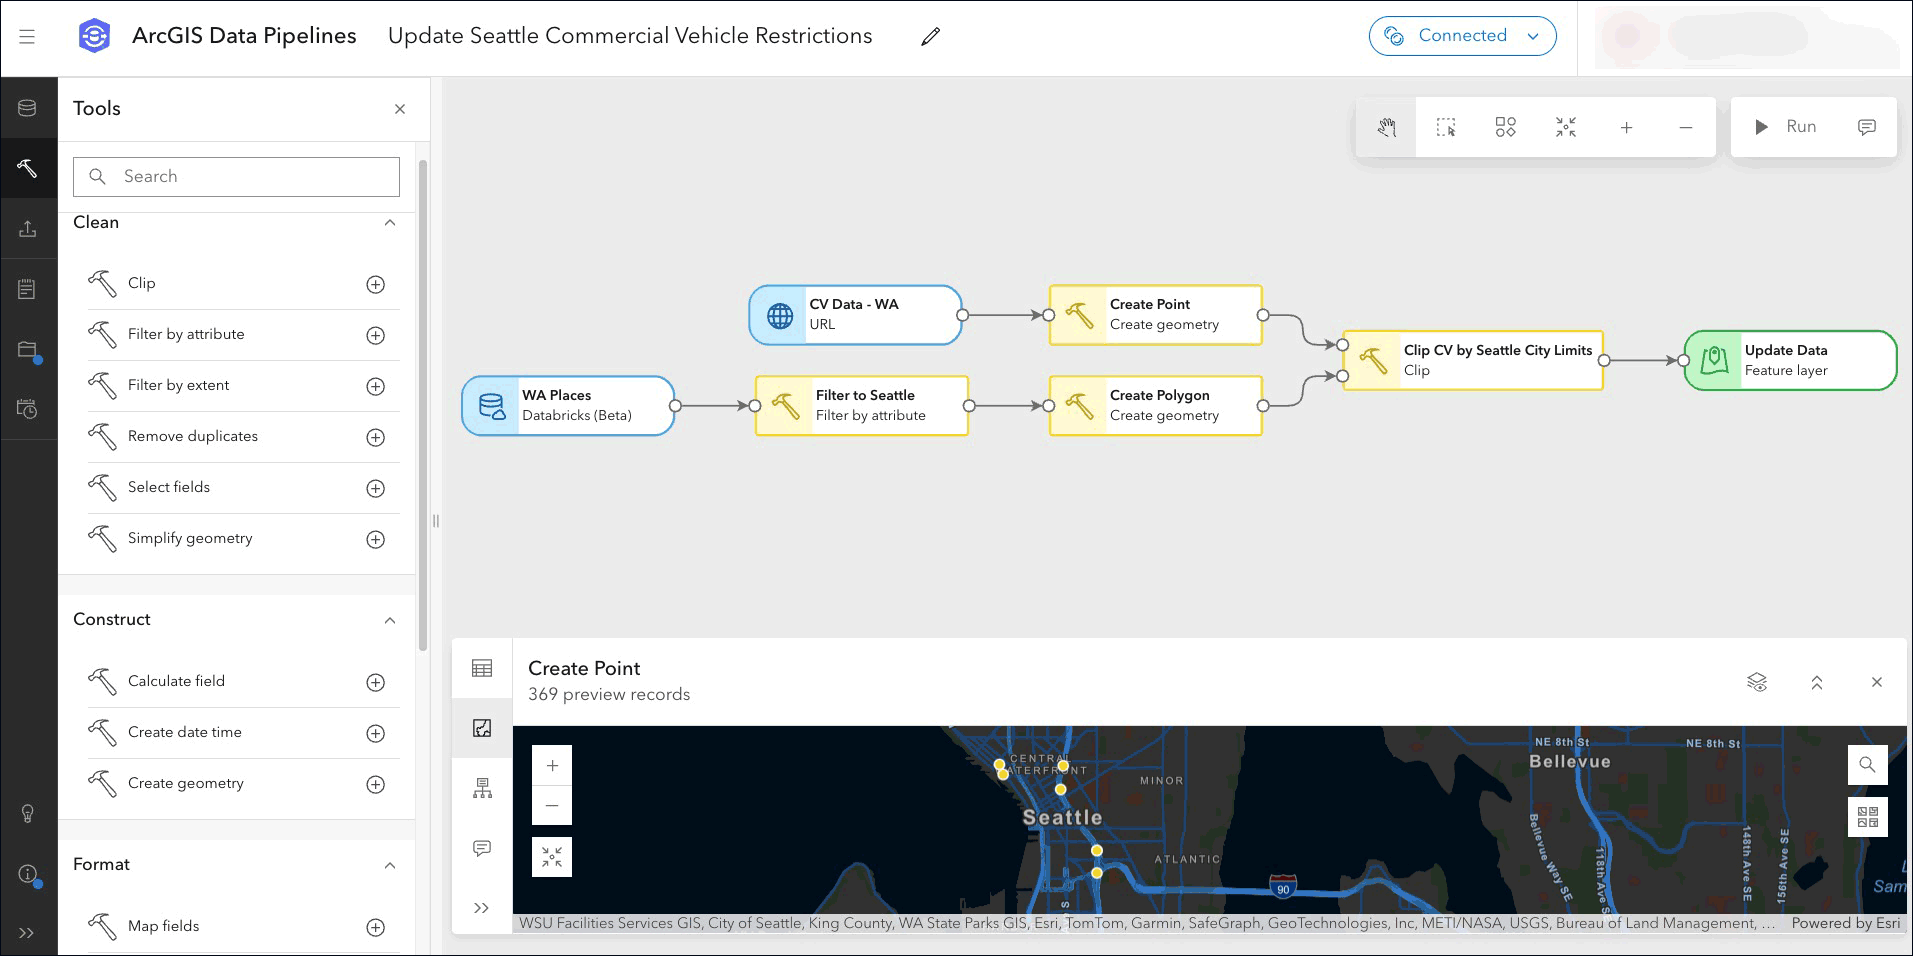
ArcGIS Data Pipelines is a no-code, visual data engineering capability that makes it easy to prepare and integrate data for mapping and analysis workflows. With a drag-and-drop interface, you can connect to a variety of data sources, apply common data preparation tools, and publish the results as a hosted feature layer or table.
Data Pipelines can be run on demand or scheduled to run automatically, reducing manual effort and ensuring your organization’s data stays current and ready for use.
Updates include the following capabilities and enhancements:
New inputs
- Beta support is available for creating a data store item that connects to Databricks.
- Securely connect to URLs or APIs that require authentication (beta).
- Snowflake’s key-pair authentication is now supported.
New tool
Data Pipelines now includes a new clip tool that enables users to cut out a piece of one dataset using one or more of the features in another dataset like a cookie cutter.
For more information, see the ArcGIS Data Pipelines What’s New help topic or What’s New in ArcGIS Data Pipelines (June 2025).
ArcGIS Velocity
ArcGIS Velocity is a cloud-native add-on capability for ArcGIS Online that enables users to ingest data from the Internet of Things (IoT) platforms, message brokers, or third-party APIs. It also helps users process, visualize, and analyze real-time data feeds; store those feeds as big data; and perform fast queries and analysis. Recent updates include the following:
New feeds
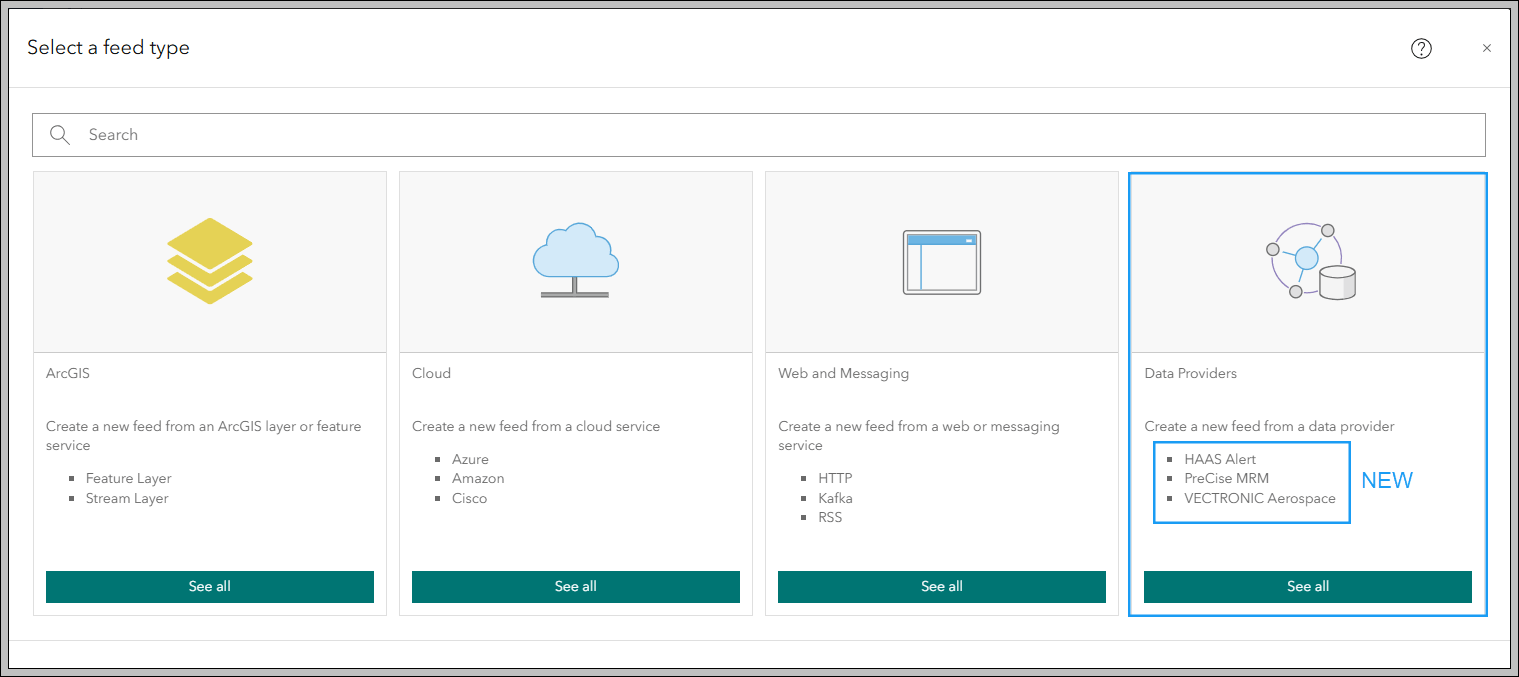
Support for three new data provider feeds has been added:
- Monitor wildlife locations and perform real-time movement analysis by accessing GPS data from wildlife tracking collars from VECTRONIC Aerospace Inc with the VECTRONIC Aerospace feed type.
- Quickly ingest fleet and Automatic Vehicle Locations (AVL) data from PreCise MRM to support fleet management with the PreCise MRM feed type.
- The HAAS Alert feed type offers access to data on emergency vehicle locations, work zones, and other road hazards.
New integrations
- Support for Trimble Unity Maintain has been added, allowing Velocity users to automate the creation of work orders from data in the field. These enhancements will provide greater efficiency and functionality.
New analytic tools
- Dynamically generate points from multipoint, polyline, polygon, or envelope geometries to reduce unnecessary geometric data with the Feature to Point tool.
- Correct out-of-sequence data on the fly with the Delay and Reorder Tracks analytic tool.
For more information, see What’s New in Velocity.
ArcGIS Excalibur
Previously only available for ArcGIS Enterprise, ArcGIS Excalibur is now in general availability for ArcGIS Online.
ArcGIS Excalibur is web-based imagery and video analysis software for working with maps, images, and video services. Using Excalibur, you can annotate, mark up, and add observations or measurements to imagery with easy-to-use analysis tools and workflows. Using images and video as key data sources, users can create content for reports, presentations, or dashboards to share with stakeholders for informed decision-making.
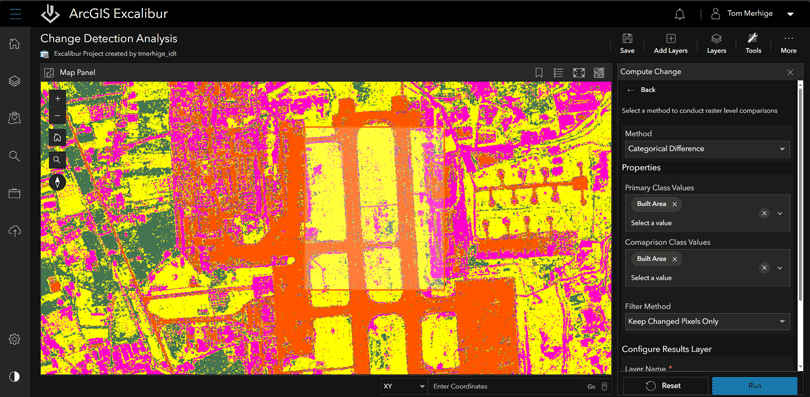
ArcGIS Excalibur includes new raster functions and change detection tools, enabling users to monitor vegetation health, detect changes between datasets, and extract specific areas more quickly and precisely using NDVI, Compute Change, and Clip Raster functions. Excalibur also supports pre-trained deep learning models in ArcGIS Living Atlas, providing an alternative to using ArcGIS Pro for some workflows.
For more information, see What’s new in Excalibur.
ArcGIS GeoBIM
ArcGIS GeoBIM delivers a connected data environment that seamlessly links architecture, engineering, and construction (AEC) information in Autodesk Construction Cloud with geospatial data and services in ArcGIS. This integration unifies teams and projects from design to operations with efficiency and accuracy for improved collaboration, decision-making, and optimized outcomes.
This update streamlines GIS and BIM integration with simplified 3D models, expands flexibility for building custom web apps, and adds support for more file formats.
Simplified 3D models streamline GIS and BIM integration
The new Add Document Models tool makes working with frequent changes to large infrastructure and building models more efficient. It creates simplified, performant 3D models from Autodesk Revit® and Industry Foundation Classes (IFC) data with links to source documents in Autodesk Construction Cloud.
Currently in beta, this tool reduces file sizes by up to 95%, automates georeferencing, and generates ready-to-use 3D web scenes. By streamlining updates and ensuring spatial accuracy, teams can work more efficiently, access critical design data faster, and improve decision-making with responsive, geolocated BIM content.
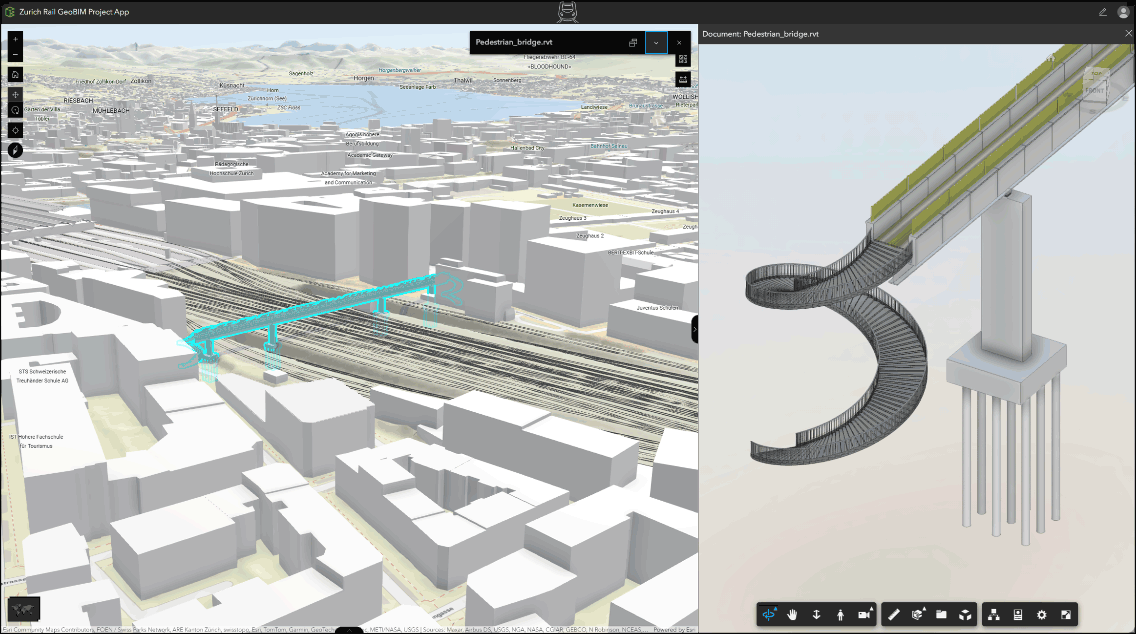
New ArcGIS Experience Builder widgets
Three new widgets in ArcGIS Experience Builder enable teams to build more powerful, customized web apps that connect GIS and AEC data. Designed to enhance integration with Autodesk Construction Cloud, these new widgets extend the ArcGIS GeoBIM experience enabling better collaboration and project insight.
Support for JPG, PDF, and DGN files
By integrating commonly used formats, including PDFs and DGNs often used in transportation workflows, ArcGIS GeoBIM transforms static files into strategic, collaborative assets. With a unified platform for accessing computer-aided design (CAD) drawings, field images, and engineering documents, project teams can reduce delays, improve coordination, and focus more time on execution instead of file management.
For more details, see What’s new in ArcGIS GeoBIM (June 2025).
ArcGIS Workflow Manager
ArcGIS Workflow Manager is a scalable workflow management system that acts as the conductor to orchestrate repeatable geographic information system (GIS) and non-GIS operations. It streamlines production processes by automating and simplifying the performance and management of work across environments in an organization.
The June 2025 update of ArcGIS Workflow Manager includes the following new features and enhanced functionality:
Partnered collaborations
Workflow items can now participate in ArcGIS Online partnered collaborations. This allows participating organizations to designate members as collaboration coordinators to represent their organization.
Collaboration groups are used to share content and workflows allowing members the ability to participate in Workflow Manager jobs. Some of the advantages are the ability to:
- Simplify collaboration and orchestration of work across organizations.
- Share guided processes to enforce standards while participating in a collaboration effort.
- Maintain a centralized system to manage and track cross-organization activities.
Other updates
- Group thumbnails appear on job tiles.
- Use Fit to Window to review the full extent of a workflow diagram in the Design page.
- Use Select Features to select or unselect multiple locations when you define the location of a job.
- You can now review the request body and headers when testing web request steps and templates.
For more information, see What’s new in ArcGIS Workflow Manager (June 2025).
Content Store for ArcGIS
Content Store for ArcGIS is a new app for premium commercial satellite imagery that can be obtained from ArcGIS Marketplace. The app provides a single access point to high-quality, ready-to-use satellite imagery from multiple leading providers.
Content Store simplifies the process of purchasing commercial satellite imagery for organizations and enables GIS users to quickly discover, integrate, and use it seamlessly within their projects. Select an area of interest, choose dates, then review results before adding the desired imagery to the cart.
New for this update is satellite tasking, enabling users to schedule future orders to capture fresh satellite images and monitor areas of interest within ArcGIS Online.
For more information, see Enrich Your GIS with Premium Commercial Satellite Imagery.
ArcGIS Tapestry
ArcGIS Tapestry can help you learn more about your customers, their distinct lifestyles, and behavior patterns, enabling you to create a vision for your marketing strategy. ArcGIS Tapestry breaks US neighborhoods into demographic and socioeconomic segments, helping you understand your target customers and their needs.
Formerly known as Esri Tapestry Segmentation, ArcGIS Tapestry represents the third generation of the ArcGIS Tapestry system and features streamlined life mode groups, making it easier to discover shared demographic, socioeconomic, and lifestyle characteristics within a community. Urbanicity Type data has also been added to show urban population data relative to an urban core, providing greater understanding to existing demographic data.
For more information, see What’s new in Tapestry.
ArcGIS Living Atlas
Find ready-to-use, trusted content from the GIS community in the form of layers, maps, apps, tools, and 3D scenes. Easily access this collection of content to quickly kickstart your ArcGIS Online workflows, saving you time and effort.
Living Atlas content is published and updated regularly. For the latest news and information, see the ArcGIS Living Atlas home and the ArcGIS Living Atlas blog. The following are highlights of new spatial content available within Living Atlas.
More accurate 3D buildings
Using 3D buildings data acquired from Maxar and TomTom, as well as Esri Community Maps Contributors, a new Esri 3D Buildings scene layer is now available. The new scene layer is now in General Availability release and includes updated 3D buildings data for large parts of the world.
The scene layer includes hundreds of millions of multi-part buildings with more accurate 3D attributes, which supports better visualization and client-side analysis. The new layer is accessible within the 3D Basemap Gallery or directly from Living Atlas. For more information, see Enhanced 3D layers in ArcGIS.
NAIP 2023 imagery
This layer features recent high-resolution (1m or better) aerial imagery for the continental United States, made available by the USDA Farm Services Agency via the National Agriculture Imagery Program (NAIP). The NAIP image service has now been updated to include the NAIP 2023 imagery, now with coverage from 2010 through 2023. For more information, see NAIP 2023 imagery is now available in Living Atlas.
Road closures live feed
Road closures have a significant impact on people’s daily routines and travel plans. Alerting residents to road closures and potential hazards improves public safety. Community-driven road closure information is delivered via the Community Maps Program in Living Atlas. For more information about the data, contributing to the closures feed, and the Road Closures Solution, see Share your road closures with the world.
New contributor app
Living Atlas has a new evaluate and nominate app that GIS teams can use to evaluate their ArcGIS Online items against Living Atlas criteria and nominate their items for inclusion in Living Atlas. The app can be accessed from the Contribute page, where you can learn more about the ways you contributed to building a global GIS.
More information
For more information and additional details about this update, see the What’s new help topic or view all posts related to this release. You can also watch an introductory video to see new capabilities in action.
Visit the ArcGIS Online Esri Community to ask questions, view blogs, learn from peers, and submit your ideas for future enhancements.


Commenting is not enabled for this article.