A Five-Year Retrospective: GIS in the Fight Against COVID-19
By Matt Ball and Greg Milner
It was a rare public health emergency that affected everyone, everywhere. For billions of people, maps opened a way to understand the COVID-19 pandemic. This was, after all, a geographic problem. A scientific or medical understanding of the virus could not be separated from the questions of where it had spread and where it was likely to spread next.
A geographic approach, applying geographic information system (GIS) technology to create maps and dashboards, became crucial. Detailed visualizations and comprehensive analysis enhanced our understanding of infection patterns and viral mutation data.
For responders—health care workers, policy makers, and public safety officers—maps were a way to assess risks, coordinate responses, issue alerts, prioritize the most vulnerable populations, and forecast future scenarios.
For everyone else, maps didn’t always alleviate the anxiety, but they did provide perspective. Knowledge of where the virus had spread and where available resources were allocated was empowering at a time when many felt powerless.
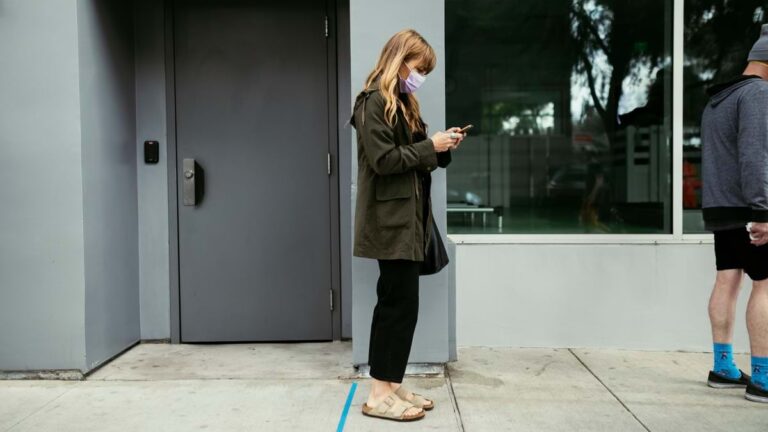
People tended to dive into their phones as they were forced to adhere to social distancing during the COVID-19 pandemic.
As the pandemic raged on, GIS pinpointed disease hot spots, informed the public, and guided management of health care resources. Real-time maps helped authorities ease collaboration and improve transparency. GIS contact tracing linked known cases with people who may have been exposed. New levels of anonymous surveillance, including wastewater testing and location data from phones, helped authorities understand behavior and monitor infections. GIS also proved instrumental in addressing both the economic fallout and recovery efforts during the COVID-19 pandemic.
Every week, GIS users from all levels of government found new ways to apply the toolset. Much of this work happened in homes as workplaces closed and workers accessed enterprise GIS in the cloud. Others gathered at emergency operations centers, working around the clock to map cases and activities.
This retrospective analysis of the COVID-19 pandemic examines how GIS users shaped and informed response and recovery efforts.
Helping Perceive the Crisis
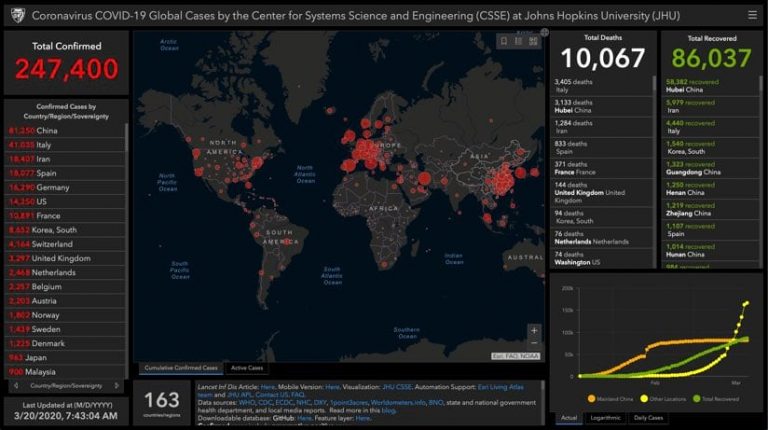
Johns Hopkins University’s COVID-19 dashboard, launched on January 21, 2020, quickly became the worldwide source for information on the pandemic. Accessing the site soon became a daily ritual for people around the globe. By March, it was the world’s go-to site for understanding COVID-19, notching more than 1 billion hits each day.
For many, this marked their initial encounter with GIS technology. They experienced a powerful demonstration of its core strength: transforming raw data into meaningful real-world context. Visitors to the Johns Hopkins dashboard saw a global visualization that quantified and tracked the pandemic’s evolution across continents.
Johns Hopkins University tracked the spread of COVID-19 cases in near real time with a map-centric dashboard using ArcGIS Online that pulls relevant data from WHO, US CDC, ECDC China CDC (CCDC), NHC, and Dingxiangyuan. (Static screenshot as of March 20, 2020.)
The groundbreaking resource was the brainchild of Ensheng Dong, a systems engineering graduate student who wanted to understand conditions in his hometown of Taiyuan, China—located 600 miles from the initial outbreak in Wuhan. Fearing for his family’s safety, Dong wanted to understand the virus’s transmission patterns and assess threats to his relatives.
The Johns Hopkins dashboard also demonstrated a savvy visual sense. Around the world, as similar maps were built, health officials grappled with how to present data in a way that communicated the urgency of COVID-19 without causing crippling fear. Dong’s map featured dots whose size communicated severity in each region. The red-on-black color scheme was chosen for its association with danger and urgency.
Mapping to Understand Behavior and Vulnerability
One of the greatest challenges in the fight against COVID-19 was human mobility. A person could contract the virus on one side of the world and, within hours, infect someone else thousands of miles away. Without vaccines or treatments yet available, it was critical to create distance between people in an effort to “flatten the curve” of new cases.
Scientists developed sophisticated analytical models that could quantify and predict the surge in new cases. These powerful predictive models became essential planning tools for public health officials.
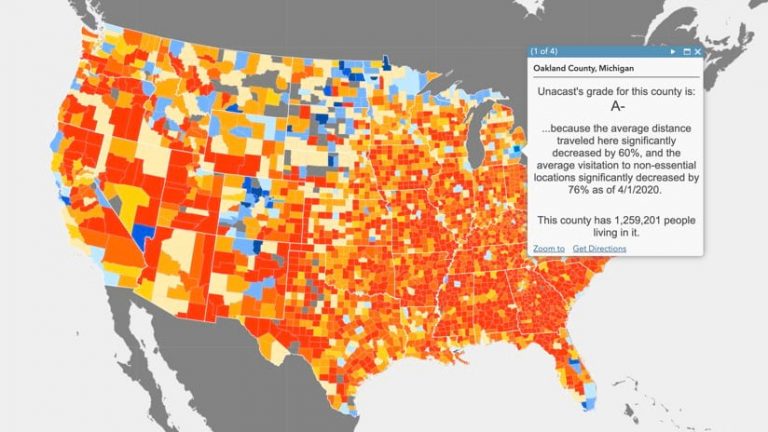
Data on mobility before and after social distancing efforts, like this data from Unacast, helped inform the model with a more accurate understanding of the spatial patterns of social distancing compliance.
Penn Medicine’s Predictive Healthcare team created a model called CHIME (COVID-19 Hospital Impact Model for Epidemics). The CHIME model provided up-to-date estimates of how many people would require hospitalization, and how many ventilators and ICU beds they would require. It also factored in social distancing policies and how they might impact disease spread.
Bringing models into GIS provided the means to visualize the pandemic geographically and tie outputs to solutions designed to slow its spread.
By adding location information to contact tracing, public health analysts were able to perform location analytics to illuminate the places where the virus spread.
One data source used to validate adherence to distancing orders came from anonymized phone records and the distributed activity of hundreds of thousands of mobile devices using the Facebook app with location tracking turned on. Facebook’s Data for Good showed how people moved and gauged the effectiveness of rules and actions to slow the pandemic.
The key concepts of geography—place, time, and scale—can help data scientists clean the noise, understand the context, and answer the questions about when and where.
Professor Ming-Hsiang Tsou
Center for Human Dynamics in the Mobile Age at San Diego State University
Adopted by Epidemiologists for Syndromic Surveillance and Contact Tracing
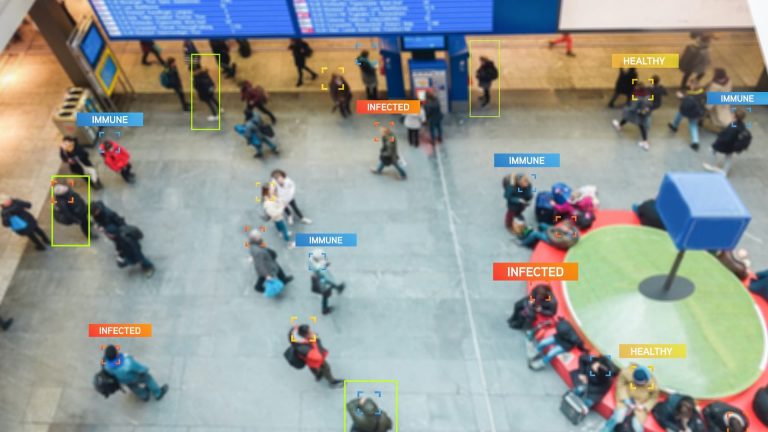
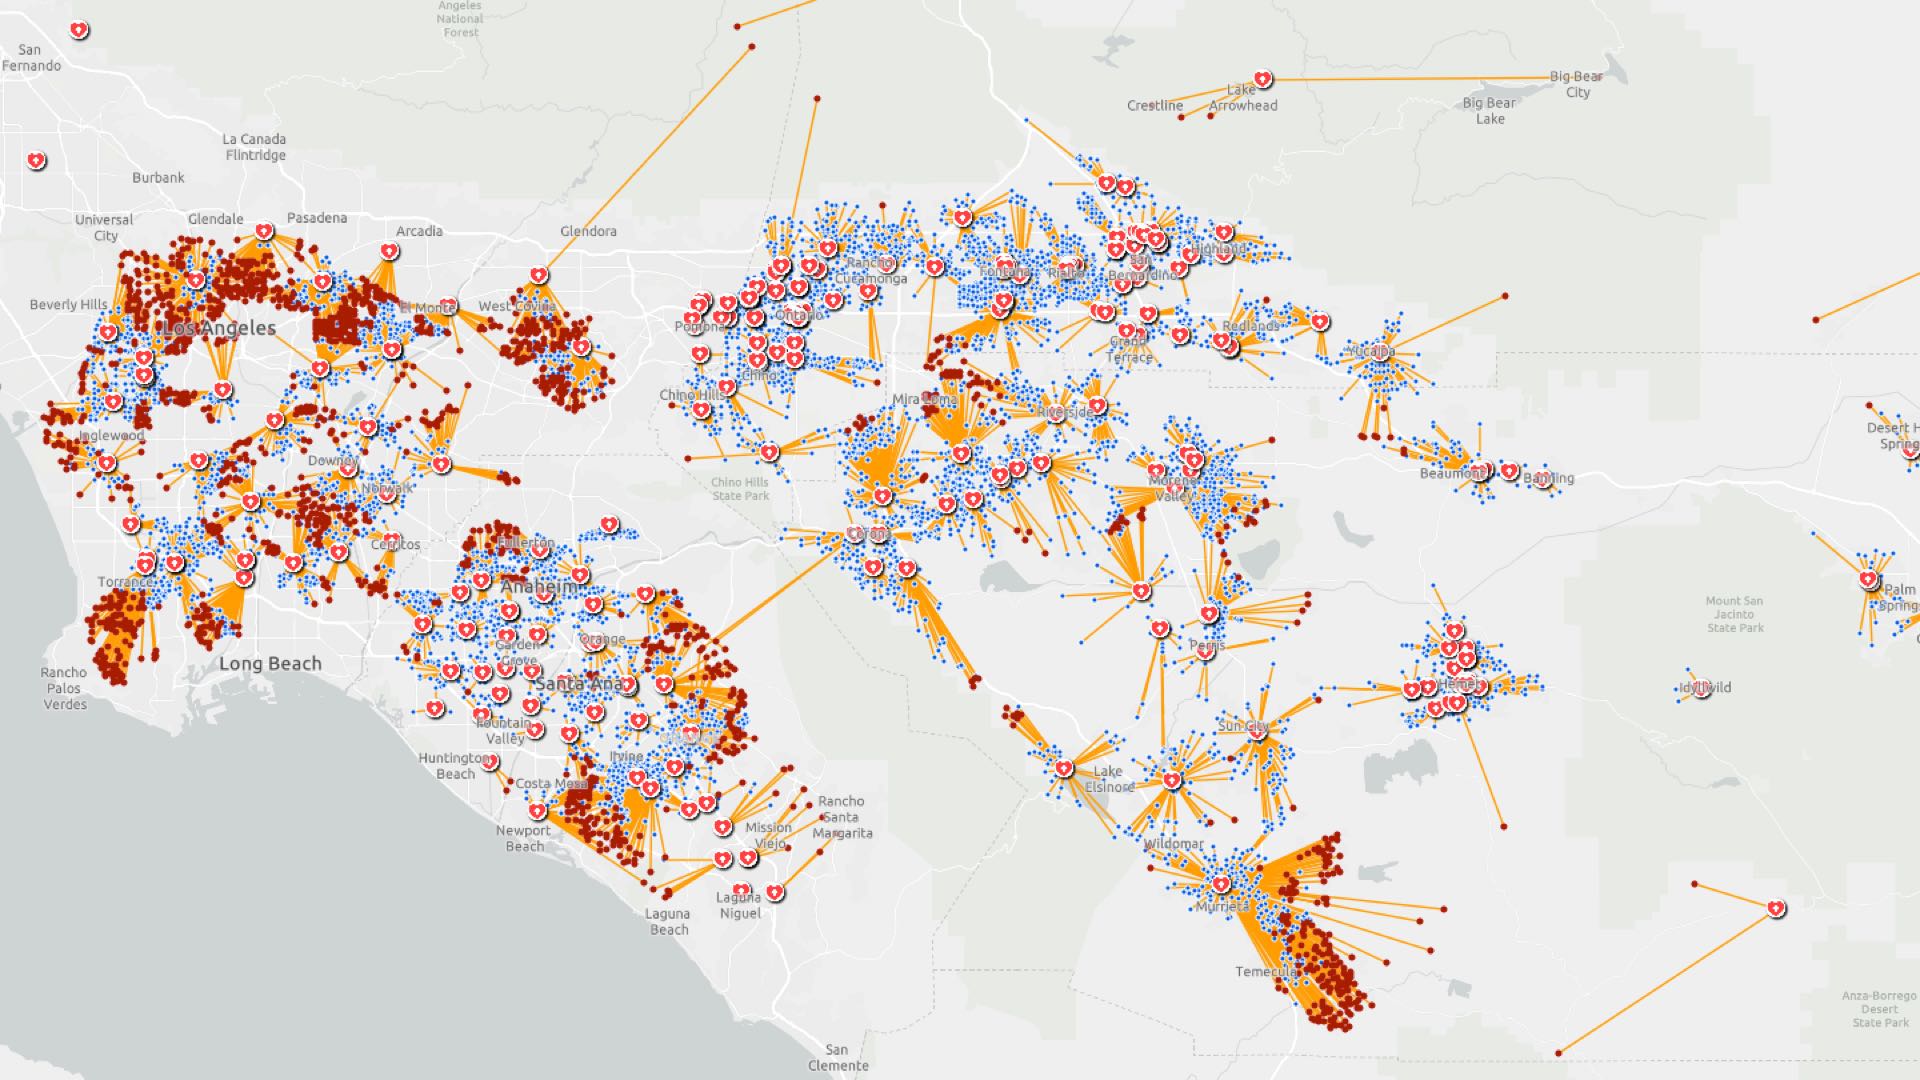
Epidemiologists used GIS to study the virus as it moved. They mapped things like credit card transactions and mobile phone location traces to see where an infected person had been and who they may have met.
This analytical approach helped scientists and policymakers develop the epidemiologic curve for the virus, aided by maps that deepened their understanding and informed their actions.
Maps helped guide proactive efforts to identify hospital networks and the volume they serve as depicted in this map. Maps also helped find suitable underutilized facilities that could serve as makeshift hospitals to increase capacity if needed.
GIS analysis also considered demographic data to determine the most at-risk populations, such as the elderly and people with underlying health conditions. Maps could identify the locations where the most vulnerable people lived, such as senior communities and retirement destinations. Health organizations pinpointed COVID-19 response to these locations first.
When you start looking at the affected populations, it becomes so much more human.
Professor Lauren Gardner
Johns Hopkins Center for Systems Science and Engineering
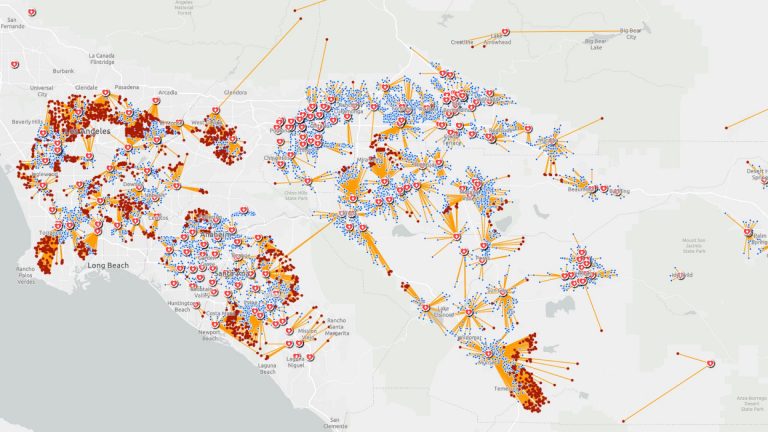
Tri-County Health Department in Colorado embraced location technology to investigate with whom an infected person came into contact, where cases were occurring, and where contacts spent time.
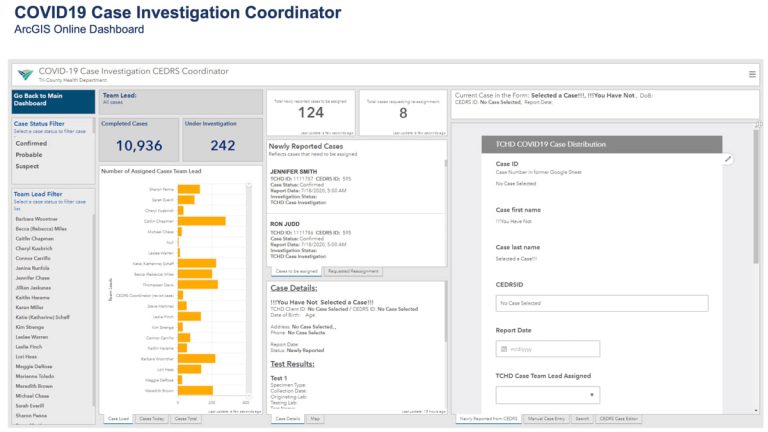
By tracking symptoms, case investigators could make informed guesses about where exposures occurred. In addition to daily dashboard updates for its whole jurisdiction, the Tri-County Health Department team compiled 15 separate municipal dashboards to aid local decision-making.
The case investigator sees details for each of the cases they are assigned, recording information and notes on a number of smart forms. They can see what has been collected so far versus what needs to be collected.
All health departments around the globe were working in uncharted territory with new volumes of real-time data. Seeing the virus spread on maps cut through data complexity. Understanding the relationships among cases, contacts, and distances helped improve response strategies.
Addressing Hospital Capacity and Disrupted Supply Chains
COVID-19 presented a massive problem for medical logistics as hospitals struggled to maintain enough resources to treat those with serious cases.
By March 2020, just a couple months into the pandemic, the American Hospital Association was predicting that hospital bed capacity would be exceeded by 270 percent for inpatient care and by about 500 percent for intensive care.
The US Army Corps of Engineers (USACE) looked for alternative sites for patients to be treated. By late April 2020, over 450 field inspectors had used an ArcGIS Survey123 app each day to gather details on potential sites. This information included HVAC conditions and proximity to existing hospitals. The data was displayed in real-time dashboards, aiding in the prioritization of projects. USACE team members assessed over 1,150 potential sites and converted 32 of them into alternative care facilities, adding 15,074 hospital beds.
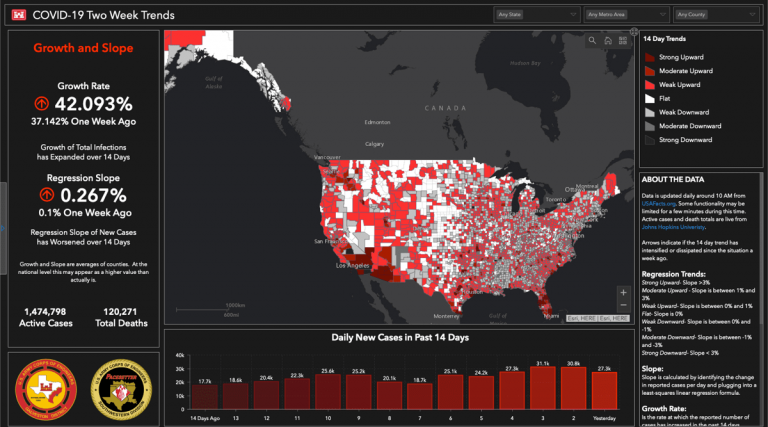
USACE's Two Week Trends dashboard grew in popularity. This static image was captured on June 22, 2020.
The biggest thing is modeling. We’re looking at some amazing analytics to be able to figure out where we see the growth of the threat and where we see the bed shortage.
Lieutenant General Todd Semonite
US Army Corps of Engineers
The pandemic stretched medical supply chains to the breaking point. Hospitals struggled to acquire enough masks, gloves, and other personal protective equipment (PPE). Direct Relief, a nonprofit organization that aims to improve supply chains during disasters, worked to get medical supplies to Wuhan, China, during the earliest days of the pandemic.
As the pandemic spread, Direct Relief delivered more than 10,000 shipments across all 50 US states and 62 other countries. GIS maps helped their staff identify where the need was greatest, as well as track supply chains to ensure delivery.
Mapping Testing Sites
By spring 2020, the US had emerged as the epicenter of the pandemic. The lack of a testing regimen was part of the problem. There was still widespread confusion regarding where people could—and which people should—get tested for exposure.
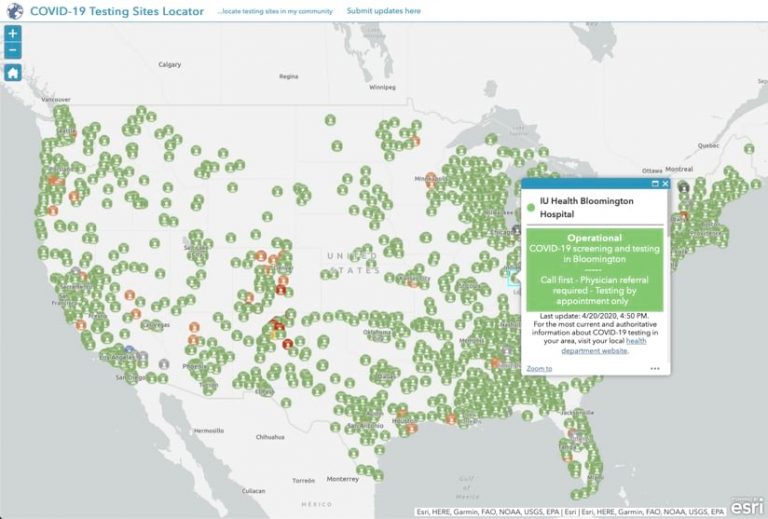
GISCorps played a major role in alleviating the confusion. Members talked to public health experts and decided the best way to convey testing information was to put it on a national map.
The COVID-19 Testing Sites Locator provided a nationwide map for where people could—and which people should—get tested for exposure to the virus.
Around 300 volunteers created a map that contained more than 70,000 test sites. They originally conceived the map as a stopgap while other sources were created. Instead, the project lasted well into 2022 and received over 17 million views.
Testing Wastewater to Detect Spread and Isolate Infected People
The City of Tempe, Arizona, implemented a wastewater testing system to detect biomarkers of the virus. This initiative, a collaboration with Arizona State University, involved weekly testing at six sites, with the largest site covering more than 183,000 households. The data was mapped with GIS and made public, helping residents and city officials monitor trends and make informed decisions. The system was cost-effective and anonymous, providing a broad overview of the pandemic’s impact.
The city expanded testing to smaller areas for more detailed insights and extended the program to neighboring towns. Tempe’s approach enhanced public health and fostered trust between the community and local government.
The GIS trace tool automatically pushed test results to a public map and notification repository.
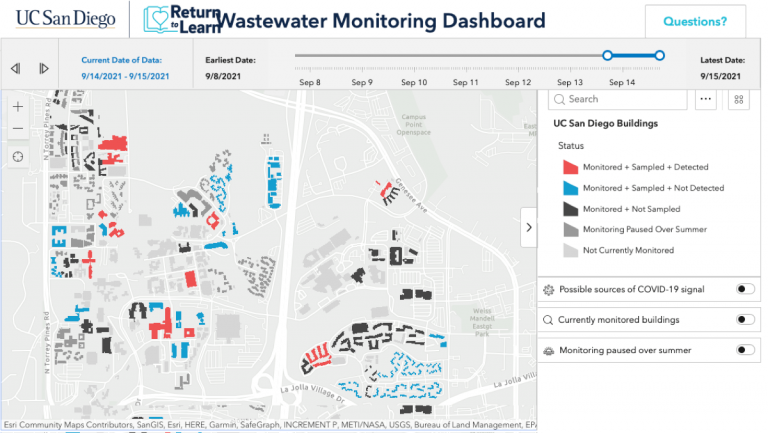
University of California, San Diego implemented a similar wastewater monitoring system to map the presence of the virus and control its spread on campus. By using robotic sensors and GIS technology, the university detected viral particles in wastewater before individuals exhibited symptoms. The anonymous approach alerted health care officials of any presence of the virus in a building, which triggered early testing and isolation to halt the spread.
We had several examples where we could see that it was a single infected individual in a building of several hundred students. When we found that person and moved them to isolation, the wastewater was negative the next day.
Natasha Martin
Associate Professor of Global Public Health at University of California, San Diego
This proactive approach allowed the university to maintain on-campus housing and in-person activities while effectively managing the health of the community. The system proved to be highly sensitive, detecting over 85 percent of residential cases. With this success, the system was expanded to monitor wastewater for the entire city of San Diego, serving its 1.3 million residents.
Understanding Economic Impacts
Health statistics alone don’t show how COVID-19 impacted communities. The pandemic also caused economic problems, which resulted in businesses closing and people losing jobs.
An economic impact survey in Pennsylvania counties showed significant regional effects. The survey responses were mapped with GIS to provide a detailed view of the areas and industries hit the hardest, which helped guide targeted relief and economic rebuilding efforts.
Economies do not stop at community or county borders. We need to work together as a regional team to flip the switch when the economy is ready to start again.
David Zellers
Director of Commerce, Montgomery County, Pennsylvania
In Kentucky, the state developed a COVID-19 Economic Impact Dashboard to provide detailed maps of unemployment rates and a vulnerability index by county. This index measured the likelihood of job disruption based on the mix of industries in each area. Seeing unemployment levels and modeling the vulnerability of businesses helped officials prioritize aid.
At a time when social distancing precluded unnecessary contact, the Kentucky Commonwealth Office of Technology used GIS to conduct virtual site visits, a key part of the state’s strategy to consider the plight of all businesses.
It’s not just about a major plant shutting down. It’s also the places people go to eat lunch, and the gas stations, and everything else that gets affected by the closing.
Kevin Hogue
GIS Specialist, Kentucky Commonwealth Office of Technology
Providing the Services People Needed
Municipalities and county governments were quick to use GIS to identify and support the most vulnerable residents and families in a number of ways.
School districts in the city of Philadelphia and in Palm Beach County, Florida—each serving around 200,000 students—faced the challenge of bridging the digital divide during the pandemic. Both districts rapidly acquired laptops and leveraged GIS to identify and support the students who needed assistance.
Palm Beach County mapped the locations of students who received free lunches, an indicator of households that likely lacked broadband connections. This information helped the county place Wi-Fi hotspots and fiber installations where clusters of students lived. Philadelphia’s PHLConnectED program used the city’s stress index to prioritize the distribution of wireless routers and establish community computing centers.
It goes beyond kids. That’s our primary focus, but now you’ve got parents and other adults in the home who have broadband access, which opens up whole new worlds of possibilities for them economically.
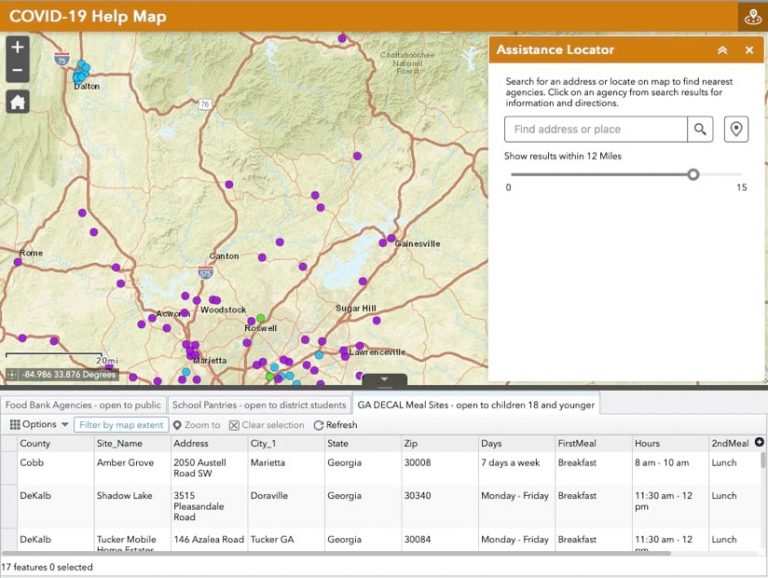
The Atlanta Community Food Bank launched its COVID-19 Help Map for families in need, communicating food pickup sites across the Atlanta metro region. People without access to the internet could text a simple message, such as “find food,” to a phone number to get a reply with the nearest food pantry locations.
The COVID-19 Help Map was created by ACFB's marketing data analyst, Nicholas DiSebastian. It allows users to search for the nearest agencies on a map, along with information on hours of operations and driving directions.
The Atlanta food bank distributed nearly one million pounds of food between March and April of 2020. As the crisis continued, the pace picked up. It delivered 250,000 pounds of food per week to 21 public school sites for those affected by school and business closures.
Governments Pivot to Address Emerging Challenges
After weeks of people mostly staying indoors, parks and green spaces across the country experienced a surge in activity.
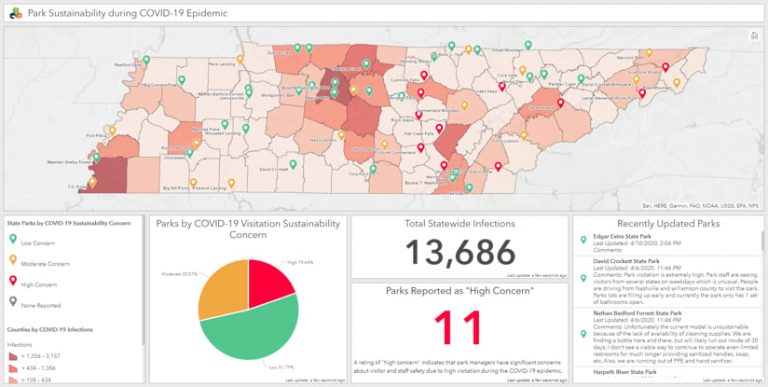
The Tennessee Department of Environment and Conservation devised a location strategy to safeguard park staff and limit activities in parks with rugged or steep terrain—places where park rangers could be exposed to the virus during rescues. When maps showed that parks with ample cleaning supplies had lower concerns, the supplies were more widely distributed.
The Tennessee State Parks COVID-19 dashboard gave decision-makers a means to dive into individual parks and to see summaries for all parks related to sustainability during the pandemic.
When the Navajo Nation started experiencing high COVID-19 cases, the Indian Health Service addressed a long-standing lack of in-home water access. The need for handwashing spurred construction of 59 new water connections and distributed 37,000 water storage containers.
The fast-paced construction lasted from mid-July through September 2020. It was guided and communicated through shared maps, with a dashboard that marked progress.
It shouldn’t have taken this disaster to get us here, but now there’s a whole new recognition of what tribal resilience means and how the federal government can work together.
Captain David Harvey
Indian Health Services
Distributing Vaccines
When vaccines finally became available in December 2020, GIS helped identify suitable facilities for storage and distribution, prioritize populations in need, manage inventory, ensure transparent communication, and address gaps in access. Real-time GIS dashboards monitored the progress of vaccine administration, while targeted outreach to special populations ensured no one was left behind.
GIS technology enhanced collaboration with state agencies to synchronize and coordinate operations effectively. The South Carolina National Guard, for example, identified and monitored high-risk populations, such as those with underlying health conditions, and areas with limited access to care.
I never knew about GIS before all this, and it’s a whole new data-driven way to look at COVID-19. At this point, it’s the only way we look at it.
US Army Major General Brad Owens
South Carolina National Guard
When Kansas received its first vaccine shipments, the GIS team at the Kansas Department of Health and Environment prioritized recipients for doses.
Vaccine staff used a GIS dashboard to locate priority populations and run what-if scenarios for specific counties or groups. Distribution strategies accounted for a multitude of variables that were key to encouraging participation.
Viruses Mutate, Creating New Challenges
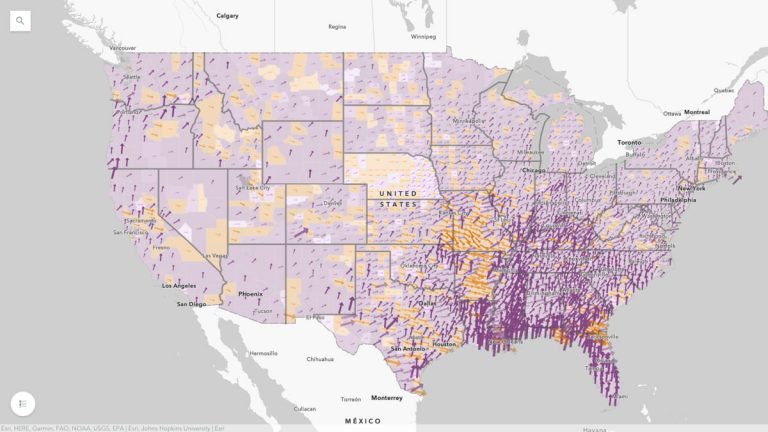
During the many waves and phases of the COVID-19 pandemic, a map-based view proved compelling and informative—letting people know whether things were getting better or worse in their area.
The dynamic weekly "Which Way Are Things Going?" map gave a county-by-county view of active cases.
The interactive map Which Way Are Things Going? gave a county-by-county view of active cases. The dynamic map allowed viewers to see at a glance whether cases pointed up or down and how nearby communities were faring.
Though the COVID-19 pandemic is five years in the rearview, the lessons learned carry relevance today. Recent outbreaks of measles, Marburg virus, Mpox, and the latest strain of H5N1 avian influenza serve as stark reminders of what’s at risk and the value of maps and location analysis. These lessons, and GIS tools, will help us monitor the spread of disease, map the needs of vulnerable people, and deliver effective response.
Matt Ball is the editor of the Esri Blog and writes about applications of geospatial technology for all its departments. With nearly 30 years of reporting on GIS technology, he has chased future-forward user stories and watched as wild ideas, innovative tools, and enterprise-wide geographic approaches have become common practice. Prior to Esri, he edited GeoWorld magazine, organized the GeoTec Event, founded V1 Media, and launched Sensors & Systems and Informed Infrastructure magazines. He’s thrilled to be closer to GIS users, and at a company that pushes what’s possible.
Greg Milner
Greg Milner is a writer in the strategic content group at Esri, where he tells stories about how location intelligence is transforming our world and how we perceive it. A former magazine editor and political speechwriter, he is the author of the books "Perfecting Sound Forever: An Aural History of Recorded Music" (a finalist for the National Book Critics Circle Award) and "Pinpoint: How GPS Is Changing Technology, Culture, and Our Minds."