A supply chain is a complex set of dependencies, and each node—supplier, subsupplier, shipper, or warehouse—represents a risk to the whole. Supply chain managers may be tired of the refrain that risk is rising with increasingly inclement weather and geopolitical strife. But they can’t afford to ignore it.
Esri’s Cindy Elliott has worked with companies that manage some of the world’s largest supply chains, and has observed several habits of best-in-class companies:
- A dedication to mapping the location and role of each supply chain player
- A talent for creating digital supply chains—capable of signaling disruptions and other risks
- An investment in analytical capabilities that help companies act fast and short-circuit interruptions
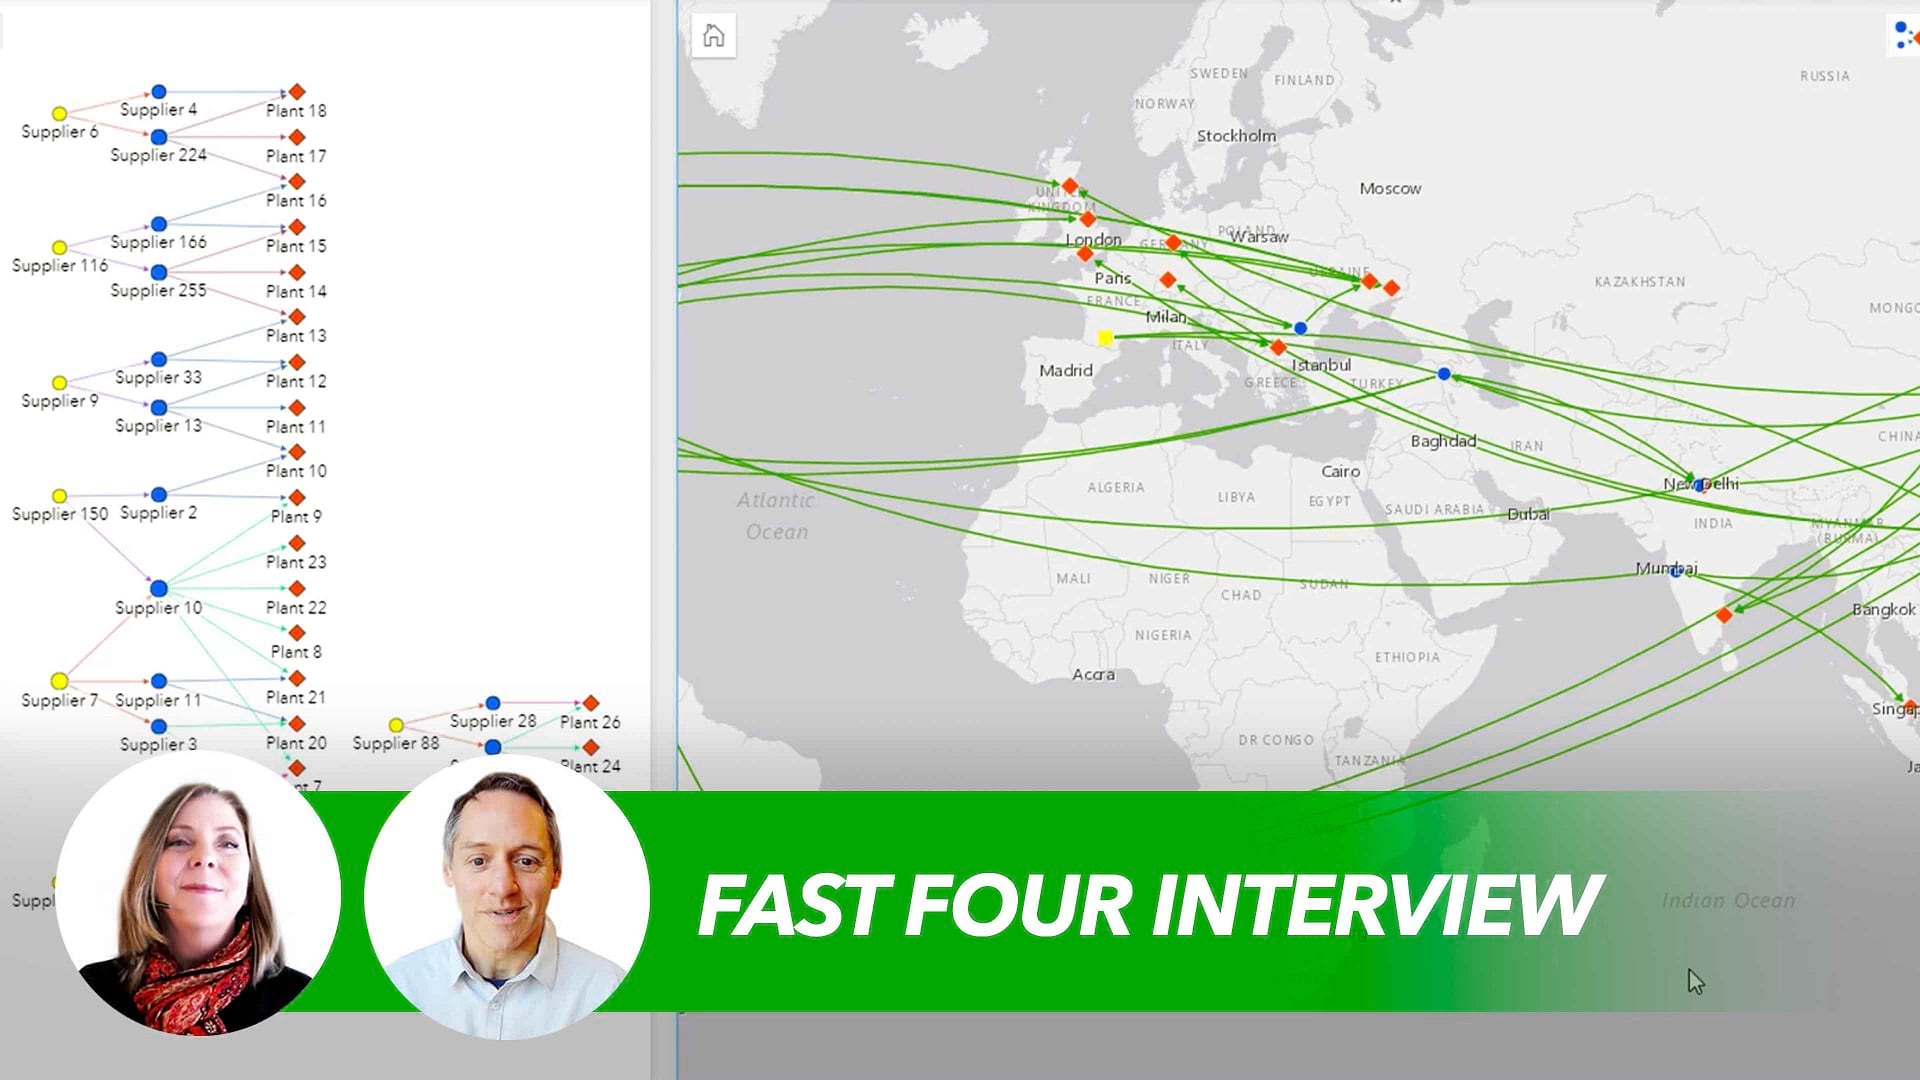
In this Fast Four interview, Cindy explains how location intelligence, drawn from geographic information systems (GIS) technology, points companies toward stability in today’s supply chain. Watch the brief video interview or read the transcript below.
For more industry-insider interviews, visit WhereNext’s Fast Four library.
Chris Chiappinelli: Welcome to the WhereNext Fast Four, our series of short conversations about the past, present, and future of location technology in the business world. Today, we are focused on supply chain, and I’m glad to have Cindy Elliott with me to talk about how product and service companies are using GIS technology—geographic information systems.
Cindy, we always like to begin the Fast Four with a quick rewind. So maybe you can tell us a little bit about what supply chain challenges companies were thinking about and trying to figure out when they first used GIS.
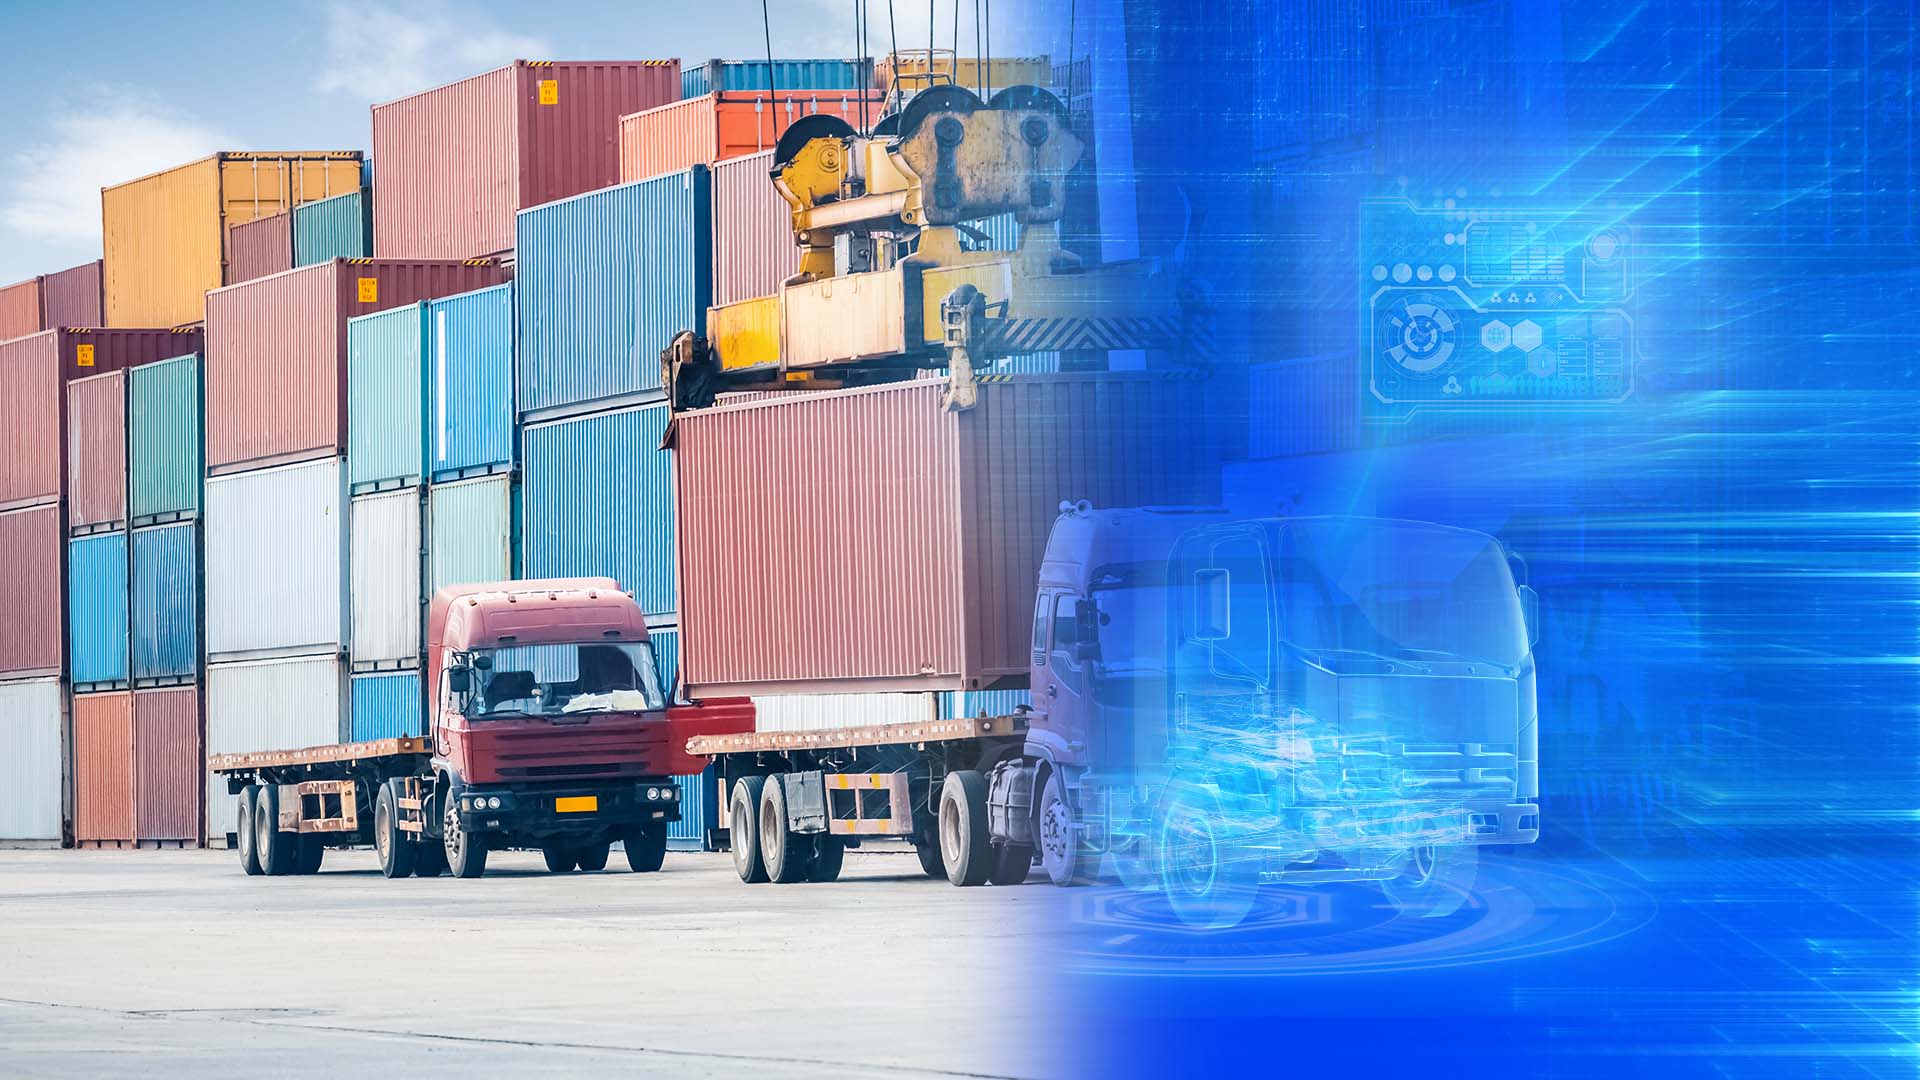
Cindy Elliott: Absolutely, Chris. It actually started quite simply. It provided operations staff [a way] to map and visualize assets in their global supply chain, whether that was on the fulfillment network side—such as where are the factories, warehouses, truck and rail shipments, inbound ports, etc.—or on the supplier network side—which is, Where are the locations of suppliers, often from Tier 1 to Tier 5, whenever they had that information. Where are those facilities through the production life cycle?
This allowed those operation managers to enrich their spreadsheets, often referred to as ledger-based systems such as ERP, CRM, or SCM, to generate a geographic or spatial view of the company’s network. But over time, those systems have actually integrated GIS to provide basic basemaps as a demand for visualization of supply chain has become pervasive.
Chiappinelli: I’m guessing that sets the stage for a lot of what’s happening today. Can you share a couple of examples of how companies are using this technology now?
Elliott: Actually, now they’re building on that digital footprint . . . often referred to as a digital supply network, in two essential ways from what we’ve seen. First, monitoring the flow of goods from raw material through to the end consumer, providing the ability to assess risk and disruptions. Not only to ensure quick response in times of disasters, but also to anticipate and minimize disruptions as much as possible before they occur. Whether that’s from severe weather issues, geopolitical threats, and/or climate change.
And secondly, they want to understand the geographic context of dependencies across the supplier ecosystem. They want to promote responsible sourcing and sustainability through supply chain traceability, transparency, and reporting.
For example, let’s consider a consumer goods manufacturer who can connect and visualize key materials for their products from the cotton farm through the processing plants and into the finished goods, ensuring that at each step, suppliers are deploying safe labor practices; using only conflict-free materials; and reducing operational impact related to land, energy, and water.
Chiappinelli: Obviously, important work there. What do you see ahead? Is there a particular use for GIS that’s maybe just emerging today that’s standing out to you?
Elliott: Again, I think where the firms are really focused is building out that intelligence within that digital supply network. Organizations are just beginning to tap into big data, or what often we refer to as GeoAI. They want to predict climate impacts to their operations over time, their supplier locations, their distribution networks, and their facilities management.
Now they can test simulated scenarios digitally to understand the impacts to the physical environment without disrupting the business model today. And they’re calculating risk over that extended supply chain over time and by levels of severity to best prepare their organization for future impacts, whether that’s 1 year, 5 years, or 20 years out.
The biggest value that we see is that location technology enables businesses to bring this practice in-house, have real-time intelligence at their fingertips, most likely in a centralized intelligence operations center. They want to have the ability to evaluate business shifts as they’re occurring and not be dependent on outside services or advisors periodically to provide this information.
Chiappinelli: That’s really interesting—in-house capabilities for visibility, for simulation, for understanding how the business is going to evolve. Excellent. Thank you, Cindy, for that insight.
If you are interested in learning more about geospatial technology in supply chain work, check out the URL on-screen. If you’re watching us on WhereNext, you should be able to click on the link in the article.
If you scroll down to the bottom of the article, you should see a Fast Four tag. That will get you to all of the videos in our growing collection.
For the WhereNext Fast Four series, I’m Chris Chiappinelli. Thanks very much for joining us.
The Esri Brief
Trending insights from WhereNext and other leading publicationsTrending articles

December 5, 2024 |

March 3, 2026 |

June 23, 2026 |

March 17, 2026 |

April 7, 2026 |

June 9, 2026 |