With a few quick edits, you can customize the style of vector tile layers with your own colors, patterns, icons, and labels. This article shows you how to restyle the Esri Light Gray Canvas basemap into a brightly colored, slightly whimsical map.
‘Let’s make the water blue!’
My 6-year-old niece, Maria, and I were making a map of our favorite places. We were using the Esri light gray canvas vector basemap. Esri vector basemaps provide a foundation for your map, using styles that you can edit. The light gray canvas map initially seemed like a good choice for our place-finding project. Lots of colors, objects, and labels would only distract us, right? But now I realized it was hard for Maria to see the oceans, lakes, and rivers because they were in neutral shades of gray instead of blue like she expected. Water is a common theme with our favorite places so she was distracted after all.
If only we could personalize the map to include blue water. But alas we aren’t professional cartographers. What could we do?
Then I remembered – Map Viewer Classic has a vector tile style editor. Vector tile layers deliver map data as vector files that are dynamically displayed on the client based on a style delivered with the layer. The dynamic nature of these layers means that the same data can be styled in a variety of different ways.
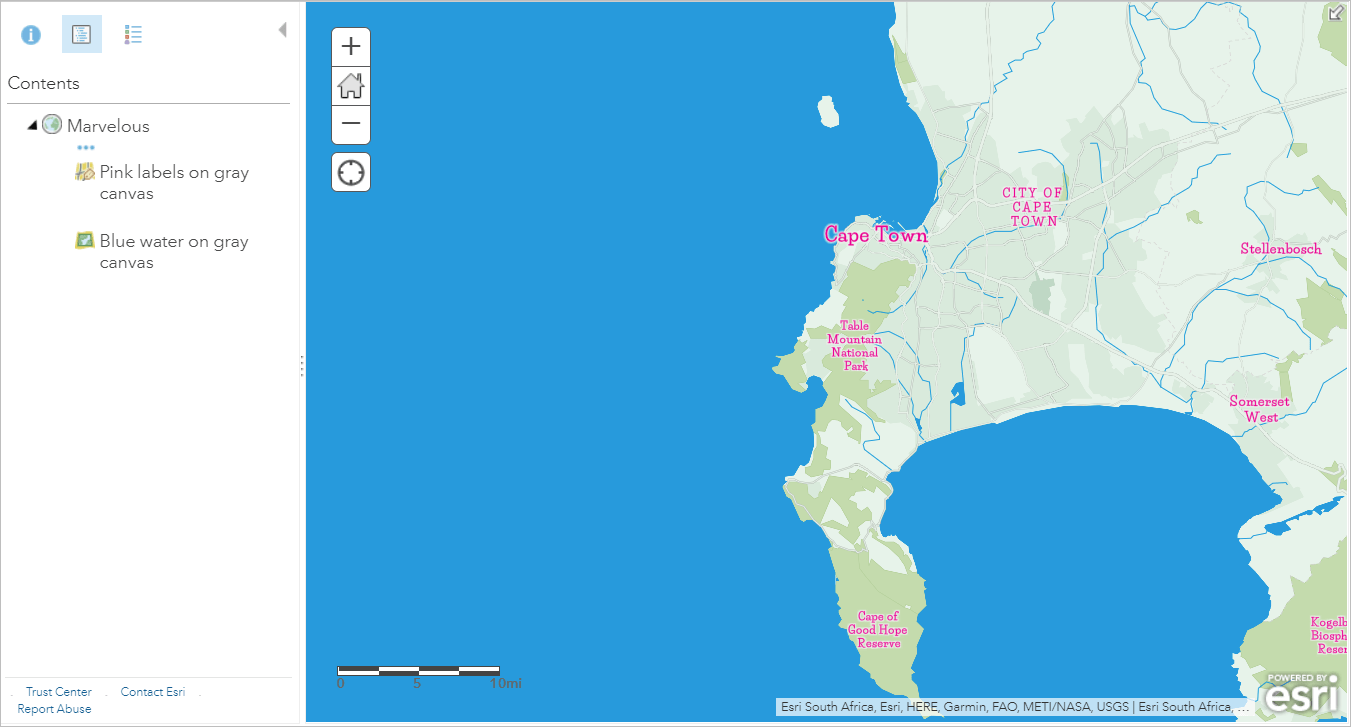
With a few quick edits, we made our own brightly colored, slightly whimsical map style. We declared it Marvelous.
Here’s how we customized one of Esri’s vector tile layers, the Light Gray Canvas vector basemap, to make our own map style.
To complete this workflow, you need an ArcGIS account, Map Viewer Classic, and privileges to create content.
Customize the base layer
1. Sign in to ArcGIS Online with your ArcGIS account, open the Light Gray Canvas item page, and click Open in Map Viewer > Open in Map Viewer Classic.

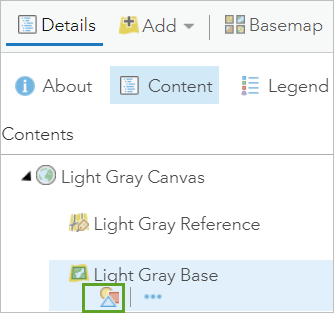
2. In the Details > Content pane, click Light Gray Canvas, point to Light Gray Base, and click the Change Style button.
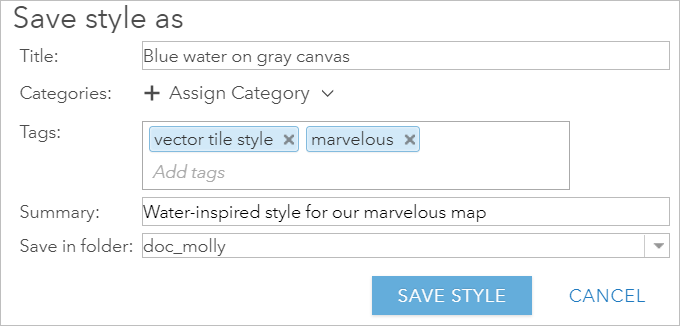
3. Fill in details for your copy of the style, and click Save Style. Maria and I named our style “Blue water on gray canvas”.
The Change Style window opens. There are lots of options to consider. We decided to keep it simple and make quick edits to colors.
4. In the Change Style window, click the pencil-shaped quick edit button.
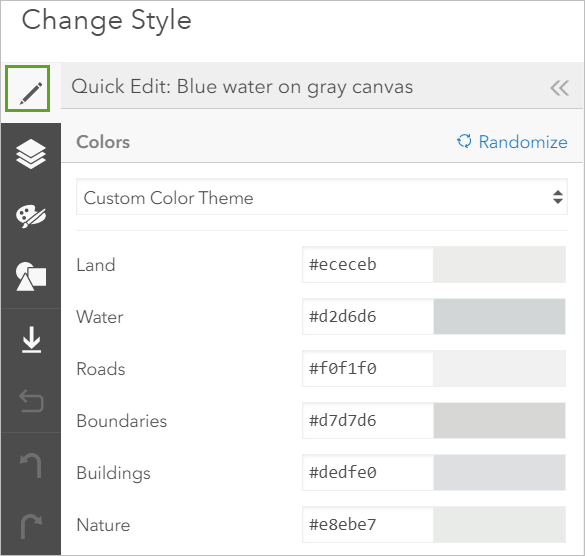
Quick Edit groups layers into six categories—land, water, roads, boundary, buildings, and nature. The tool makes it easy to style all the layers within a group at once.
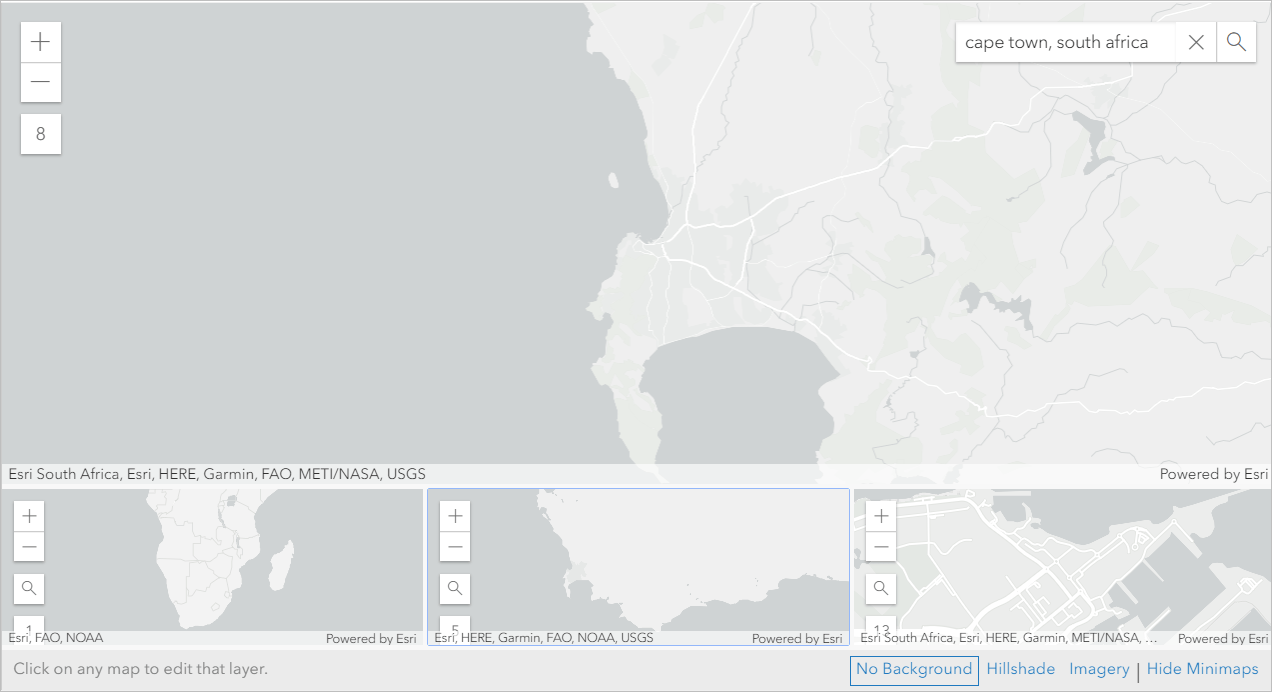
Before we started changing the colors, we found Maria’s favorite place in the world—Cape Town, South Africa. We couldn’t resist those cute mini maps. And we also wanted to see our color choices at different visible ranges.
5. In the main map, use search to find a location you are interested in, such as Cape Town, South Africa. Find the same place in the mini maps and zoom to different scale ranges such as country, region, and neighborhood.
The editor provides a variety of ways to select a different color—for example, you can click the current color and use tools to choose a new color.

The color editor was fine. But Maria and I wanted a more personalized color for our map. Using the eyedropper tool from SnagIt Editor (most image editing apps have something similar), we identified a blue hexadecimal (hex) value from her recent birthday party invitation.
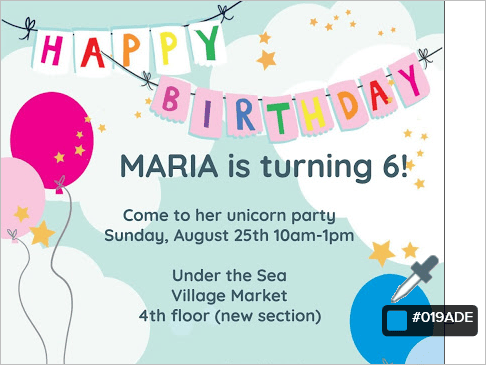
We used the hex code to change the water color in the map.
6. Change the water color value to #019ade.
The maps automatically update with the new color.
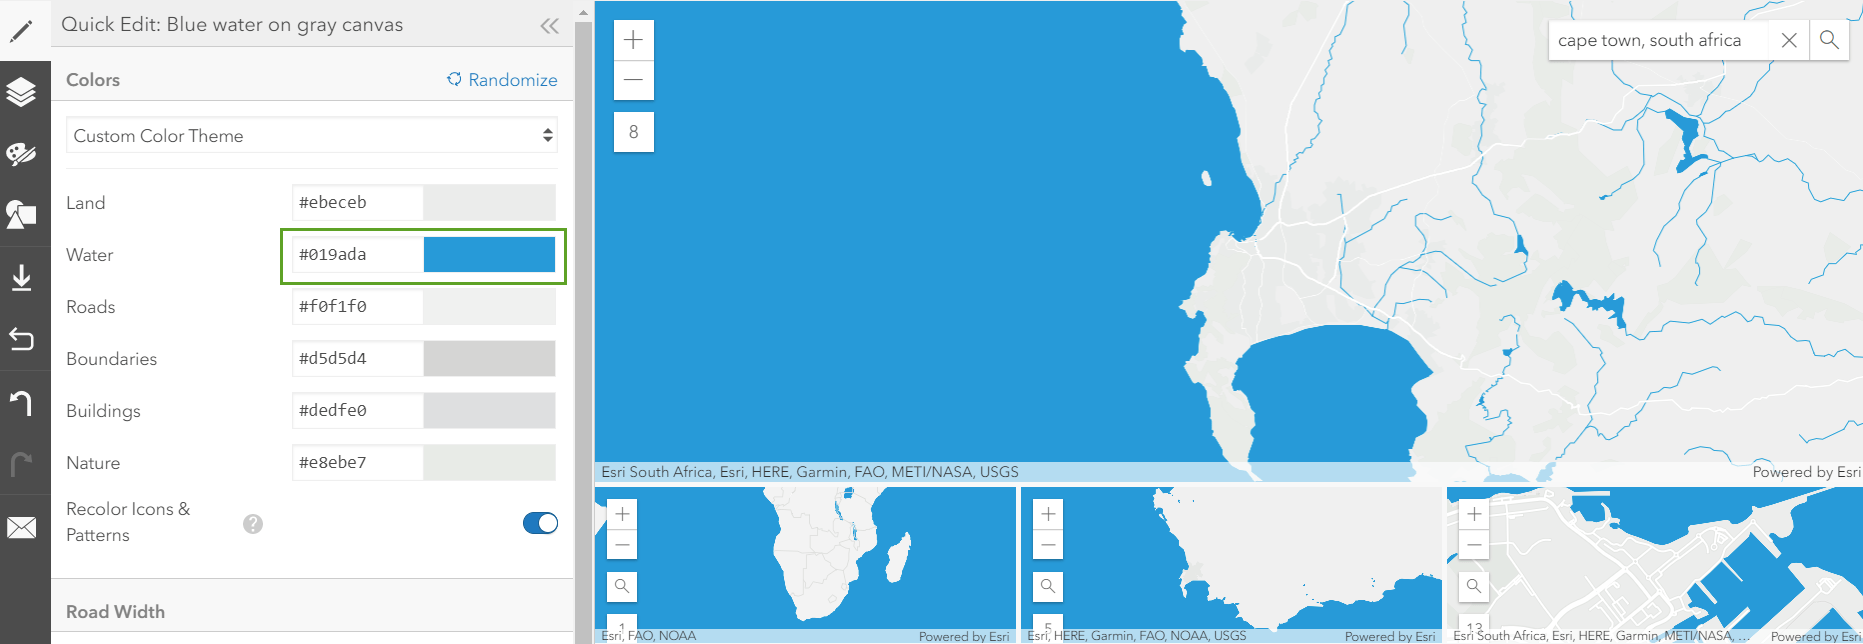
We changed some of the other colors to better highlight the water.
7. Change other category colors if you want, and click Save style and close to save your style and return to the map.
Customize the reference layer
Since changing the water color was easy and fun, we decided to change the style of the place names too. Labels are in a separate layer but the process is similar.
1. In the Details > Content pane, click Light Gray Canvas, point to Light Gray Reference, and click Change Style.
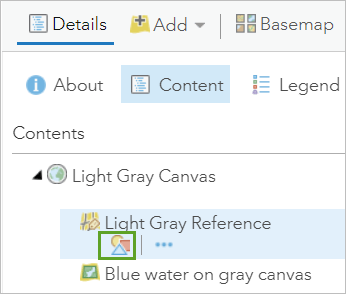
2. Save a copy of the style, open the quick edit pane, and, next to Label Colors, choose Pick Label Colors.

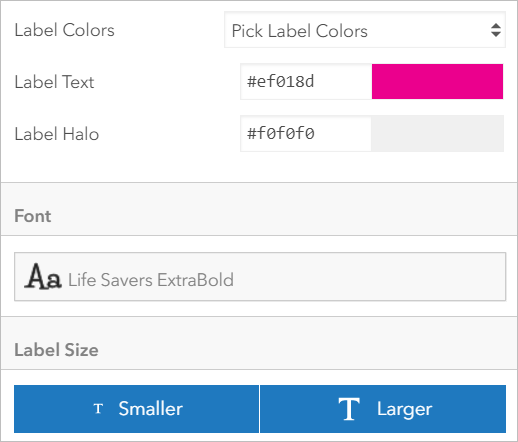
We used our eyedropper tool to get the hex code from the pink balloon in the birthday invitation. We also explored a bunch of the fonts until we found one we liked—LifeSavers ExtraBold, of course!
3. For label text, enter #ef018d. For font, choose LifeSavers ExtraBold. For label size, click Larger twice. Click Save style and close to save your style and see your personalized map.
Done. With just a few quick edits, we made our own map style. Marvelous.
Learn more about updating vector tile layer styles
- Update vector tile layer style help topic
- Customize Esri vector basemaps story
- Style a vector basemap tutorial
This article was originally published on September 6, 2019 and has been updated.

Article Discussion: